 Azure Stream Analytics Integration Guide
Connect to Azure Stream Analytics to run and watch Stream Analytics jobs from MaestroHub. This guide covers connection setup, function configuration, and pipeline integration.
Overview
Azure Stream Analytics runs SQL queries over streams from Event Hubs, IoT Hub and Blob Storage. The connector drives the jobs through Azure Resource Manager:
- Reading — a job's state, SKU and streaming units, and optionally its inputs, outputs, functions and query; the jobs in a resource group, filtered by state or name
- Controlling — start, stop and scale a job, optionally waiting until Azure reports the change finished
- Checking — ask Azure to test that one of a job's inputs or outputs can connect
- Monitoring — read the job's Azure Monitor metrics: input and output events, watermark delay, SU % utilization, errors and backlog
- Authentication — a service principal, a managed identity, or the Azure default credential chain
Stream Analytics has no ingestion API. A job reads its inputs — an Event Hub, an IoT Hub, a Blob container — so to feed a job from MaestroHub, write to its input with the Azure Event Hubs or Azure IoT Hub connector, and use this connector to run and watch the job.
Stream Analytics addresses a job by resource group and name. The resource group is set on the connection, and every function on that connection works on jobs in it.
Connection Configuration
Creating a Stream Analytics Connection
Go to Connect, click New Connection, and choose Azure Stream Analytics.
1. Profile Information
| Field | Required | Description |
|---|---|---|
| Profile Name | Yes | A descriptive name for this connection |
| Description | No | Free text |
| Labels | No | Key/value labels for organisation |
2. Subscription & Resource Group
| Field | Required | Description |
|---|---|---|
| Subscription ID | Yes | The Azure subscription that holds the jobs |
| Resource Group | Yes | The resource group of the jobs |
3. Authentication
| Field | Default | Description |
|---|---|---|
| Authentication Method | Service Principal | Service Principal, Managed Identity, Default Credential Chain, or None (local simulator only) |
(Service Principal)
| Field | Required | Description |
|---|---|---|
| Tenant ID | Yes | The Microsoft Entra ID tenant (directory) ID |
| Client ID | Yes | The app registration's application (client) ID |
| Client Secret | Yes | A client secret of the app registration |
(Managed Identity)
| Field | Required | Description |
|---|---|---|
| Client ID | No | The client ID of a user-assigned identity. Leave empty for the host's system-assigned identity |
Default Credential Chain takes no fields: it tries the environment, workload identity, managed identity and the Azure CLI, in that order.
None sends no token. Azure Resource Manager refuses that, so it is accepted only together with a Custom Management Endpoint, for a local simulator.
4. Advanced
| Field | Default | Description |
|---|---|---|
| Custom Management Endpoint | — | A different Resource Manager endpoint, for a local simulator. Leave empty for Azure |
| Connection Timeout | 30s | Bounds connecting and Test Connection (1s–300s). Functions are bounded by their own Timeout |
Permissions
Grant the identity these roles on the resource group:
| Role | Covers |
|---|---|
| Stream Analytics Reader | Get Job, List Jobs, Test Connection |
| Stream Analytics Contributor | Everything Reader covers, plus Start, Stop, Scale, and Test Input or Output |
| Monitoring Reader | Get Job Metrics |
Azure treats a datasource test as an action, not a read, so Stream Analytics Reader is refused it with AuthorizationFailed. And neither Stream Analytics role reads metrics: Get Job Metrics needs Monitoring Reader as well.
A refused call names the role to grant, for example the identity may not do this in resource group "rg-telemetry" — grant it Stream Analytics Contributor … (HTTP 403 AuthorizationFailed). A role granted a moment ago can take a few minutes to reach every Resource Manager front end, so the same call may pass and fail alternately until it has.
Testing the Connection
Test Connection gets a token and reads the first page of the resource group's jobs. It proves the credentials, the role, and that the subscription and resource group exist. A resource group with no jobs is still a successful test.
Function Builder
Creating Stream Analytics Functions
Open a saved connection, go to the Functions tab, and click New Function. The picker shows all seven operations:
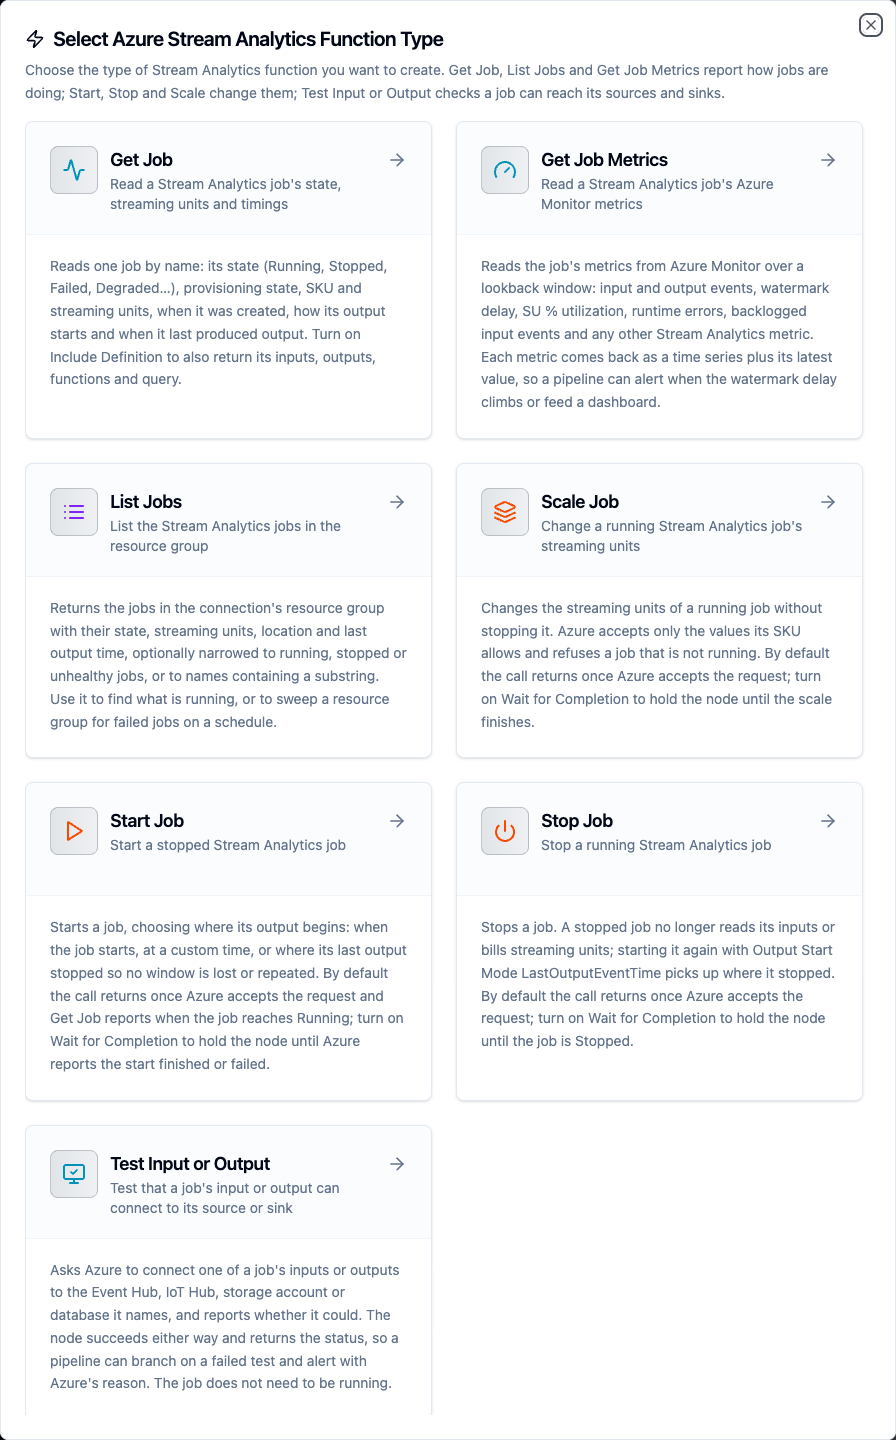
Choosing a Stream Analytics function type
Every function has a Timeout that bounds the whole operation. Job, input and output names are 3–63 letters, digits, hyphens and underscores; a literal name that breaks the rule is refused at save, and a templated one once it resolves.
Get Job Function
Reads one job by name.
| Field | Required | Description |
|---|---|---|
| Job Name | Yes | The job in the connection's resource group. Templatable |
| Include Definition | No | Also return the job's inputs, outputs, functions and query text |
| Timeout | No | Default 30m |
Result:
{
  "job": {
    "name": "telemetry-aggregation",
    "id": "/subscriptions/…/resourceGroups/rg-telemetry/providers/Microsoft.StreamAnalytics/streamingjobs/telemetry-aggregation",
    "location": "North Europe",
    "jobId": "b450f4d5-b333-4f4d-accc-95e5510c18c0",
    "jobState": "Running",
    "provisioningState": "Succeeded",
    "jobType": "Cloud",
    "sku": "StandardV2",
    "streamingUnits": 7,
    "createdDate": "2026-09-29T13:15:18.453Z",
    "lastOutputEventTime": "2026-09-29T15:21:30Z",
    "outputStartMode": "LastOutputEventTime",
    "outputStartTime": "2026-09-29T15:18:00Z",
    "compatibilityLevel": "1.2",
    "eventsOutOfOrderPolicy": "Adjust",
    "outputErrorPolicy": "Stop",
    "tags": {"env": "prod"}
  }
}
jobState is one of Created, Starting, Running, Stopping, Stopped, Degraded, Restarting, Scaling, Failed and Deleting. lastOutputEventTime, outputStartMode and outputStartTime are null on a job that has never run.
With Include Definition on, the job also carries:
{
  "inputs": [{"name": "telemetry-in", "type": "Stream", "datasourceType": "Microsoft.ServiceBus/EventHub"}],
  "outputs": [{"name": "archive-out", "datasourceType": "Microsoft.Storage/Blob"}],
  "functions": [],
  "query": "SELECT deviceId, AVG(temperature) AS avgTemp …"
}
List Jobs Function
Returns the jobs in the connection's resource group.
| Field | Required | Description |
|---|---|---|
| State Filter | No | ALL (default), RUNNING, STOPPED (Created or Stopped) or UNHEALTHY (Failed or Degraded). Jobs that are starting, stopping or scaling appear only under ALL |
| Name Filter | No | Case-insensitive substring of the job name. Templatable |
| Max Items | No | Maximum jobs to return (1–1000, default 100) |
| Timeout | No | Default 30m |
Result:
{
  "jobs": [
    {"name": "anomaly-detection", "jobState": "Failed", "streamingUnits": 3, "sku": "StandardV2", "…": "…"}
  ],
  "count": 1,
  "truncated": false
}
Each entry has the fields of Get Job without a definition. jobs is always a list, empty rather than absent. truncated is true when more jobs matched than Max Items allowed.
Resource Manager has no server-side filter or limit for this list. The connector reads the pages and stops once Max Items jobs have matched.
Start Job Function
Starts a stopped job.
| Field | Required | Description |
|---|---|---|
| Job Name | Yes | Templatable |
| Output Start Mode | No | JobStartTime (default), CustomTime, or LastOutputEventTime |
| Output Start Time | When CustomTime | RFC 3339 timestamp output starts from. Templatable |
| Wait for Completion | No | Hold the node until Azure reports the start finished or failed |
| Timeout | No | Default 30m, up to 1h |
Result:
{
  "jobName": "telemetry-aggregation",
  "outputStartMode": "LastOutputEventTime",
  "outputStartTime": "",
  "waited": true,
  "jobState": "Running"
}
outputStartTime is the time asked for in CustomTime mode, in UTC, and "" in the other modes. jobState is the job's state after the wait, and "" when the node did not wait.
- LastOutputEventTime continues from where the job's output stopped, so no window is lost or repeated after a stop. Azure refuses it for a job that has never produced output.
- Starting a job that is already running succeeds and changes nothing.
- A start takes one to three minutes. Without Wait for Completion the node returns as soon as Azure accepts the request; Get Job reports when the job reaches
Running.
Azure starts a job only if every input can connect — including inputs the query never reads. One input with an expired key fails the whole start, and the job goes to Failed. With Wait for Completion the node fails with Azure's reason, for example Azure could not start job telemetry-aggregation (BadRequest): Stream Analytics job has validation errors: … InvalidSignature …. Run Test Input or Output first to find the input at fault.
Stop Job Function
Stops a running job. A stopped job reads no input and bills no streaming units.
| Field | Required | Description |
|---|---|---|
| Job Name | Yes | Templatable |
| Wait for Completion | No | Hold the node until the job is Stopped |
| Timeout | No | Default 30m, up to 1h |
Result: {"jobName": "…", "waited": true, "jobState": "Stopped"}
Azure refuses to stop a job that is not running or on its way there (Created, Stopped, Failed) with 409 Conflict, naming the states it accepts.
Scale Job Function
Changes a running job's streaming units without stopping it.
| Field | Required | Description |
|---|---|---|
| Job Name | Yes | Templatable |
| Streaming Units | Yes | The new count, as the API spells it. Templatable |
| Wait for Completion | No | Hold the node until the scale finishes |
| Timeout | No | Default 30m, up to 1h |
Result: {"jobName": "…", "streamingUnits": 7, "waited": true, "jobState": "Running"}
A StandardV2 (SU V2) job accepts 3, 7 and 10 — ⅓, ⅔ and 1 SU V2 — and then multiples of 10 up to 660. Azure refuses any other value, and refuses to scale a job that is not running (409 Conflict). A scale took three minutes on a test job, so leave the Timeout at 5m or more when waiting.
Test Input or Output Function
Asks Azure to connect one of a job's inputs or outputs to its source or sink.
| Field | Required | Description |
|---|---|---|
| Job Name | Yes | The job that owns the input or output. Templatable |
| Kind | Yes | input or output |
| Input or Output Name | Yes | The name the job's query uses. Templatable |
| Timeout | No | Default 30m |
Result:
{
  "jobName": "anomaly-detection",
  "kind": "input",
  "name": "telemetry-in",
  "status": "TestFailed",
  "succeeded": false,
  "error": {
    "code": "BadArgument",
    "message": "Querying EventHub … returned an error: … InvalidSignature: The token has an invalid signature."
  }
}
The node succeeds whether or not the test passes and returns the status, so a pipeline can branch on succeeded and alert with Azure's reason. A passing test has status: "TestSucceeded" and an empty error code and message. The job does not need to be running. Azure asks the caller to poll no faster than every 10 seconds, so a test takes 10–20 seconds.
Get Job Metrics Function
Reads the job's Azure Monitor metrics over a lookback window.
| Field | Required | Description |
|---|---|---|
| Job Name | Yes | Templatable |
| Metrics | No | Up to 20 metric names. Default: InputEvents, OutputEvents, OutputWatermarkDelaySeconds, ResourceUtilization, Errors |
| Lookback | No | How far back from now the series starts (1m–30 days, default 1h) |
| Interval | No | Width of each point: PT1M, PT5M (default), PT15M, PT30M, PT1H, PT6H, PT12H, P1D |
| Aggregation | No | Auto (default), Total, Average, Maximum, Minimum, Count |
| Timeout | No | Default 30m |
Result:
{
  "jobName": "telemetry-aggregation",
  "timespan": "2026-09-29T14:09:55Z/2026-09-29T15:09:55Z",
  "interval": "PT5M",
  "metrics": [
    {
      "name": "OutputWatermarkDelaySeconds",
      "unit": "Seconds",
      "aggregation": "Maximum",
      "latest": {"timestamp": "2026-09-29T15:04:00Z", "value": 12},
      "points": [
        {"timestamp": "2026-09-29T14:59:00Z", "value": null},
        {"timestamp": "2026-09-29T15:04:00Z", "value": 12}
      ]
    }
  ]
}
latest is the last point that has a value, or null when none does. A point's value is null for an interval in which the job recorded nothing — a stopped job's series is all null.
Auto uses each metric's primary aggregation: Total for event and error counts, Maximum for OutputWatermarkDelaySeconds, ResourceUtilization and ProcessCPUUsagePercentage, and Average for anything else. A Total of a percentage is meaningless, which is why Auto exists.
Useful metrics: InputEvents, OutputEvents, OutputWatermarkDelaySeconds (how far output lags input — the main health signal), ResourceUtilization (SU % utilization), Errors, InputEventsSourcesBacklogged, LateInputEvents, EarlyInputEvents, DroppedOrAdjustedEvents, ConversionErrors, DeserializationError, InputEventBytes, ProcessCPUUsagePercentage. An unknown name fails the node with Azure's message, which lists every valid name.
Using Parameters
Any field marked templatable accepts ((parameterName)). Parameters are detected as you type and listed in the Function Parameters card:
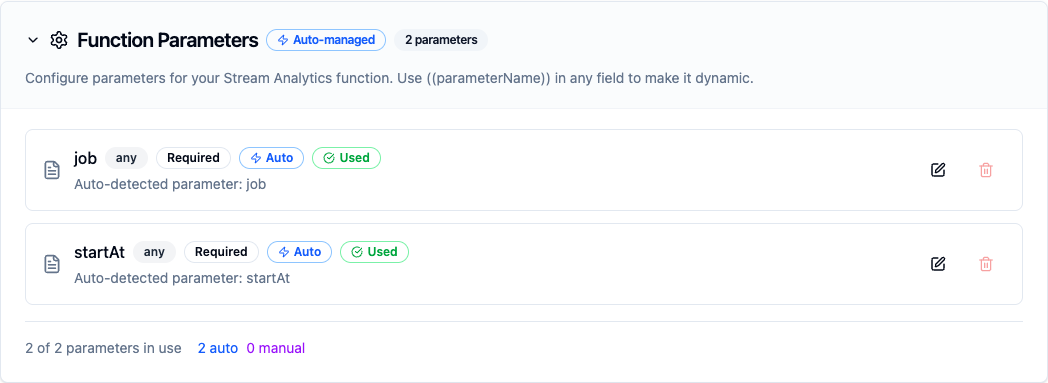
Parameters detected from ((job)) and ((startAt)) on a Start Job function
A pipeline supplies the values at execution time, so one Start Job function can start whichever job a trigger names, and one Scale Job function can take its streaming units from an upstream node.
Pipeline Integration
Each function becomes a node in the pipeline editor under Databases. See the Azure Stream Analytics node reference for node-level configuration.
In a pipeline, a node with no Timeout of its own is cut off after 30 seconds, whatever the function's Timeout says. A waited start takes one to three minutes, so on a Start, Stop or Scale node with Wait for Completion on, set the node's Timeout (Settings) at least as long as the function's. When the node times out, Azure still finishes the change — read Get Job to see where it got to.
Common Use Cases
Alert on an unhealthy job
A Schedule trigger runs List Jobs with State Filter UNHEALTHY every five minutes; a Condition on count > 0 posts the job names to Microsoft Teams.
Scale with the load
Get Job Metrics reads ResourceUtilization; when the latest value stays above 80 %, Scale Job raises the streaming units to the next value the SKU allows.
Safe restart after maintenance
Test Input or Output on each input, then Start Job with LastOutputEventTime and Wait for Completion — so the job resumes where it stopped, and a broken input is found before the start fails.
Watch the watermark
Get Job Metrics with OutputWatermarkDelaySeconds and Aggregation Maximum feeds a dashboard; a Condition alerts when the latest value passes 60 seconds.
Troubleshooting
| Symptom | Cause | Fix |
|---|---|---|
the identity may not do this in resource group … (HTTP 403) | The identity lacks the role | Grant the role the table above names, on the resource group; allow a few minutes for it to apply |
resource group "…" does not exist in subscription … | Wrong resource group or subscription | Check both on the connection |
not found in resource group "…" (HTTP 404 ResourceNotFound) | No job, input or output by that name | Use List Jobs, or Get Job with Include Definition, to see the names |
Azure could not start job … Stream Analytics job has validation errors | An input cannot connect | Test each input; fix the key or the input's permission |
LastOutputEventTime must be available … (HTTP 422) | The job has never produced output | Start with JobStartTime or CustomTime |
The Stream Analytics job is in a 'Created' state … (HTTP 409) | Stop on a job that is not running | Nothing to stop |
… not in the acceptable set: '3','7','10','20', and multiples of 10 … | A streaming unit count the SKU does not allow | Use 3, 7, 10 or a multiple of 10 |
Azure accepted the start of job … but had not finished it when the Timeout ran out | The wait outlived the Timeout | Raise the function's Timeout, and in a pipeline the node's Timeout too; Azure finishes the change either way |
Failed to find metric configuration … Valid metrics: … | A metric name Stream Analytics does not publish | Use a name from the list in the message |