From Industrial Protocols to Production Intelligence
in 15 Minutes
See what your factory has been hiding from you.
Install MaestroHub, connect to a simulated factory, and build your first data pipeline.
The Journey
8 steps
From a cold install to a live production dashboard.
Install MaestroHub
One binary or one Docker command. No external DB, no broker.
Create Admin Account
First-launch account creation. You are signed in automatically.
Connect Data Sources
Modbus, OPC UA, REST — manual, AI, or one-click import.
Organize Your UNS
ISA-95 topic tree, schemas, Data Explorer.
Build a Pipeline
Trigger → Read → Transform → Publish. Drag-and-drop or one MCP prompt.
Build a Live Dashboard
4 real-time panels wired to your UNS topic.
Monitor & Operate
System health, execution history, failure drills.
What to Explore Next
Go deeper into Data Integration, UNS, and the simulator.
Install MaestroHub
MaestroHub runs as a single binary or Docker container. No external databases, no message brokers — everything is embedded.
- Binary (Recommended)
- Docker
- Docker Compose
Download from the MaestroHub Portal and run:
- Windows
- macOS
- Linux (AMD64)
- Linux (ARM64)
- Download the ZIP file and extract it
After extraction, you'll see the following structure:
maestrohub-lite/
├── README.txt
├── ThirdPartyNotices.txt
├── starter.bat
├── maestrohub-lite.exe
├── admin-cli.exe
└── config.yaml
- Double-click
starter.bat(or runmaestrohub-lite.exedirectly)
tar -xzf maestrohub-lite_*_darwin_arm64.tar.gz
cd maestrohub-lite
./maestrohub-lite
After extraction, you'll see the following structure:
maestrohub-lite/
├── README.txt
├── ThirdPartyNotices.txt
├── starter.bat
├── maestrohub-lite.exe
├── admin-cli.exe
└── config.yaml
If macOS blocks the app with a message that it "cannot be opened because it is from an unidentified developer," you need to allow it in your security settings:
- Go to System Settings (or System Preferences on older macOS) > Privacy & Security
- Scroll down to the Security section
- You'll see a message that MaestroHub Lite was blocked
- Click Open Anyway and confirm
For more information, see Apple's guide on opening apps from unidentified developers.
tar -xzf maestrohub-lite_*_linux_amd64.tar.gz
cd maestrohub-lite_*_linux_amd64
./maestrohub-lite
After extraction, you'll see the following structure:
maestrohub-lite/
├── README.txt
├── ThirdPartyNotices.txt
├── starter.bat
├── maestrohub-lite.exe
├── admin-cli.exe
└── config.yaml
tar -xzf maestrohub-lite_*_linux_arm64.tar.gz
cd maestrohub-lite_*_linux_arm64
./maestrohub-lite
After extraction, you'll see the following structure:
maestrohub-lite/
├── README.txt
├── ThirdPartyNotices.txt
├── starter.bat
├── maestrohub-lite.exe
├── admin-cli.exe
└── config.yaml
For Raspberry Pi 4/5, AWS Graviton, Ampere, or Apple Silicon running Linux.
The browser opens automatically at http://localhost:6163.
Download the Docker image for your architecture from the MaestroHub Portal.
- AMD64 (Intel/AMD)
- ARM64 (Apple Silicon)
# Extract the zip
unzip maestrohub-lite_2.6.0_docker_amd64.zip

# Load the image
docker load -i maestrohub-lite-amd/maestrohub-lite-amd64.tar.gz

# Create persistent volume
docker volume create maestrohub-data

# Run
docker run -d \
  --name maestrohub \
  -p 8080:8080 \
  -p 1883:1883 \
  -p 8083:8083 \
  -v maestrohub-data:/data \
  maestrohub/lite:2.6.0
# Extract the zip
unzip maestrohub-lite_2.6.0_docker_arm64.zip

# Load the image
docker load -i maestrohub-lite-arm/maestrohub-lite-arm64.tar.gz

# Create persistent volume
docker volume create maestrohub-data

# Run
docker run -d \
  --name maestrohub \
  -p 8080:8080 \
  -p 1883:1883 \
  -p 8083:8083 \
  -v maestrohub-data:/data \
  maestrohub/lite:2.6.0
Open http://localhost:8080 in your browser.
All commands above are written for Bash. Choose your preferred shell:
- Git Bash (Git for Windows) — run commands as-is
 PowerShell — replace
 \with`(backtick) and$(pwd)with${PWD}
Or use the Docker Compose tab for a shell-agnostic alternative.
| Port | Description |
|---|---|
| 8080 | Web UI + REST API |
| 1883 | MQTT broker |
| 8083 | MQTT over WebSocket |
First, load the image (if not already loaded):
# AMD64 (Intel/AMD)
unzip maestrohub-lite_2.6.0_docker_amd64.zip
docker load -i maestrohub-lite-amd/maestrohub-lite-amd64.tar.gz

# Or ARM64 (Apple Silicon)
unzip maestrohub-lite_2.6.0_docker_arm64.zip
docker load -i maestrohub-lite-arm/maestrohub-lite-arm64.tar.gz
Save the following as docker-compose.yml:
services:
  maestrohub:
    image: maestrohub/lite:2.6.0
    container_name: maestrohub
    restart: unless-stopped
    ports:
      - "8080:8080"   # Web UI + REST API
      - "1883:1883"   # MQTT broker
      - "8083:8083"   # MQTT over WebSocket
    volumes:
      - maestrohub-data:/data
    # environment:
    #   - TZ=Europe/Istanbul

volumes:
  maestrohub-data:
Then run:
docker-compose up -d
Open http://localhost:8080 in your browser.
Works identically on Bash, PowerShell, and Cmd — no shell syntax differences.
| Port | Description |
|---|---|
| 8080 | Web UI + REST API |
| 1883 | MQTT broker |
| 8083 | MQTT over WebSocket |
Create Your Admin Account
On first launch, you will see the account creation screen. Enter your name, email, and password.
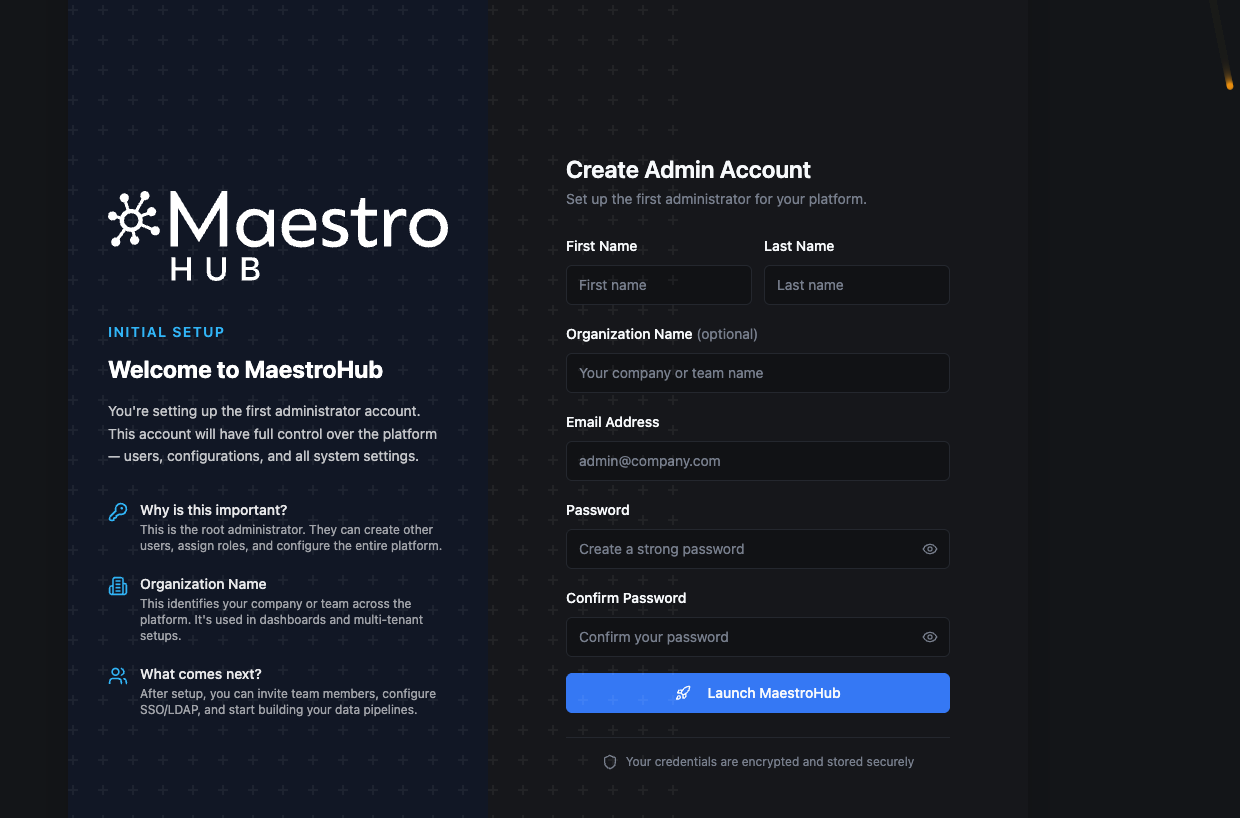
Create your initial administrator account to get started with MaestroHub.
After creating your account, you are signed in automatically and taken to the Overview page.
Connect Your First Data Source
Navigate to Connect in the sidebar. Click Add Connection and choose a protocol.
No real factory? Use our Digital Factory Simulator — a realistic 4-station production line with OPC UA and Modbus data. It comes with ready-to-import dashboards, connections, and pipelines — no manual setup required. Set it up in 3 minutes →
The connection endpoints, register addresses, topics, and example payloads in the rest of this guide come straight from the Digital Factory Simulator. If you skip it, you can still follow the steps with your own PLC/server — just substitute your host, port, and register map for ours.
What the simulator exposes. 4 stations running real industrial protocols — the same ones a real brake caliper production cell would use:
| Protocol | Endpoint | Station / Service |
|---|---|---|
| Modbus TCP | localhost:15020 | OP10 — CNC Rough Machining |
| Modbus TCP | localhost:15021 | OP30 — Parts Washer |
| OPC UA | opc.tcp://localhost:14840 | OP20 — CNC Finish Machining |
| OPC UA | opc.tcp://localhost:14841 | OP40 — Leak Test |
| REST API | http://localhost:18080/api/v1 | MES — Production Data |
| REST API | http://localhost:18081/api/v1 | ERP — Work Orders & Inventory |
| MQTT | mqtt://localhost:11883 | Event Broker |
| PostgreSQL | postgres://localhost:15432 | Database |
Switch between world_class (85%+ OEE), typical (65–75%), and struggling (45–55%) via the DFS dashboard dropdown. Great for testing different scenarios later.
For the rest of this guide we'll use the OP10 CNC Rough Machining station — a Modbus TCP device. Modbus is a deliberately harder example than OPC UA: it has no discovery, so register addresses come from the vendor's documentation. That's exactly the real-world case for most PLCs.
- Manual — Drag & Drop
- AI-Assisted — MCP
- Import & Export (Recommended)
1. Create the connection
In MaestroHub, click Connect in the sidebar, then Add Connection → Modbus TCP. Copy these values (from the Digital Factory Simulator docs):
| Field | Value |
|---|---|
| Name | Caliperline-OP10-CNC |
| Host | localhost |
| Port | 15020 |
| Unit ID | 1 |
| Timeout | 5000 ms |
Click Test Connection — green checkmark — then Save.
2. Add two read functions
Back on the connection, open the Functions tab and add two Read Holding Registers functions. MaestroHub's register address field is 0-based (0–65535), so 40001 becomes address 0 and 40010 becomes address 9:
| Name | Register Address | Data Type | Quantity | Description |
|---|---|---|---|---|
State | 0 | Raw (uint16) | 1 | Station status (0=OFF, 1=IDLE, 2=RUNNING, 3=FAULTED…) |
SpindleSpeed | 9 | Raw (uint16) | 1 | Spindle RPM |
Set up the MCP Server connection first. See the MCP Integration guide for step-by-step instructions for Claude, Cursor, VS Code, and more.
MaestroHub exposes an MCP server, so any MCP-aware assistant — Claude, Cursor, VS Code Copilot — can create connections and functions on your behalf. Send this prompt:
"Connect me to OP10 on localhost:15020 (Modbus TCP).
- Name: Caliperline-OP10-CNC
- Unit ID: 1
- Timeout: 5000 ms

Pull two holding registers (Quantity 1, Data Type Raw / uint16).
Use the literal register numbers as the Register Address — do NOT
apply the Modbus 4xxxx → 0-indexed conversion. Keep 40001 as 40001
and 40010 as 40010 when calling the MCP tool.

Create them as two functions with these exact names:
- Function name: State          → register 40001 (station status: running, idle, faulted…)
- Function name: SpindleSpeed   → register 40010 (RPM)

Just those two, so I can see the machine is alive."
The AI reads MaestroHub's MCP schema, creates the connection, defines both functions, tests them, and reports back — same result as the manual tab, a fraction of the typing.
Don't type it — import it. MaestroHub's import/export format is open, and any source system that speaks it can hand you a ready-made setup. The Digital Factory Simulator does exactly that — it has its own Export button that generates a full MaestroHub manifest for all four stations. You don't write it, you download it.
The flow is literally two clicks per side:
- In the Digital Factory Simulator admin UI, click Export and save the file.
- In MaestroHub → Connect → Import, pick the file.
MaestroHub validates the manifest, tests every connection, and reports anything that fails before it commits. Good entries land, bad ones show up on a report so you can fix them.
Hundreds of functions, several pipelines, UNS dashboards, all four stations — in one upload.
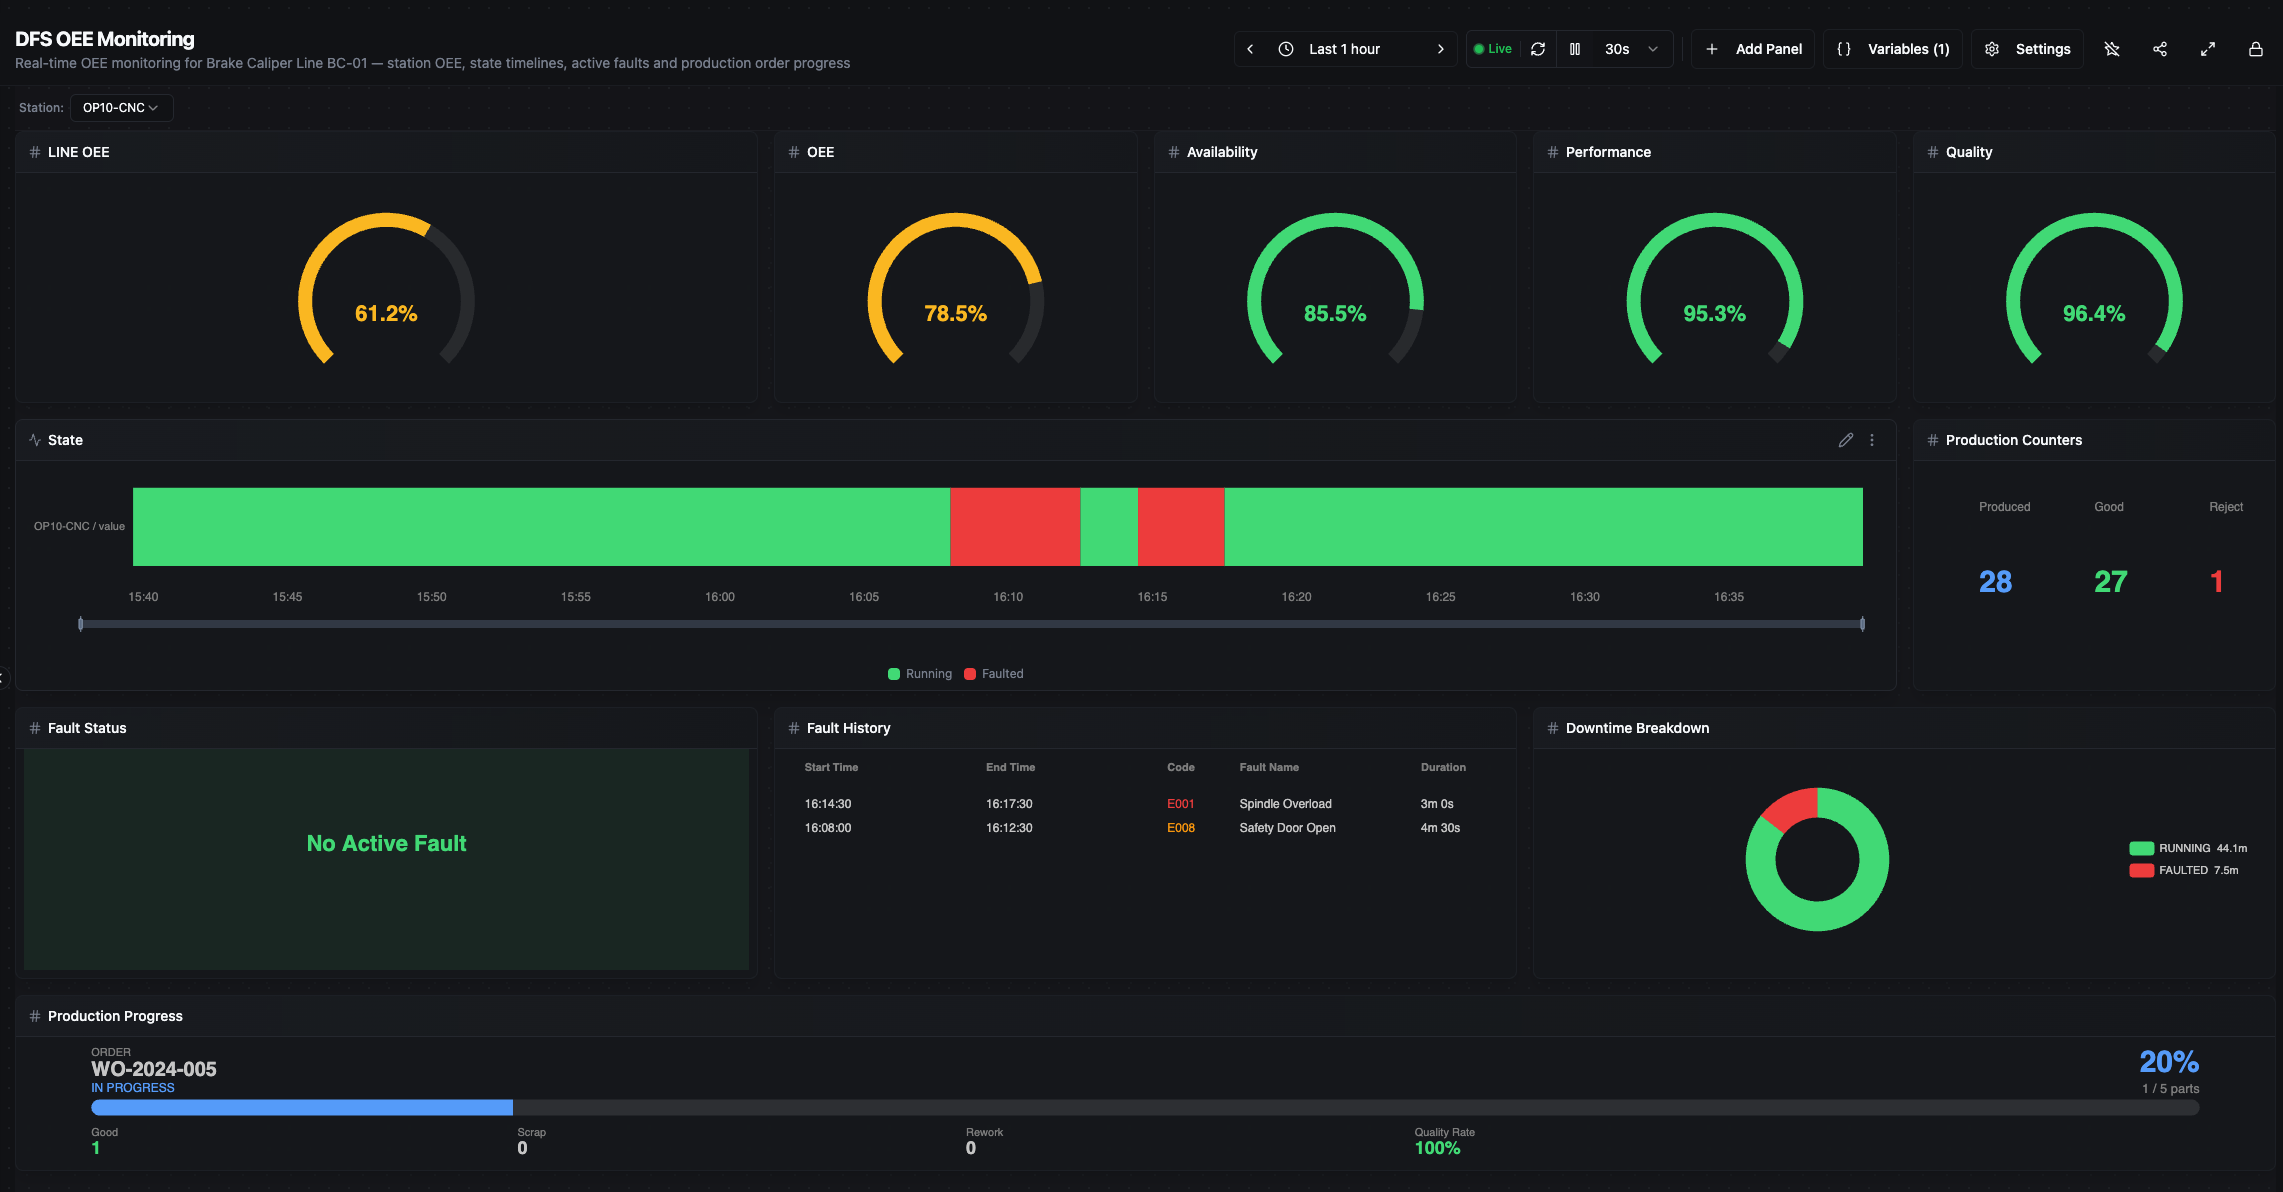
Example of what you get after importing: a full OEE Monitoring Dashboard — no manual setup needed.
The same door works both ways. Any setup you build inside MaestroHub can be exported the same way — connections, functions, pipelines, dashboards, schemas, all in one file. Click Export on the Connect page and you get the whole thing. Use it to:
- Back up a working configuration before making changes
- Migrate from a staging instance to production
- Share a reproducible setup with your team or across sites
- Version control — check the file into Git alongside your pipeline definitions
Import/export also covers pipelines, UNS schemas, and dashboards — not just connections. The same file can carry an entire working setup between instances.
Organize Data in Your Unified Namespace
The Unified Namespace (UNS) organizes all your factory data into a hierarchical topic tree. Instead of point-to-point connections between systems, every data source publishes to the UNS, and every consumer reads from it. It follows the ISA-95 model:
enterprise/
  site/
    area/
      line/
        station/
          metric   (optional — see below)
Two common patterns, both valid:
- One metric per topic — e.g.
acme/berlin/machining/line1/op10/spindle_speed. Each metric is its own topic; fine-grained subscriptions, more topics to manage. - Station-level payload — e.g.
acme/berlin/machining/line1/op10carrying a JSON object withspindle_speed,state,state_label, etc. Fewer topics, atomic per-cycle snapshots. The pipeline you'll build next uses this pattern.
Browse live data. Click UNS → Data Explorer in the sidebar. The topic tree on the left shows every topic that has received data; select a topic to see live values on the right.
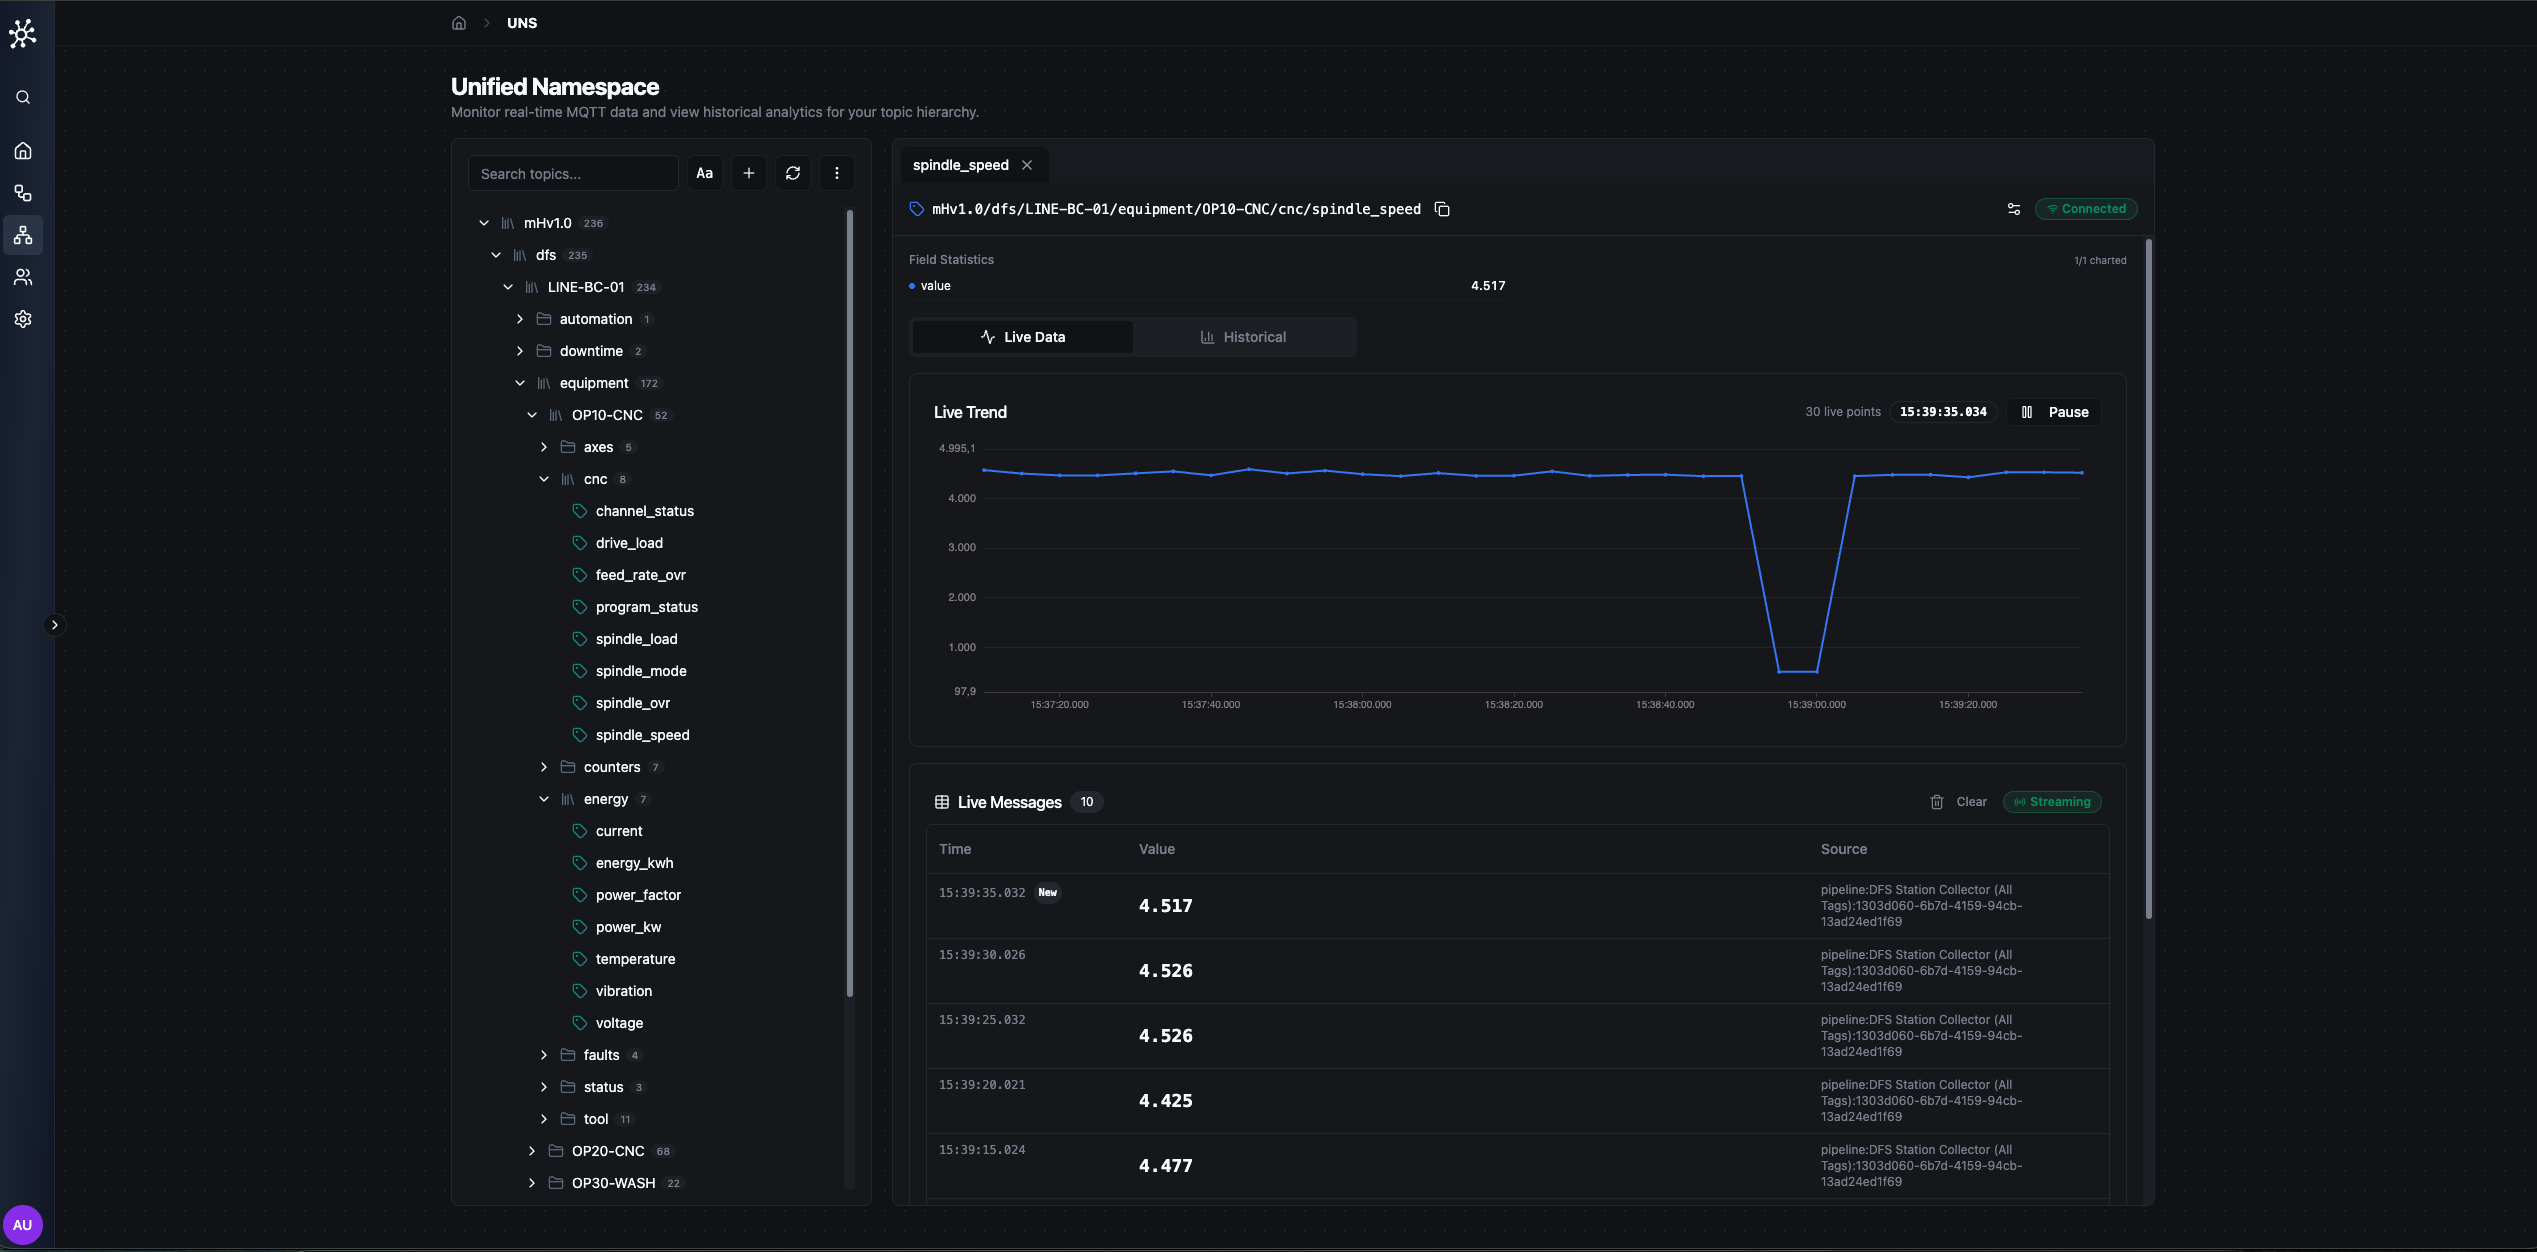
UNS Data Explorer — topic tree panel on the left, live data in the right panel.
Define a schema. Schemas define what data a topic expects — data types, units, valid ranges. Define fields like spindle_speed (float, RPM, range 0–15000) or temperature (float, °C, range 0–200). Build reusable schemas under UNS → Schemas (or start from the template library), then bind one to a topic with a Topic Binding — bound schemas are enforced on every publish, with threshold crossings raised on the Alerts page. See UNS › Schemas and UNS › Alerts.
The UNS is powered by MQTT. Any MQTT client can publish or subscribe to topics. MaestroHub adds schema validation, history, and governance on top.
Build Your First Pipeline
Pipelines are the heart of MaestroHub — they read data, transform it, and publish the result. The basic pattern:
Trigger → Read Data → Transform → Publish to UNS
Go to Orchestrate → Pipelines → Create Pipeline and name it OP10 Data Collection.
- Manual — Drag & Drop
- AI-Assisted — MCP
1. Add a Schedule Trigger. Drag a Schedule Trigger node onto the canvas and set it to run every 5 seconds. Your pipeline will collect data 12 times per minute. (Other triggers: MQTT Subscribe, Manual, Webhook, OPC UA Subscribe.)
2. Add a Modbus Read Group. Drag a Modbus Read Group node from the connector palette and connect it to the trigger. Unlike a single Read, this node batches multiple registers into one request — fewer round-trips, tighter timing.
- Select your
Caliperline-OP10-CNCconnection - Pick both functions:
State,SpindleSpeed - The node outputs a single JSON object keyed by function name
3. Add a JavaScript transform. Drag a JavaScript node and connect it to the Read Group. This is where raw register values become a clean, publish-ready payload:
// Enrich OP10 readings before publishing
var output = {};

// Pull upstream values from the Modbus Read Group node
const spindleSpeed = $node["Modbus Read Group"]?.results?.SpindleSpeed?.value;
const state        = $node["Modbus Read Group"]?.results?.State?.value;

// 1) Pass-through — keep raw values
output.spindle_speed = spindleSpeed;
output.state         = state;

// 2) Derived — normalize load, human-readable state label
output.spindle_load_pct = typeof spindleSpeed === "number"
  ? (spindleSpeed / 15000) * 100
  : null;
const stateLabels = {
  0: "OFF", 1: "IDLE", 2: "RUNNING", 3: "FAULTED",
  4: "BLOCKED", 5: "STARVED", 6: "CHANGEOVER", 7: "MAINTENANCE"
};
output.state_label = stateLabels[state] || "UNKNOWN";

// 3) Alert — cheap flag downstream can consume
output.alert_fault = state === 3;

// 4) Enrich — station id + ISO timestamp
output.station   = "OP10";
output.timestamp = new Date().toISOString();

return output;
4. Add a UNS Publish node. Drag a UNS Publish node and connect it to the JavaScript node.
- Topic:
acme/berlin/machining/line1/op10 - Value:
{{$node["JavaScript"].result}}— references the upstream JavaScript node's output
5. Run it. Click Save, then toggle the pipeline to Enabled. Watch the execution counter tick up. Go to UNS → Data Explorer — live data should appear at acme/berlin/machining/line1/op10.
Set up the MCP Server connection first. See the MCP Integration guide for step-by-step instructions for Claude, Cursor, VS Code, and more.
Instead of 5 manual steps, send this one prompt:
"Create a pipeline called 'OP10 Data Collection' that runs every 5 seconds,
reads State and SpindleSpeed from my Caliperline-OP10-CNC connection,
and publishes an enriched payload to the UNS topic
acme/berlin/machining/line1/op10 with these fields:
- spindle_speed, state  (pass-through from the Read Group)
- spindle_load_pct      (spindle_speed / 15000 * 100)
- state_label           (map state: 0=OFF, 1=IDLE, 2=RUNNING, 3=FAULTED,
                         4=BLOCKED, 5=STARVED, 6=CHANGEOVER, 7=MAINTENANCE)
- alert_fault           (true when state === 3)
- station               ('OP10')
- timestamp             (ISO 8601)

Enable the pipeline after creating it."
The AI creates the pipeline, configures every node, writes the transform logic, connects them, and enables it.
More things you can ask. MCP isn't just for pipelines:
MCP is an open protocol. Use it with Claude (Anthropic), ChatGPT (OpenAI), Cursor, or any MCP-compatible AI assistant. MaestroHub is the first industrial platform with native MCP support.
MaestroHub has nodes for OPC UA, Modbus, MQTT, HTTP, databases, email, Slack, JavaScript, Python, conditional logic, loops, and more. Browse the full catalog at Data Integration → Orchestrate → Nodes.
Build a Live Dashboard
Go to UNS → Dashboards → Create Dashboard and name it Production Overview.
- Manual — Panel Builder
- AI-Assisted — MCP
Click Add Panel and wire each one to the fields your pipeline is publishing to acme/berlin/machining/line1/op10:
- Stat — spindle load percentage (
spindle_load_pct, 0–100%) - Status Timeline — machine state (
state_label: RUNNING / FAULTED / IDLE) - Gauge — current spindle speed (
spindle_speed, 0–15,000 RPM) - Line Chart — spindle speed trend over the last hour (
spindle_speed)
Each panel connects to a UNS topic. Select your topic, choose the field, and the panel updates in real-time.
Arrange & style. Drag panels to rearrange. Resize them. Change colors and thresholds (green for RUNNING, red for FAULTED). The dashboard auto-saves.
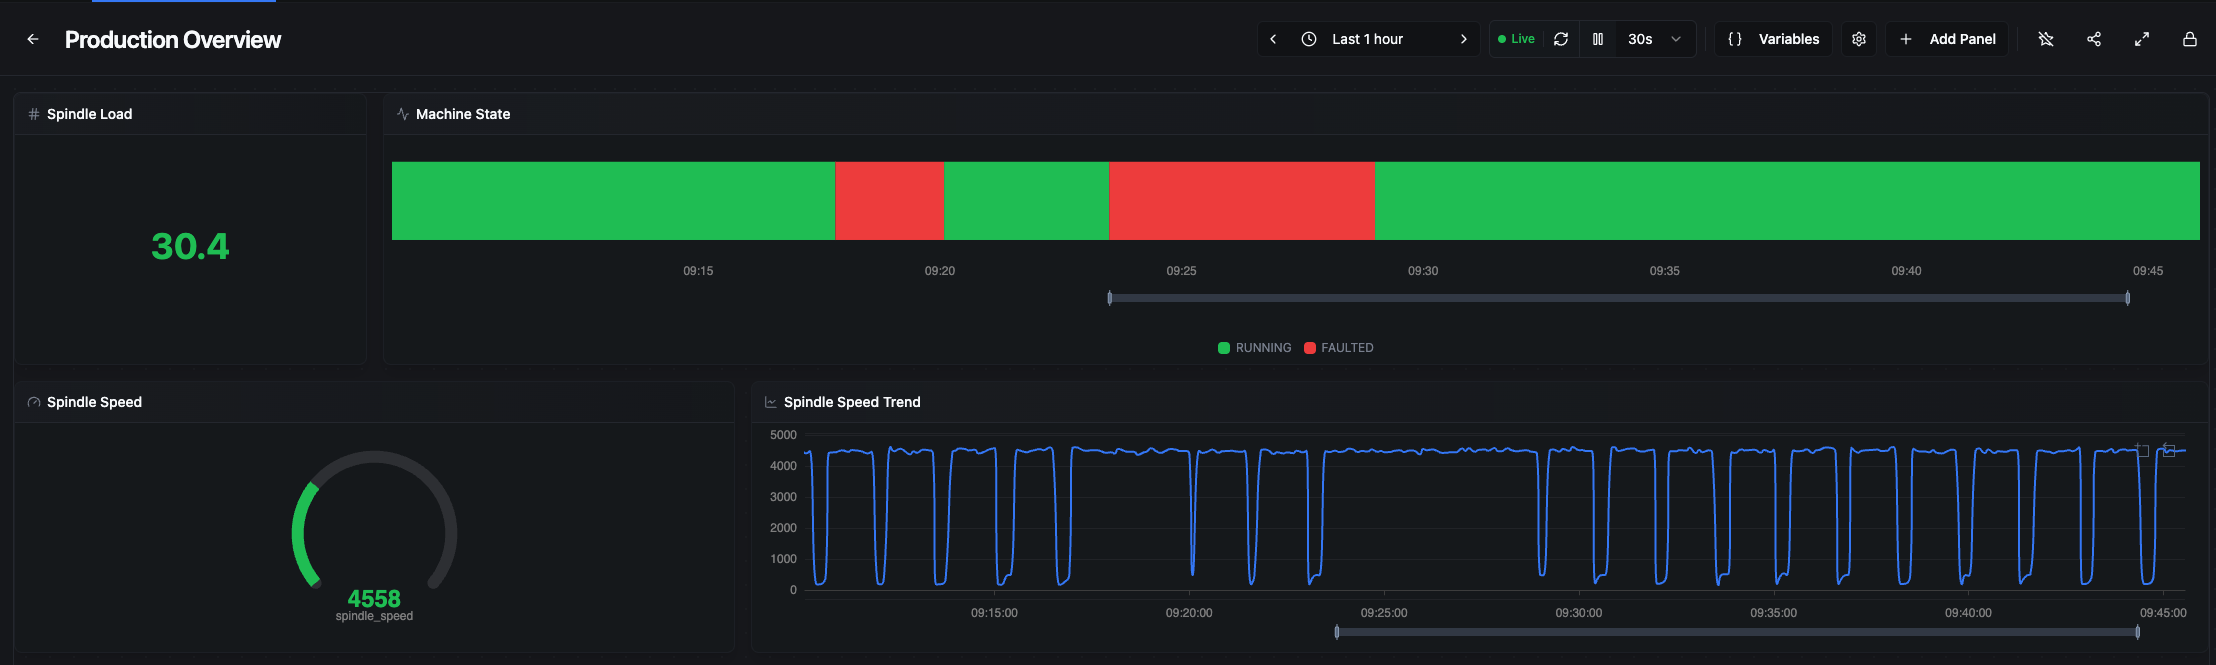
Production Overview dashboard — Spindle Load stat, Machine State timeline, Spindle Speed gauge, and trend line chart, live from OP10.
Set up the MCP Server connection first. See the MCP Integration guide for step-by-step instructions for Claude, Cursor, VS Code, and more.
Tell the AI what you want:
"Create a dashboard called 'Production Overview' wired to acme/berlin/machining/line1/op10 with:
- A stat showing spindle_load_pct (0–100%)
- A status timeline showing state_label (RUNNING / FAULTED / IDLE)
- A gauge for spindle_speed (0–15,000 RPM)
- A line chart showing spindle_speed trend over the last hour

Arrange the panels neatly —
summary tiles on top, trend chart on the bottom."
The AI creates the dashboard, adds all panels, connects them to UNS topics, and configures the layouts. Ready to view instantly.
Monitor & Operate
Keep everything running smoothly. MaestroHub monitors its own health and your pipeline executions.
System health overview. Go to Monitor in the sidebar for a single view of system health: CPU, memory, active connections, running pipelines, and recent errors.
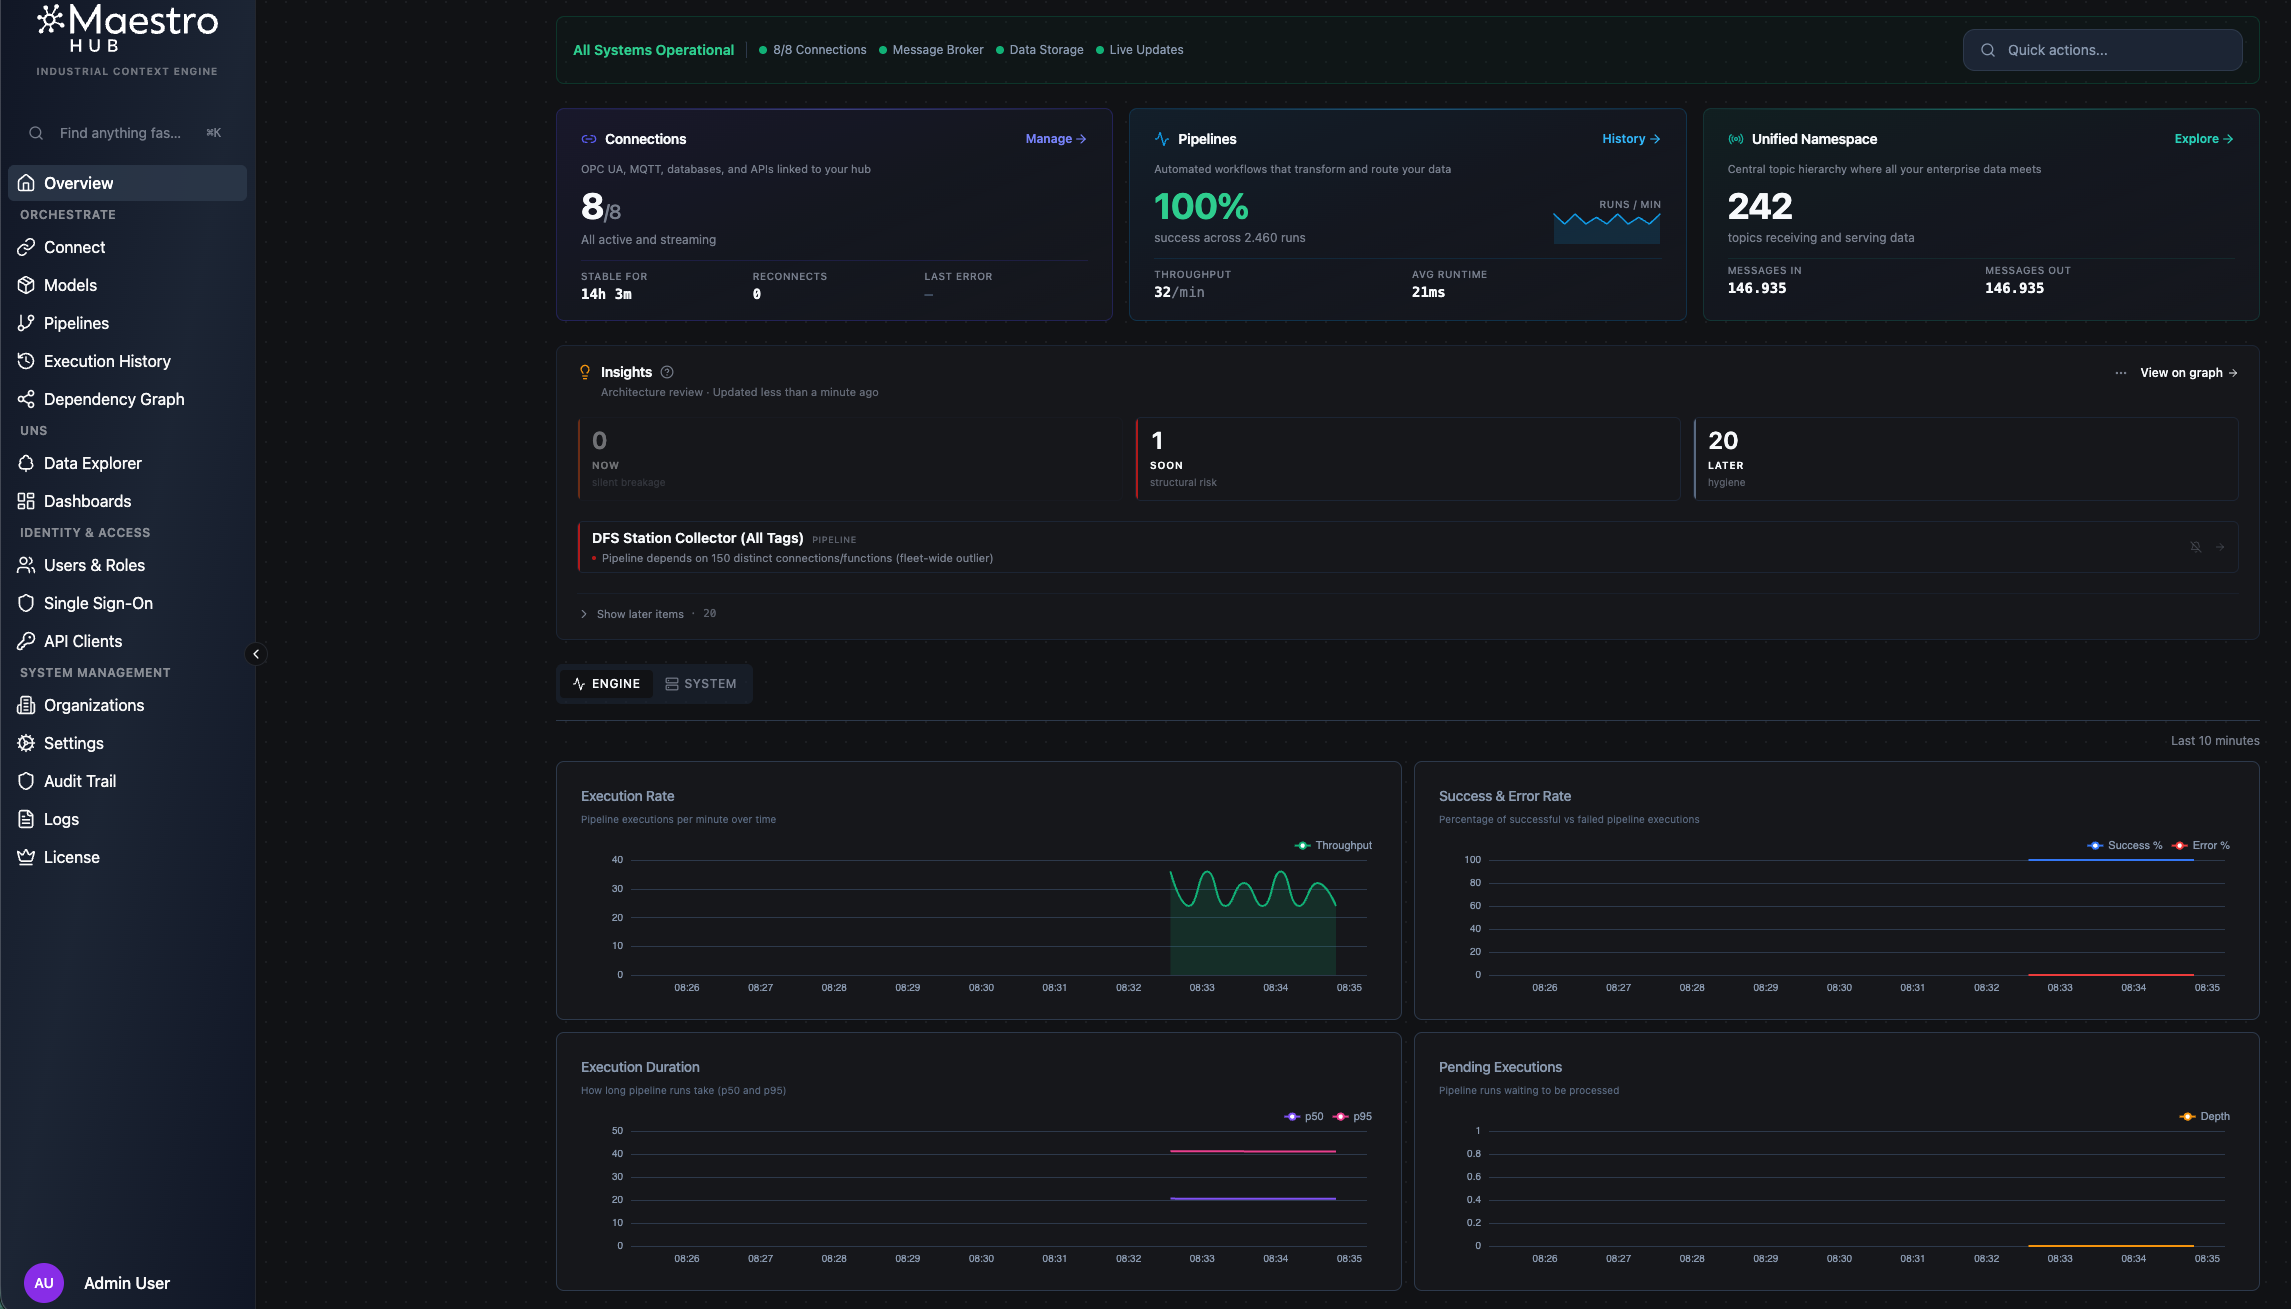
Monitor overview — system health, connection status, and pipeline execution summary at a glance.
Execution history. Every pipeline run is logged with inputs, outputs, and timing. Click on any pipeline to see its execution history — filter by status (success / failed), inspect individual runs, and drill down into node-level output when something looks off.
Change the Digital Factory Simulator to struggling mode. Watch your dashboard react — spindle load drops, the state flips to FAULTED, alert flags fire. Then switch to world_class and see it recover.
What to Explore Next
In ~15 minutes you went from a cold install to a live production dashboard — the same foundation every real MaestroHub deployment is built on. Before jumping into the deep docs, try one more quick win to cement what you just learned.
Try right now
Connect all 4 stations
Extend to the full factory. If you took the Manual or AI path, connect the remaining OP20 / OP30 / OP40 stations. If you imported from DFS, they're already wired — build a pipeline for each and watch all four come alive on one dashboard.
~15 minutesSwitch factory profiles
Change the simulator to struggling mode. Watch your dashboard react — spindle load drops, the state flips to FAULTED, alert flags fire. Then switch to world_class and see it recover in real time.
Chain a second pipeline
Take the output of your first pipeline and feed it into a second — Read UNS → Transform → Publish. This is the pattern behind every real aggregation, alerting, or ERP-sync flow.
Rebuild it with one AI prompt
Wire up MCP once, then ask your AI assistant to create a pipeline for you. Same result, zero drag-and-drop. The fastest way to feel the productivity jump.
~2 minutesTop launchpads into the rest of the docs:
Data Integration
Connect more protocols, build complex pipelines with 50+ node types, and model your data.
Learn more →Unified Namespace
Build your topic tree, define schemas, create dashboards, and enable real-time streaming.
Learn more →Digital Factory Simulator
Practice with a 4-station production line — OPC UA, Modbus, REST APIs, zero hardware.
Learn more →Reference
Configuration
Customize MaestroHub by editing config.yaml:
http:
  port: 8080
Or use environment variables with the MAESTROHUB_ prefix:
export MAESTROHUB_HTTP_PORT=8080
Restart the application after changes.
Docker lifecycle commands
# View logs
docker logs -f maestrohub        # or: docker-compose logs -f

# Stop (data preserved)
docker stop maestrohub            # or: docker-compose stop

# Start again
docker start maestrohub           # or: docker-compose start

# Health check
curl http://localhost:8080/health

# Full reset
docker stop maestrohub && docker rm maestrohub
docker volume rm maestrohub-data
Troubleshooting
- Port in use: Check
lsof -i :6163(binary) orlsof -i :8080(Docker) - macOS security block: System Settings > Privacy & Security > Open Anyway
- Clean restart: Delete
~/maestrohub/data/(binary) or remove Docker volume - Container not starting: Check
docker logs maestrohub
Encryption keys & runtime secrets
MaestroHub uses several runtime secrets — JWT signing keys, the OAuth2 client secret, and encryption keys for the Connectors and UNS databases. They are persisted under a secrets/ subfolder of your MaestroHub data directory (mode 0600):
secrets/
├── auth_jwt_access_secret
├── auth_jwt_refresh_secret
├── auth_jwt_password_reset_secret
├── oauth2_secret
├── connectors_encryption_key
└── uns_encryption_key
| Install | Where the secrets/ folder lives |
|---|---|
| Binary | ~/maestrohub/data/secrets/ (i.e. inside $HOME/maestrohub/data/, alongside the SQLite database files) |
| Docker | inside the volume you mounted at /data — full path /data/data/secrets/ from inside the container |
Once a file exists in this directory, MaestroHub uses its contents as-is — keys never silently rotate underneath the data they protect.
Bring your own keys. Two ways, in order of precedence:
-
Environment variables. Set the value before the first boot (or before you next restart). Useful for Docker / orchestrators.
Variable Purpose MAESTROHUB_MODULES_AUTH_JWT_ACCESSSECRETJWT access-token signing key MAESTROHUB_MODULES_AUTH_JWT_REFRESHSECRETJWT refresh-token signing key MAESTROHUB_MODULES_AUTH_JWT_PASSWORDRESETSECRETPassword-reset token signing key MAESTROHUB_MODULES_OAUTH2_SECRETOAuth2 client secret MAESTROHUB_MODULES_CONNECTORS_ENCRYPTIONKEYAES key for connector secrets MAESTROHUB_MODULES_UNS_ENCRYPTIONKEYAES key for UNS settings secrets -
Pre-seed the secrets file. Write your value to
data/secrets/<file>(mode0600) before first boot. The runtime sees the file and uses it as-is.
Connector and UNS encryption keys must be 16, 24, or 32 bytes (AES-128 / 192 / 256). They can be supplied as raw bytes (ASCII) or as a base64-encoded string.
Rotating an encryption key. To rotate the Connectors or UNS encryption key against existing data, use admin-cli reencrypt — it re-wraps every encrypted row under the new key and updates the secrets file atomically.