Platform Tour
A guided tour of MaestroHub's six core modules. Click any numbered pin on a screenshot to see what that UI element does, hit ⤡ Expand on any image for a fullscreen view with the same hotspots, or jump straight to a section from the table of contents on the right.
Platform Overview
The six modules at a glance — each card jumps to its own deeper reference.
Connect — Data Collection
Define a connection profile once, build reusable functions, then use them across any pipeline. TLS, authentication, and credential management are built in. Test before saving, monitor uptime and failures from the Connection Health dashboard.
Learn moreCompose — Data Modeling
Define typed schemas representing real industrial assets — machines, lines, batches, sensors. Every model change is version-tracked with full rollback. Start from a curated library of industry-standard templates instead of from scratch.
Learn moreUnified Namespace — Single Source of Truth
Topics follow the ISA-95 model: Enterprise → Site → Area → Line → Cell → Equipment. MaestroHub adds schema validation, time-series storage, live MQTT streaming, real-time dashboards, and configurable data distribution on top.
Learn moreObserve — Monitoring and Alerting
System-wide visibility across connections, pipelines, and infrastructure. Every state transition is logged. Every pipeline run is traceable. Metrics are exportable to any observability stack.
Learn moreOrchestrate — Pipeline Automation
Visual drag-and-drop pipeline builder with 61+ nodes. Every pipeline is version-controlled — every save creates a snapshot with full rollback. A Dependency Graph shows inter-pipeline relationships and detects circular dependencies.
Learn moreSystem Management — Administer & Maintain
Platform-wide administration in one place. Wire up SMTP for alert delivery, manage the search index for fast entity lookup, schedule maintenance windows for safe downtime, and use bulk import/export to back up state or promote configuration between environments.
Learn moreCreate Connection
How to wire MaestroHub to an external system. This walkthrough uses OPC UA — the same Connection / Security / Advanced / Functions flow works for all 32 connectors.
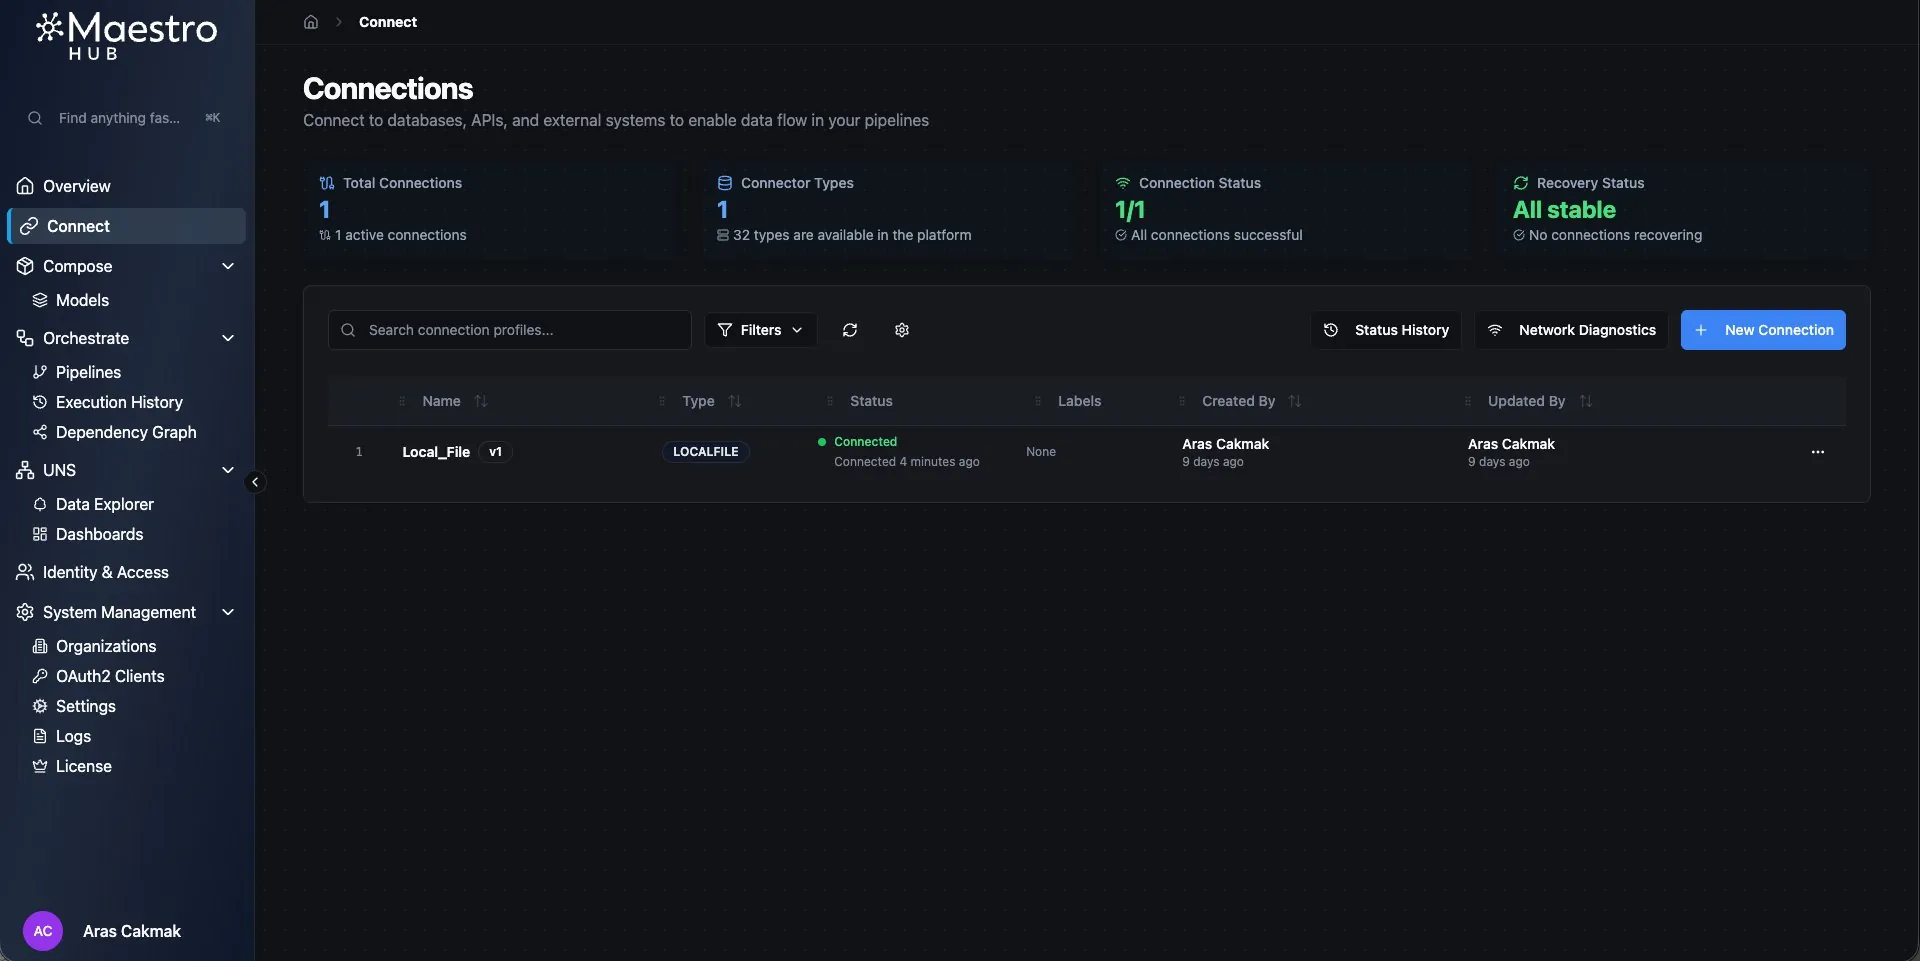
Connection Dashboard
Central registry for all external data connections — live status, metrics, and one-click access to create, monitor, and troubleshoot every integration.
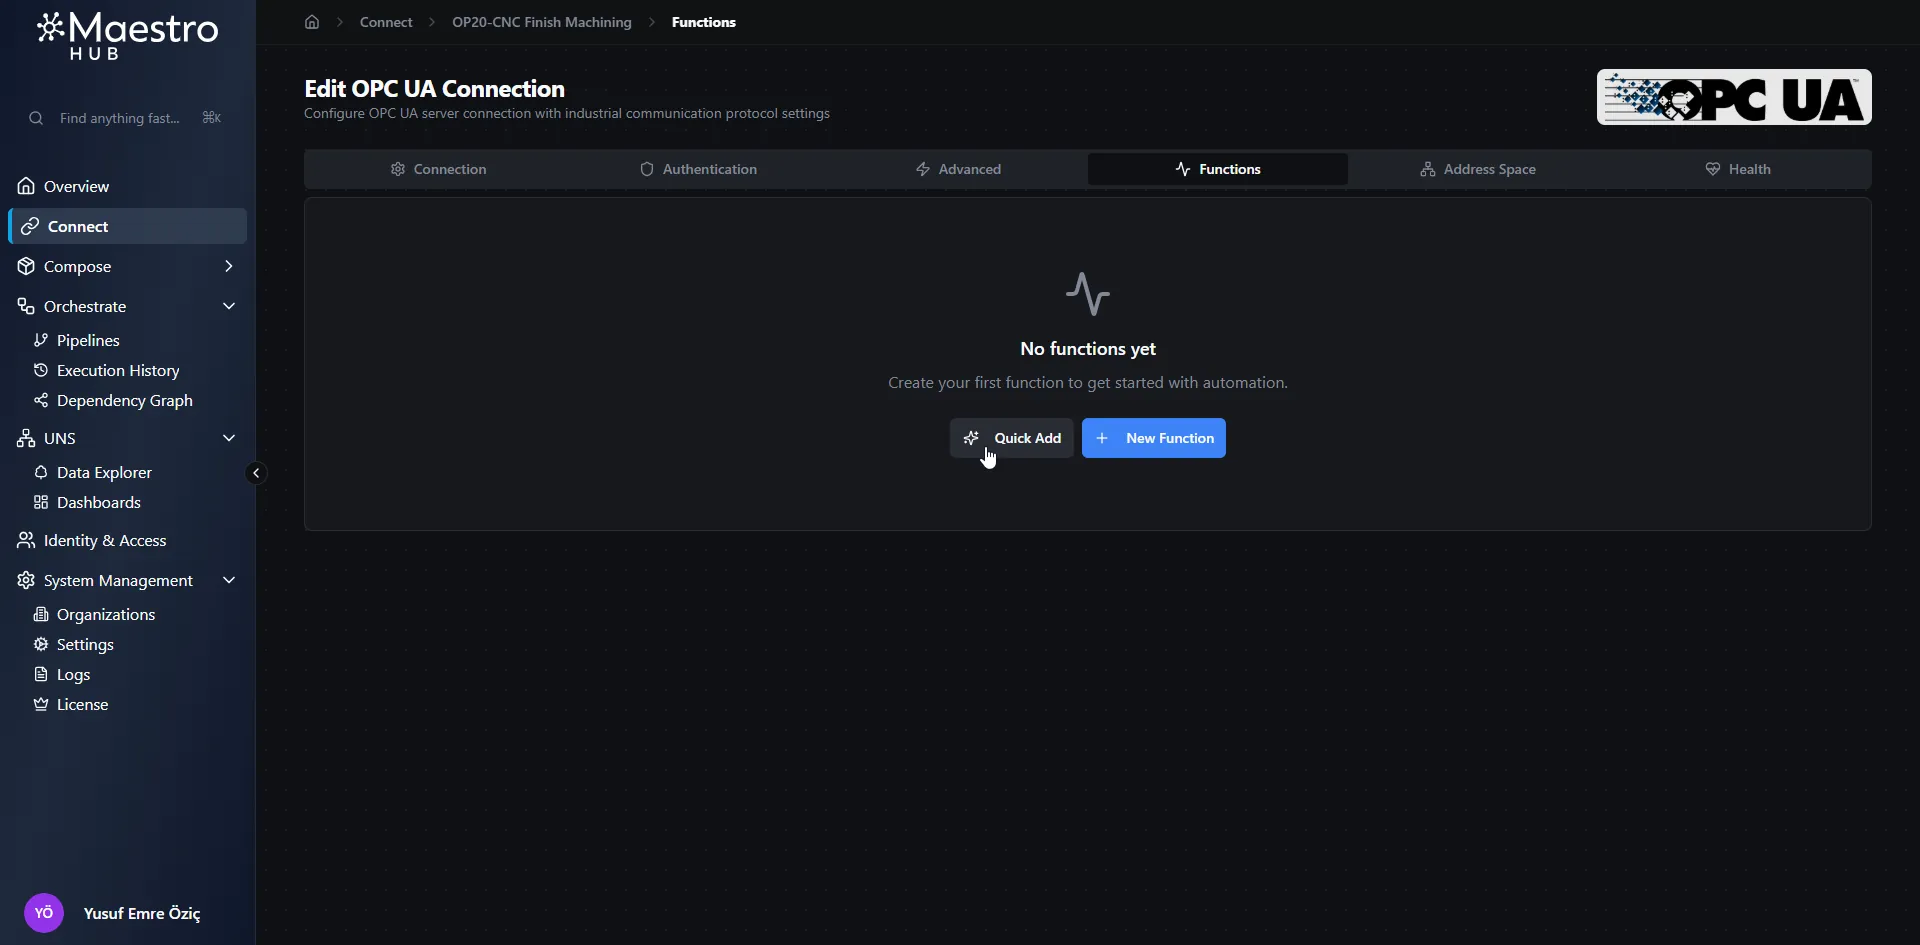
Quick Add Feature
Bulk-define connector functions in seconds — pick the source, select the tags or items, and MaestroHub creates them all at once.
Open Quick Add
Start the bulk creation flow from the Functions screen. This is the point where the batch entry dialog is opened from the UI.
Pipeline Settings
Every pipeline starts here: name, description, execution mode (parallel or sequential), and priority.
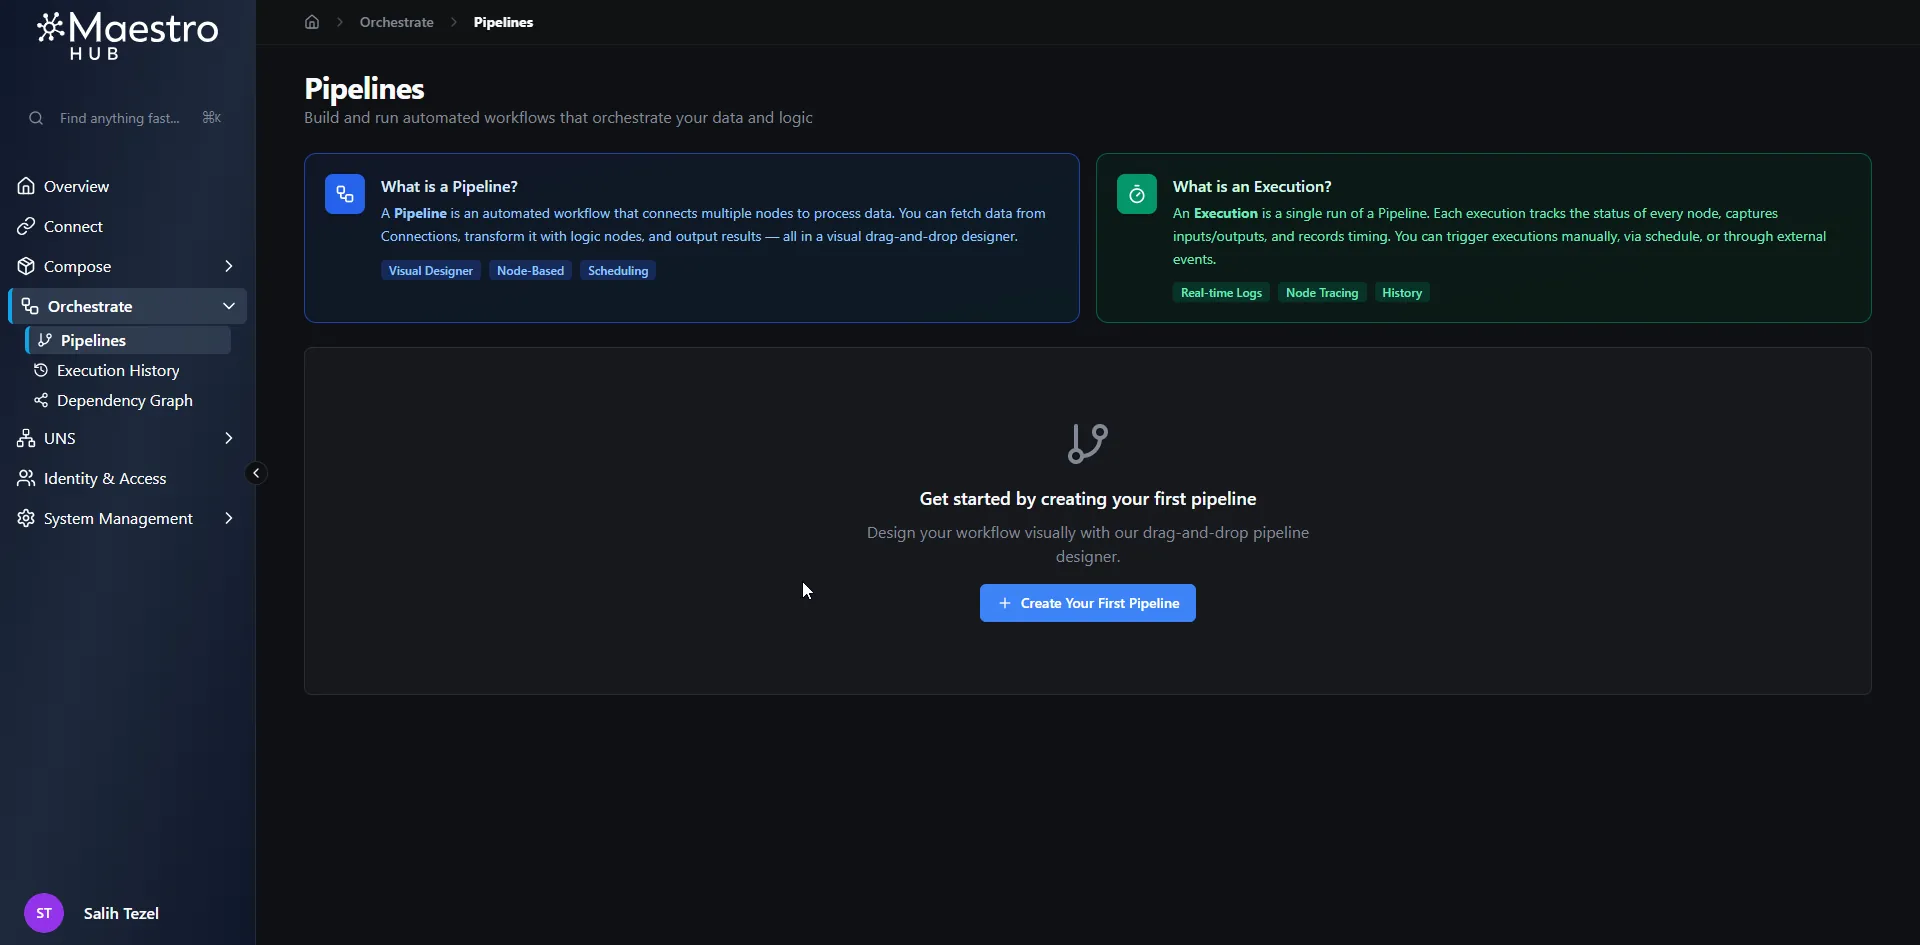
Open the Pipelines page
Start from the Pipelines page and open the pipeline creation flow.
Pipeline Triggers
Triggers decide when a pipeline runs — schedule, webhook, UNS subscription, MQTT, OPC UA, manual, or chain off another pipeline's completion.
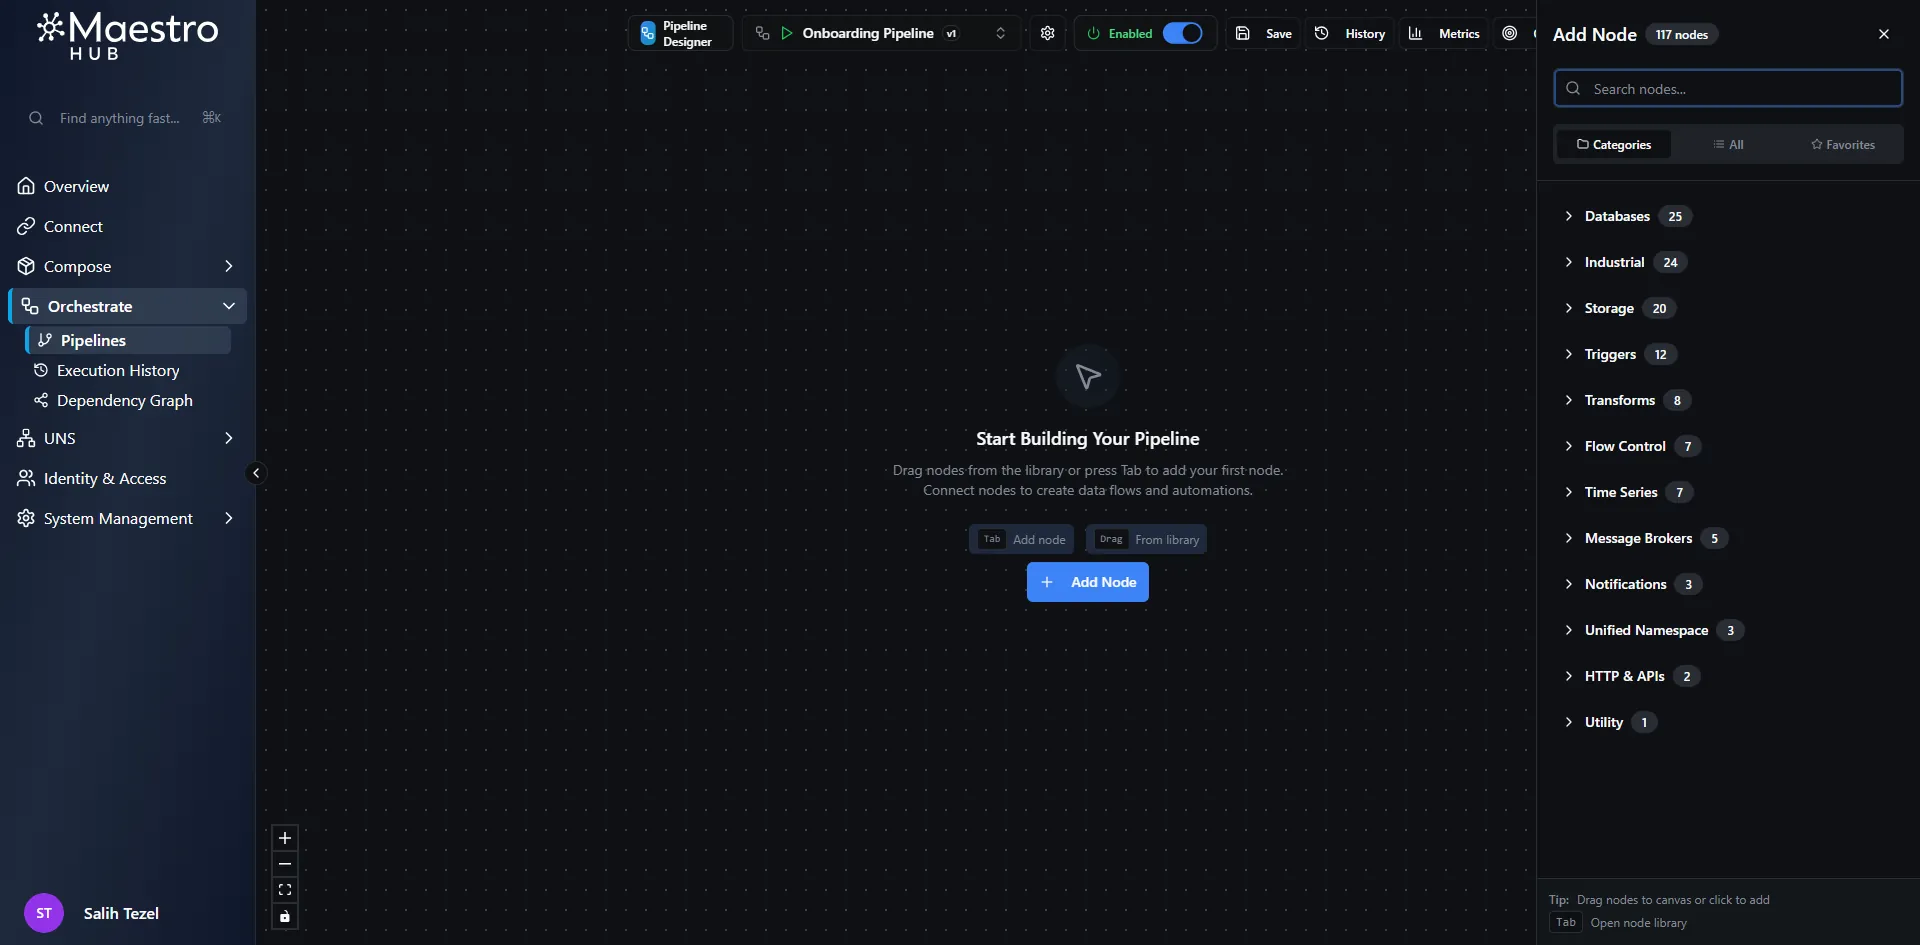
Node Library
Use the node library to browse available trigger types before adding the first trigger to the pipeline.
Pipeline Example I
An end-to-end pipeline build, from blank canvas to a running flow — drag, connect, configure, test, enable.
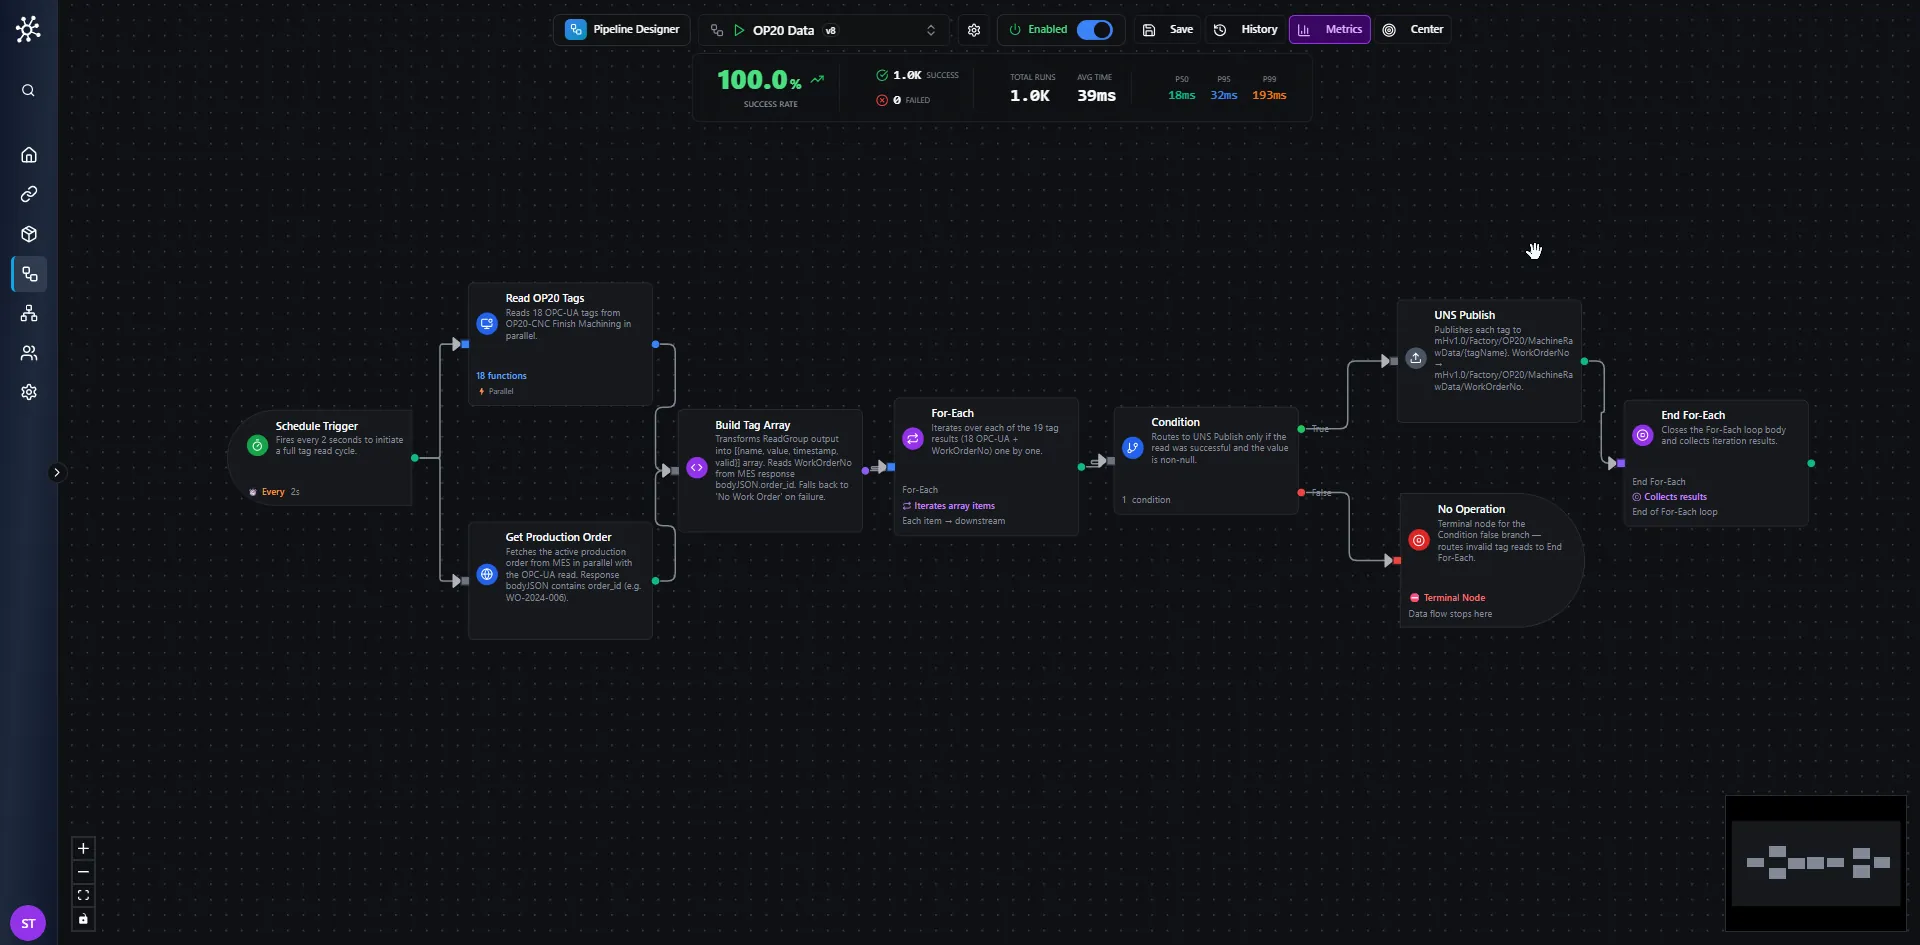
Pipeline Designer — Overview
Every 2 seconds, reads 18 OPC-UA tags from OP20-CNC Finish Machining and the active Work Order from MES, then publishes each valid value to its corresponding mHv1.0/Factory/OP20/MachineRawData/{tagName} UNS topic. This overview combines the canvas and metrics bar so customers can understand both the pipeline logic and the runtime health at a glance.
Pipeline Example 1 — History
The same pipeline once it's running: version history, execution log, and per-node traces with one-click replay.
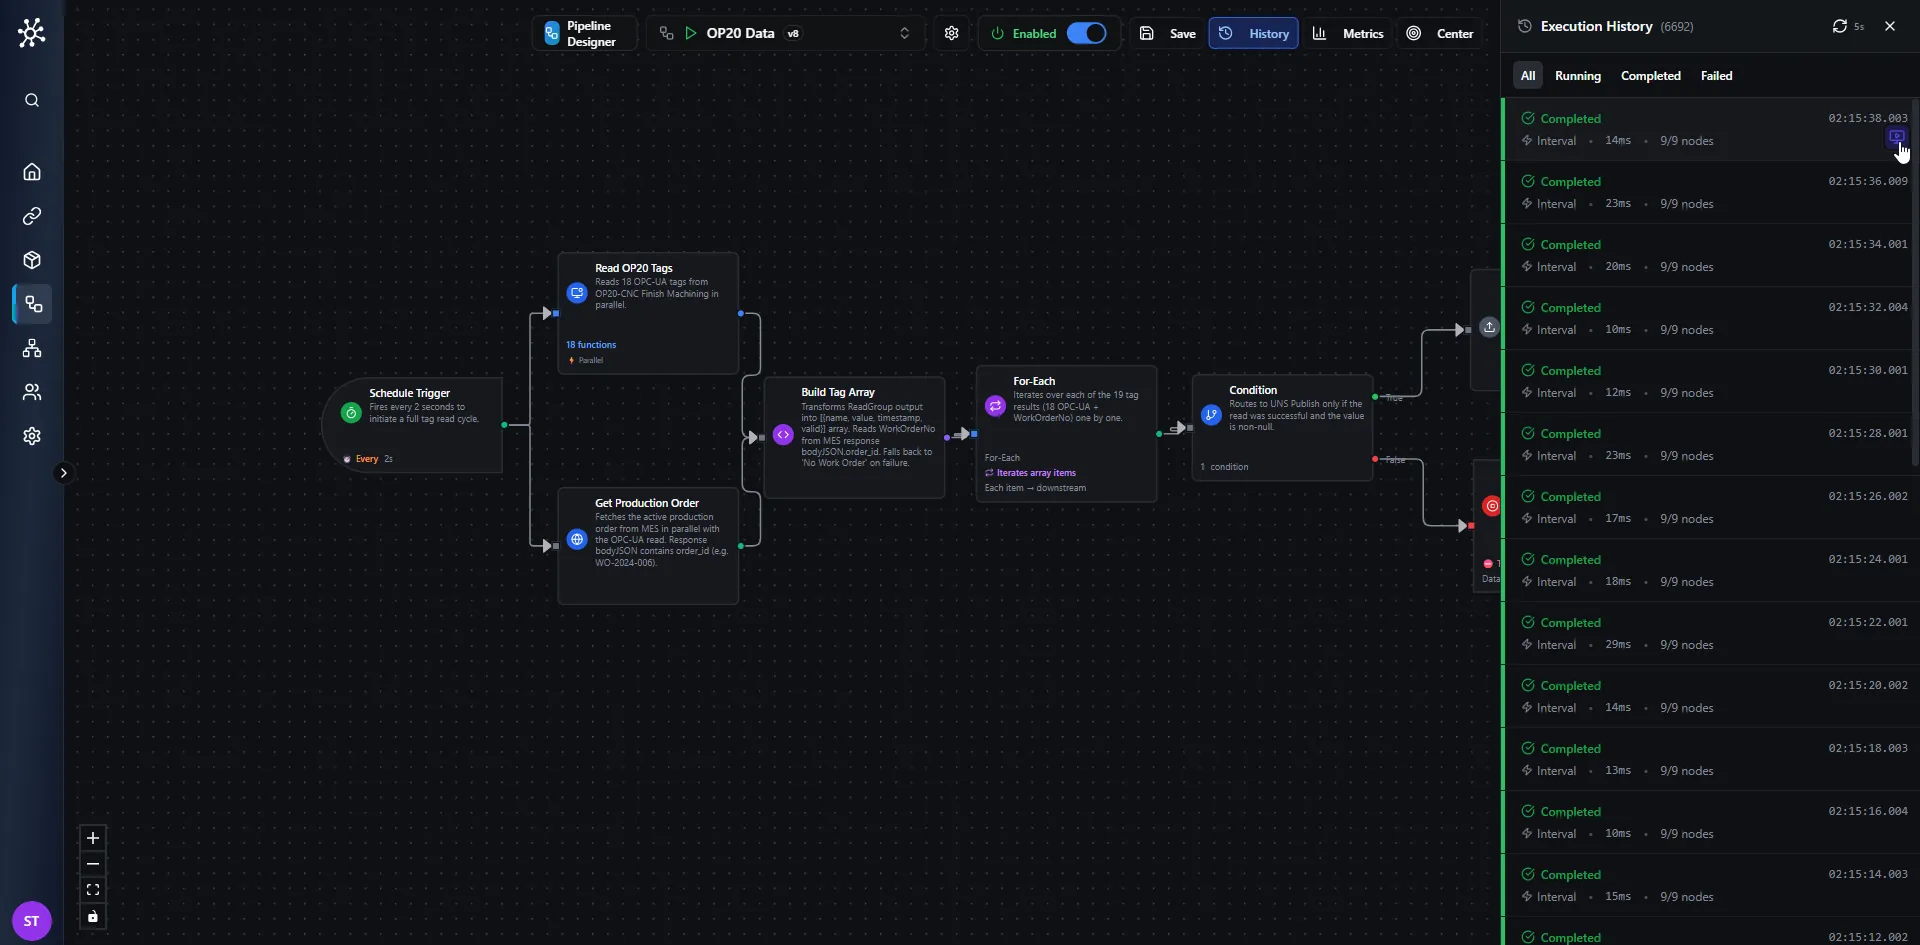
Replay — Execution History
A later OP20 Data revision adds a parallel production-order branch. The canvas now shows the extended flow while the history sidebar lists completed runs for the newer 9-node version.
Pipeline Example II
A second worked example with a different trigger and node mix, to show how the same primitives compose into very different pipelines.
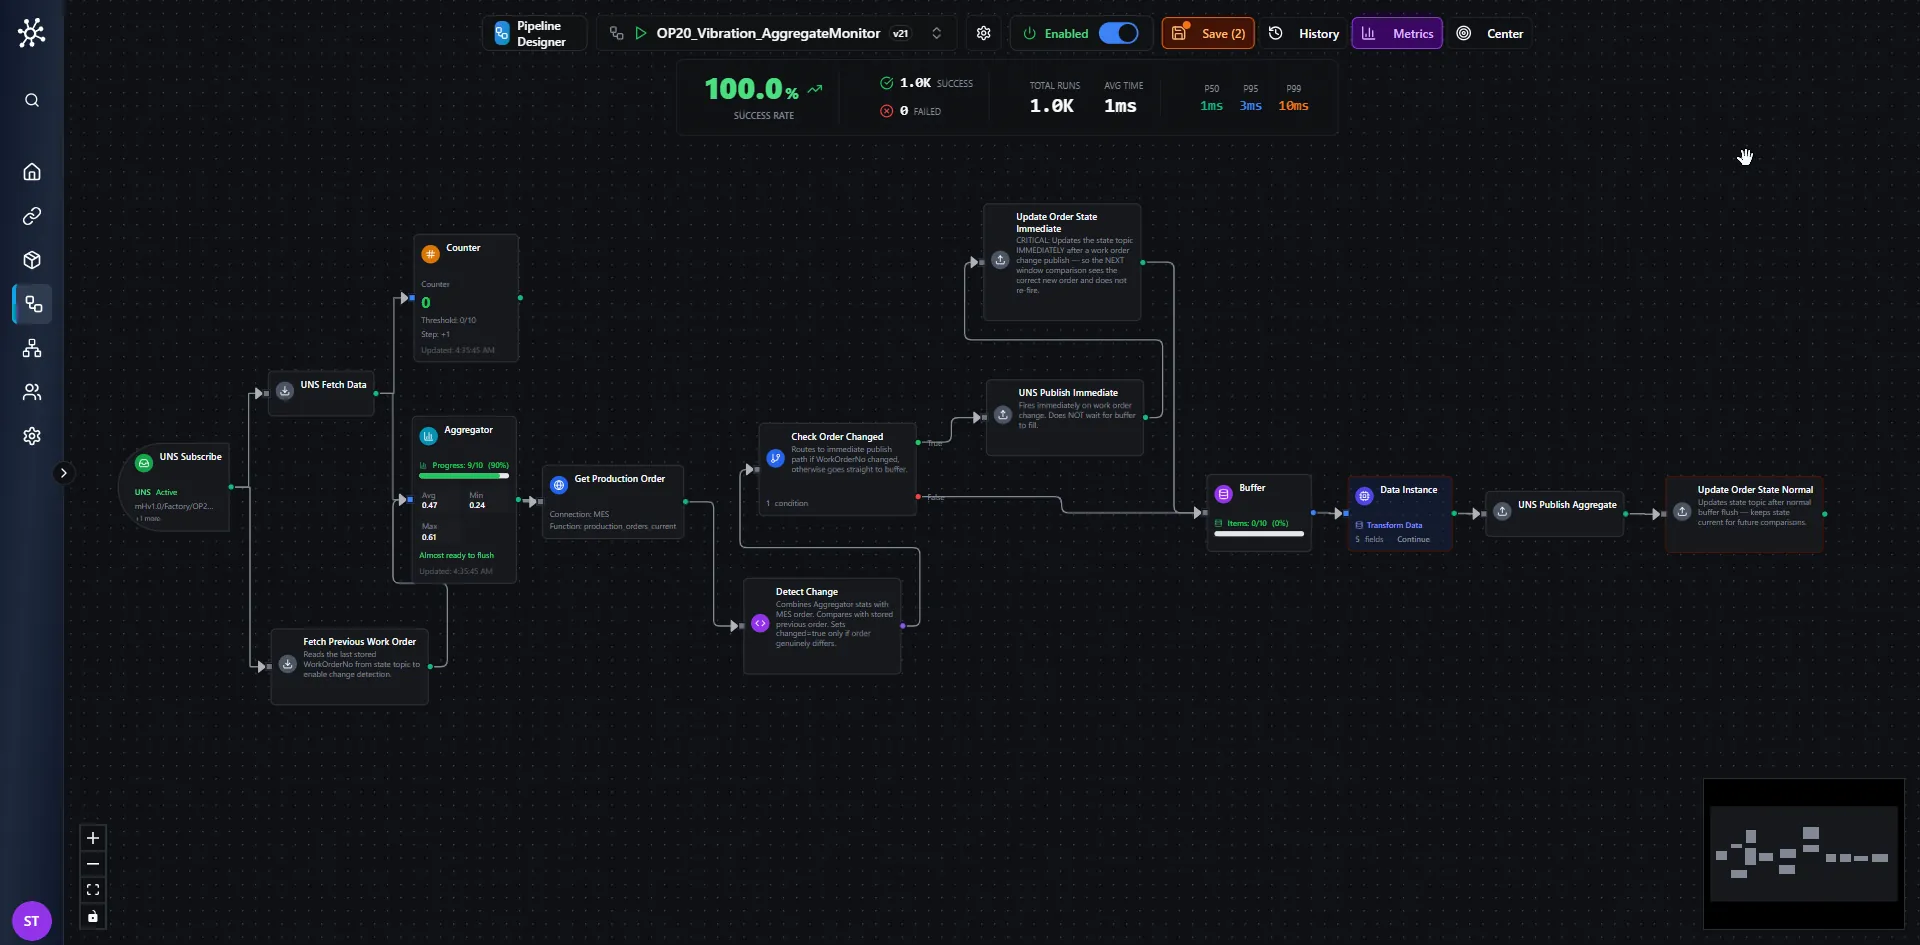
Complete OP20 Vibration Aggregate Monitor Canvas
The full canvas shows both branches together: immediate publish on order change and buffered aggregate publishing during normal steady-state operation.
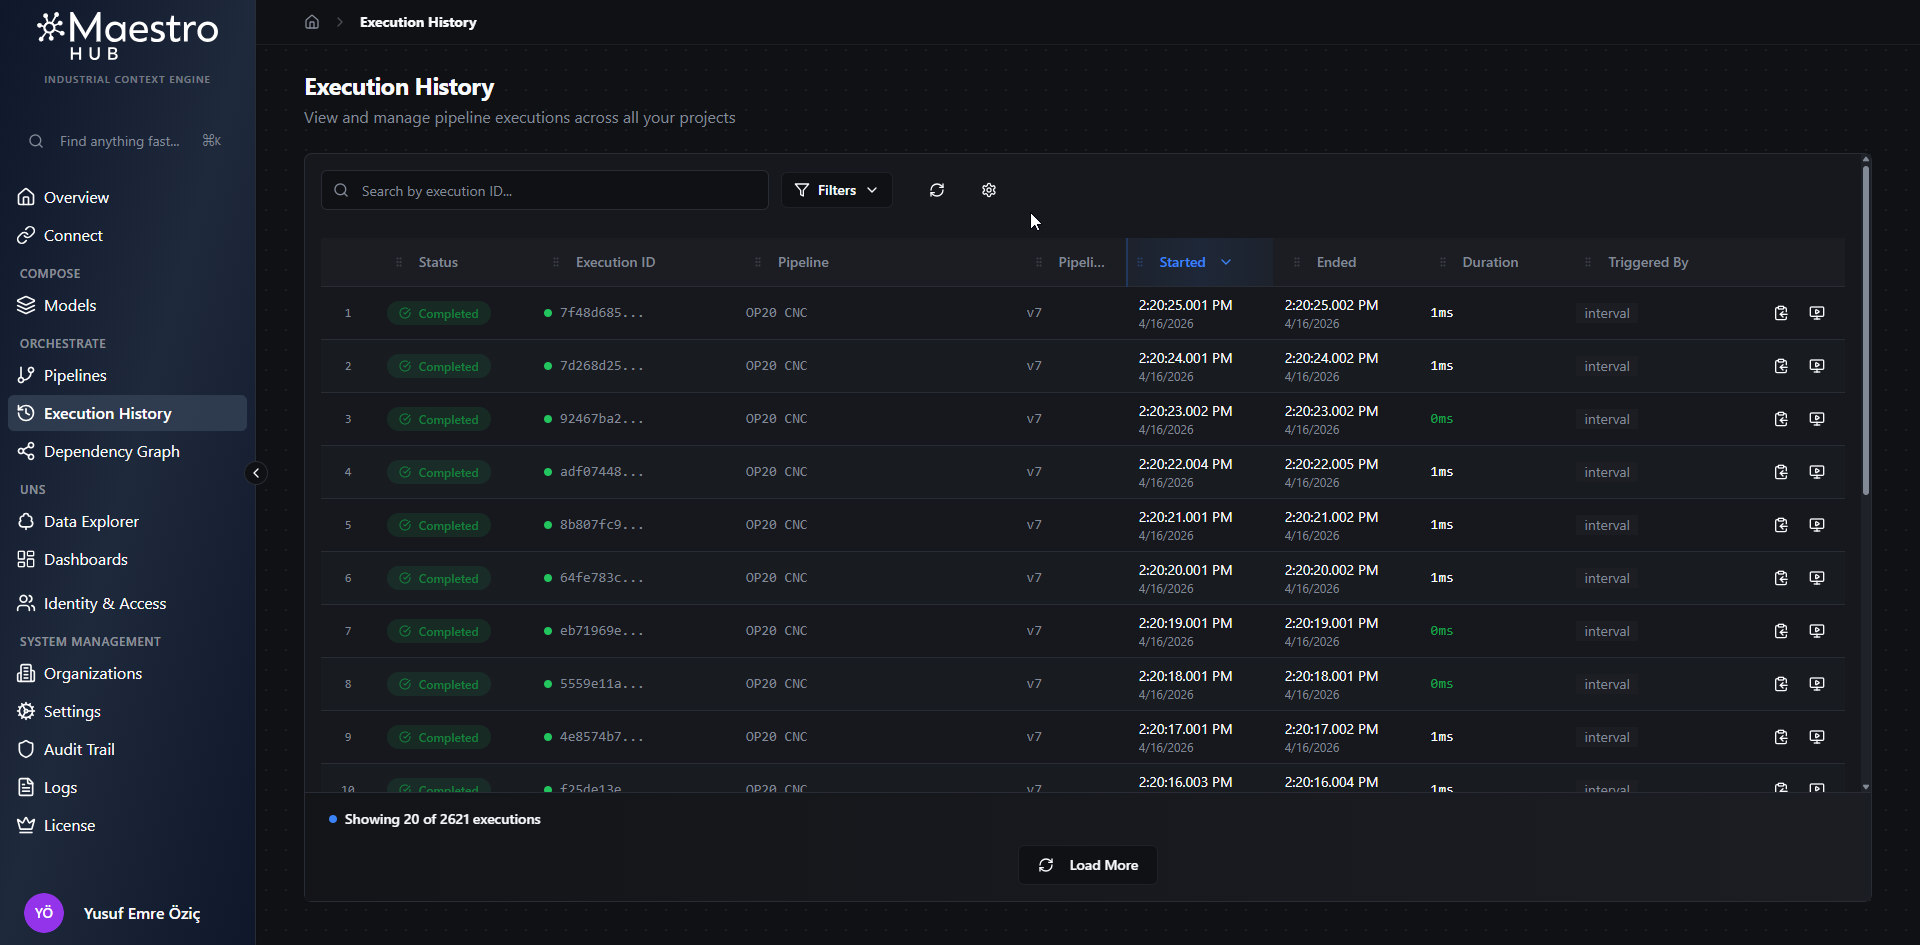
Execution History
Every pipeline run, searchable and filterable — by time range, status, or pipeline — with per-node payloads and a one-click replay.
Browse Pipeline Execution History
The Execution History page lets you review past pipeline runs, inspect execution metadata, and continue loading older records to access the full execution history.
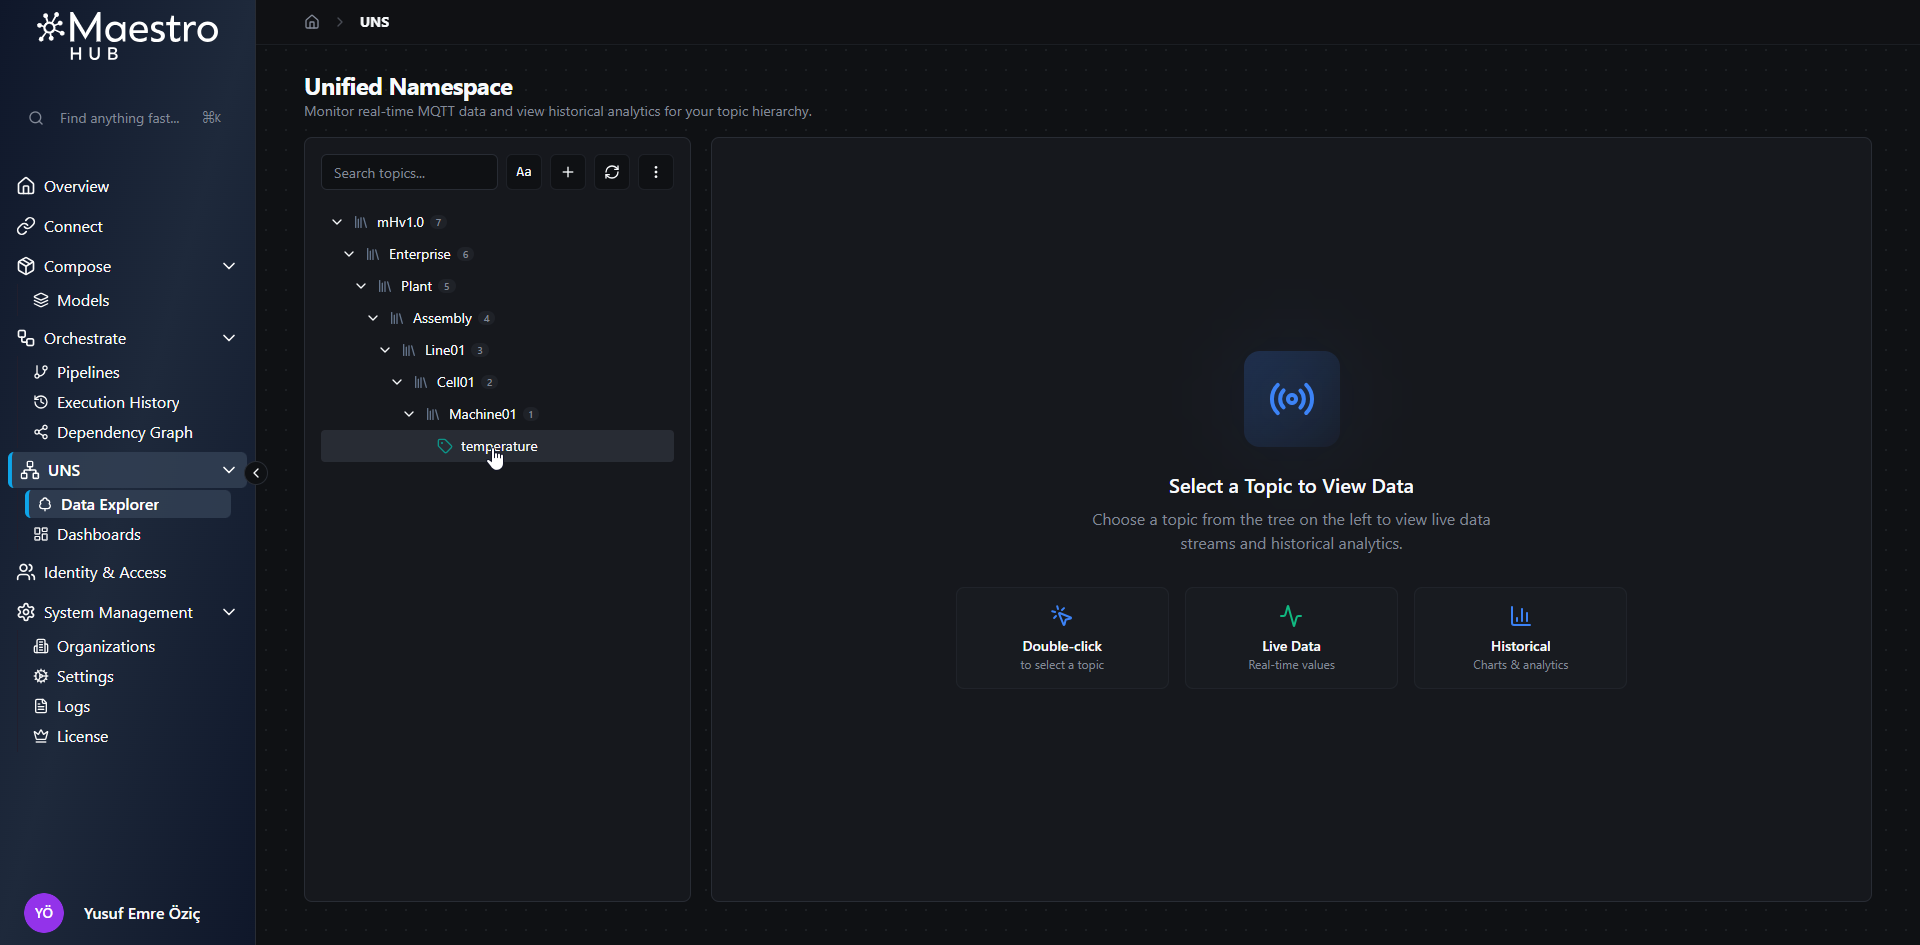
Data Explorer
Browse the UNS topic tree, watch live values stream in, and pull historical trends for any node — with retention controls per topic.
Select a Topic from the UNS Tree
Choose a topic from the hierarchy on the left to open its data view. Search and filter controls are intentionally not pinned.
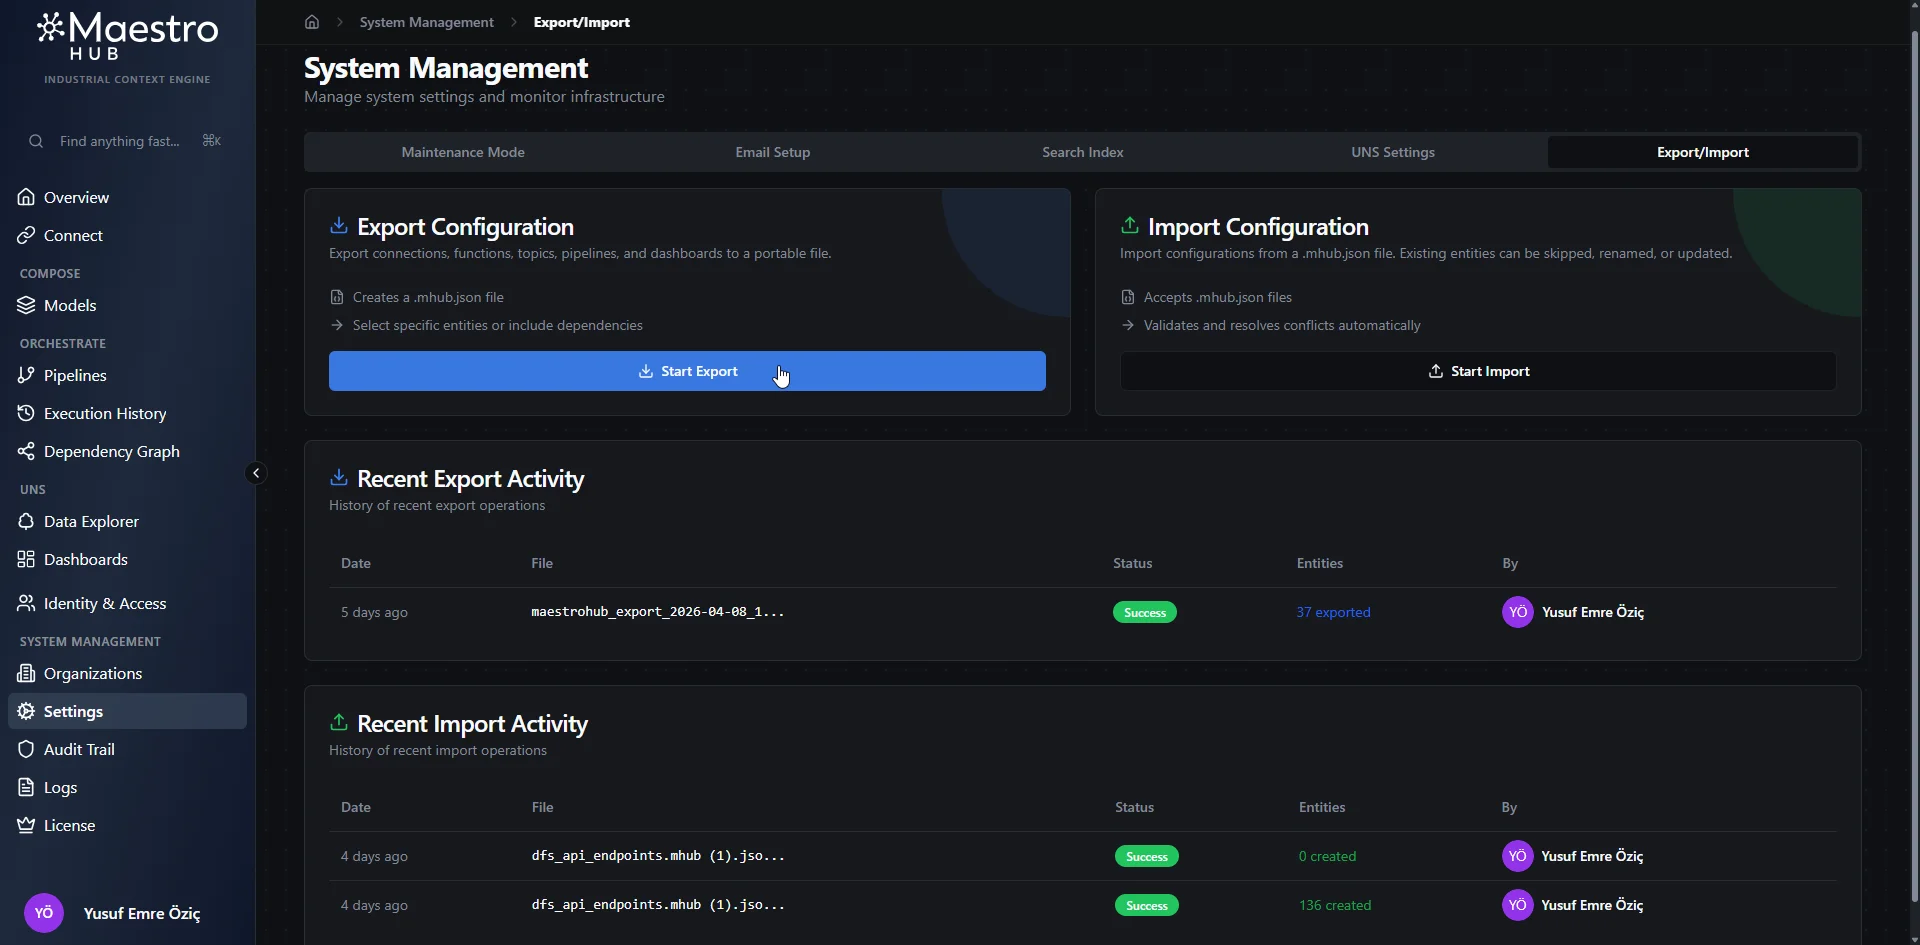
Settings — Import / Export
Move entities between environments as a single bundle — connections, pipelines, dashboards. Useful for backups and dev → prod promotion.
Start the Export Wizard
You can also begin from the export side when preparing a file to import later.
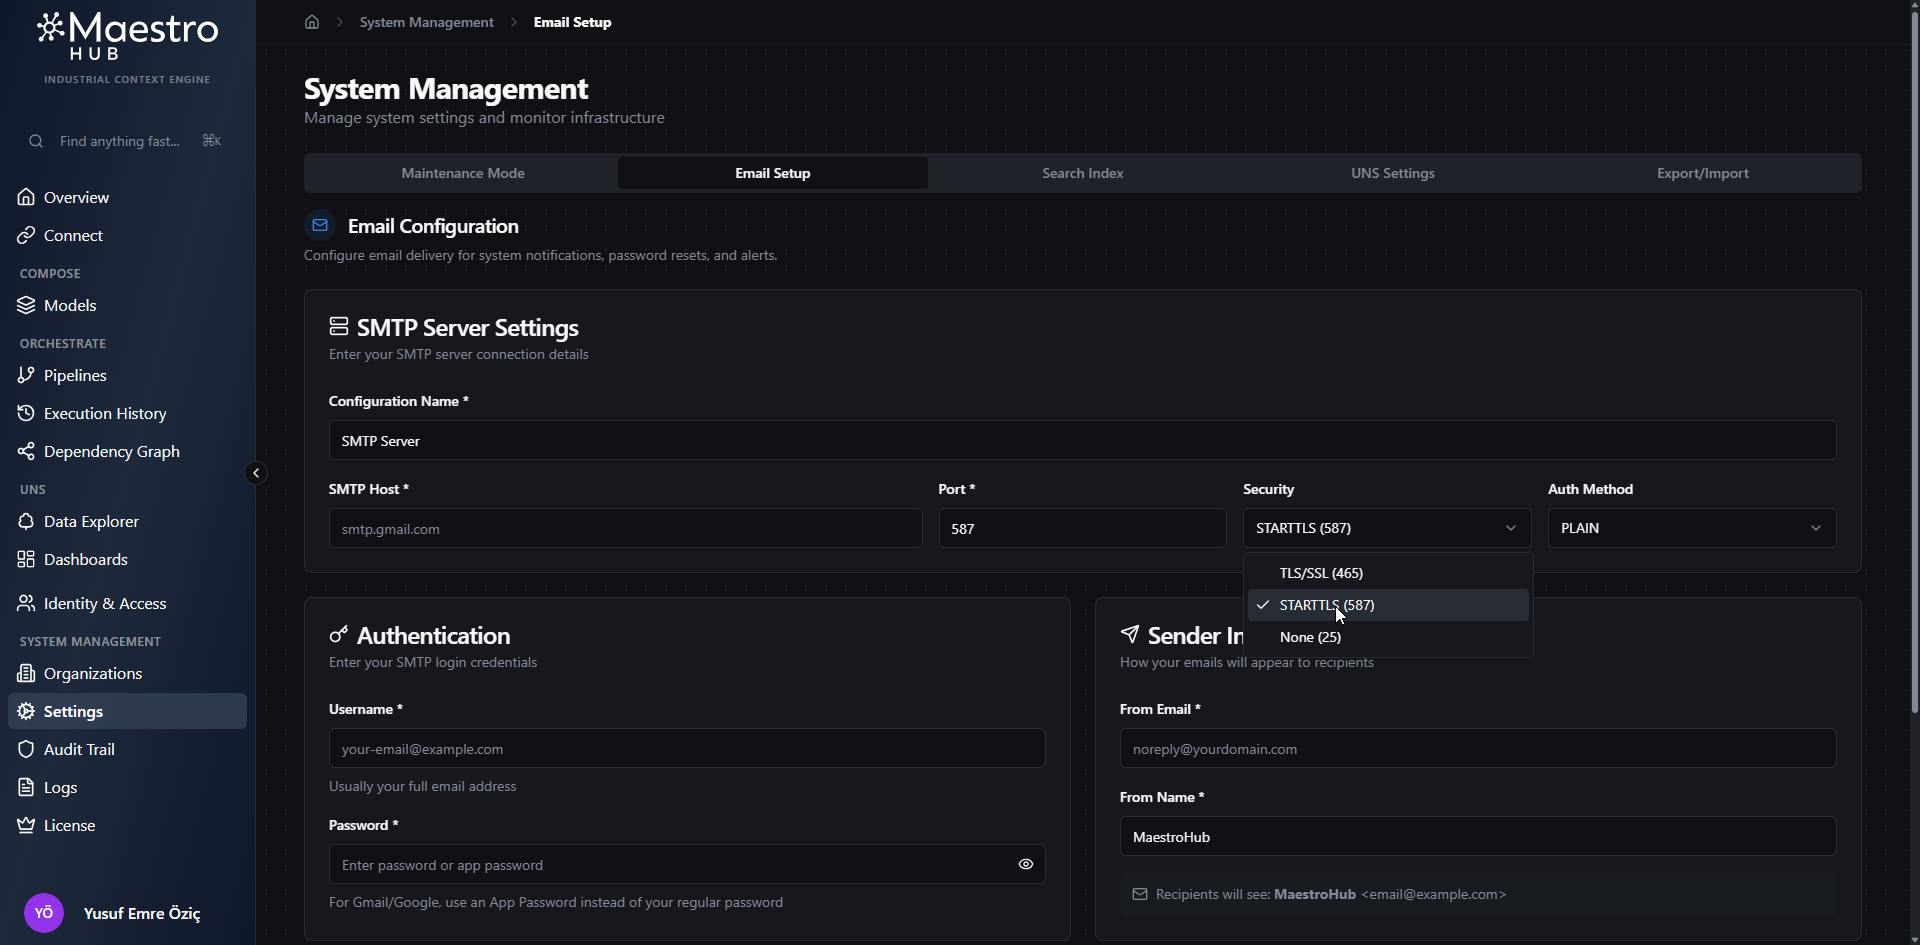
Settings — Email
Configure SMTP so pipelines can send alert emails. Set host, port, TLS, and authentication once — every pipeline's SMTP node uses it.
Configure SMTP Server Settings
Use the Email Setup page to configure SMTP host settings, authentication details, sender information, and a test email flow.
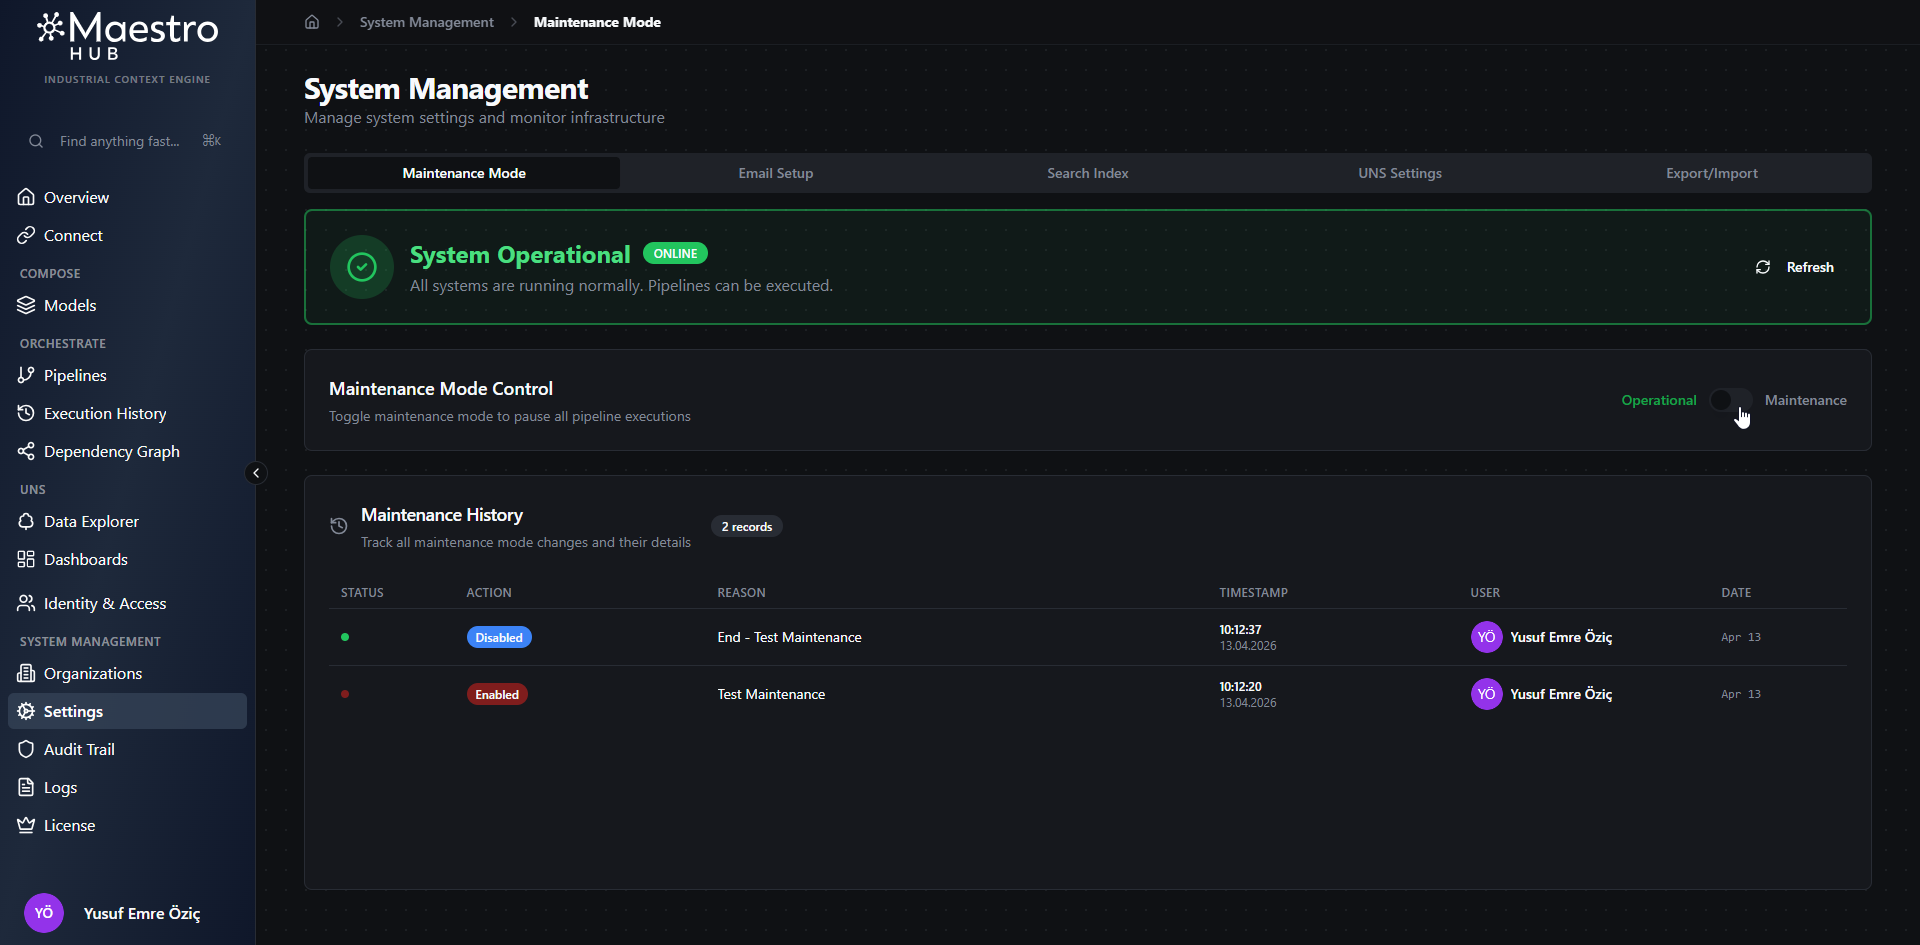
Settings — Maintenance Mode
Pause all pipeline execution and suspend every active connection without deleting anything. Use it for upgrades or planned downtime.
Review Maintenance Mode Status
Use the Maintenance Mode page to monitor system status, toggle maintenance mode, and review the maintenance history.
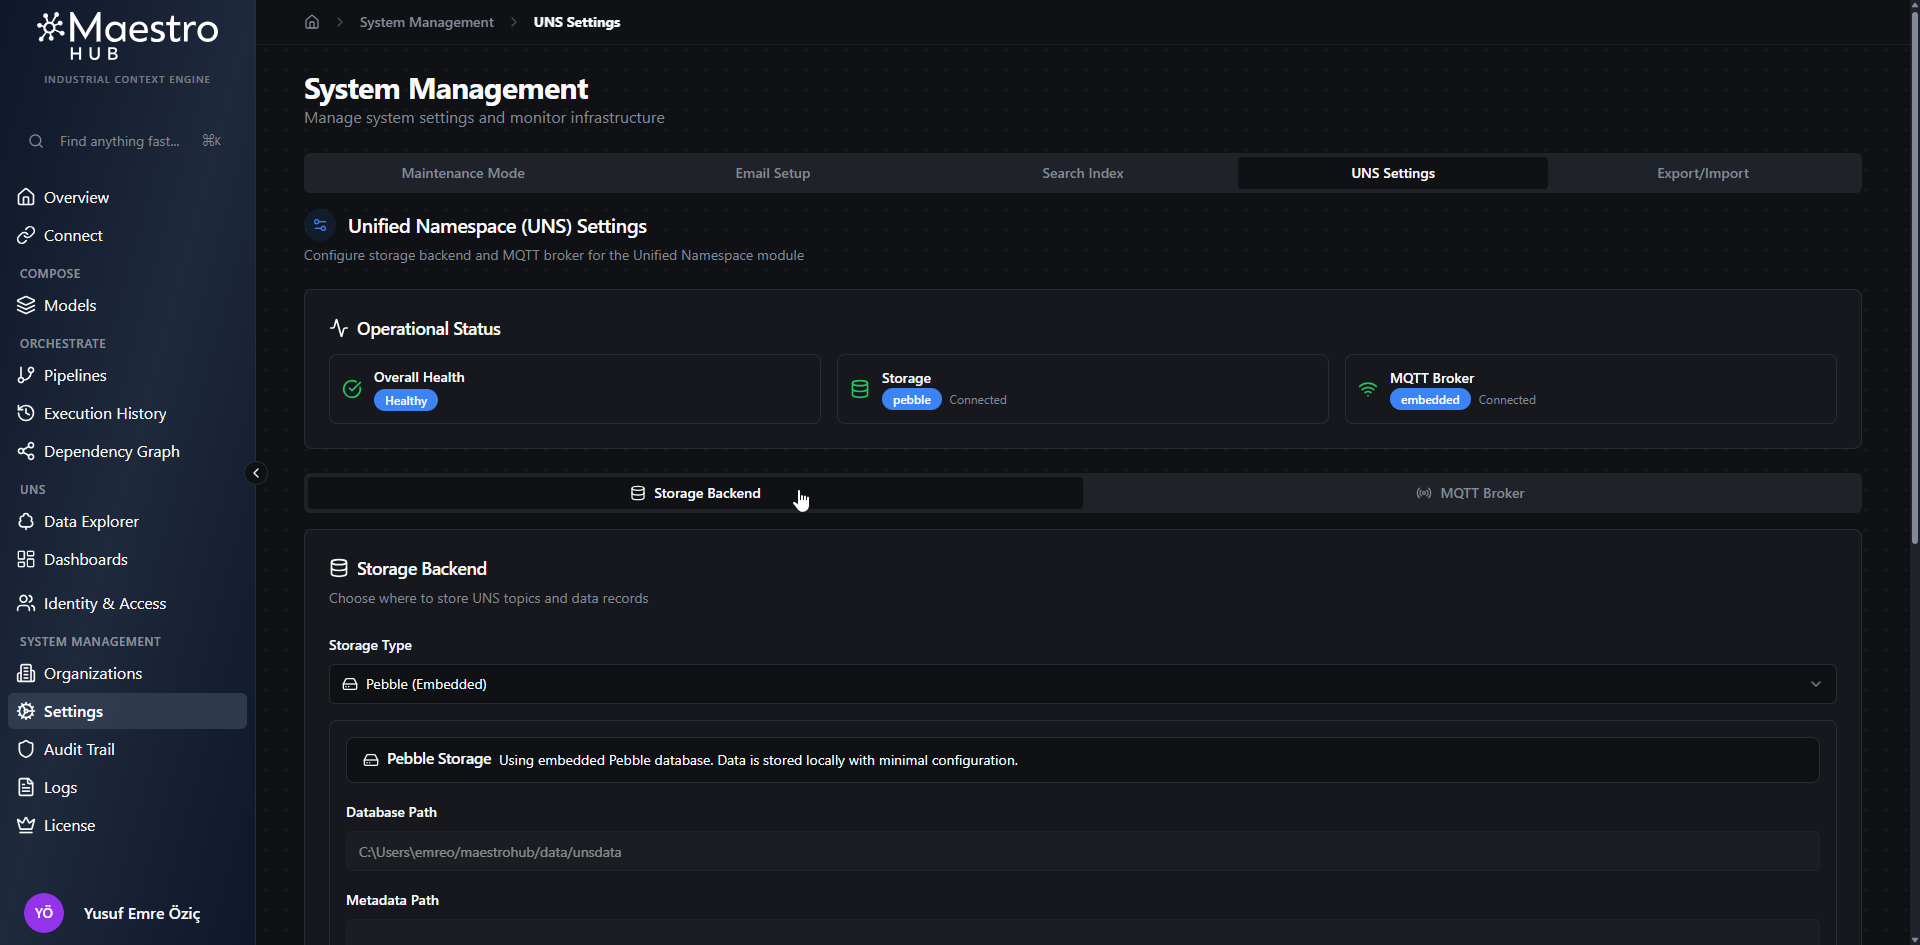
Settings — UNS Settings
Choose the storage backend (embedded or TimescaleDB), configure the embedded MQTT broker ports and authentication, and check subsystem health.
Review UNS Settings Overview
The UNS Settings page shows operational status and lets you switch between storage backend and MQTT broker configuration.
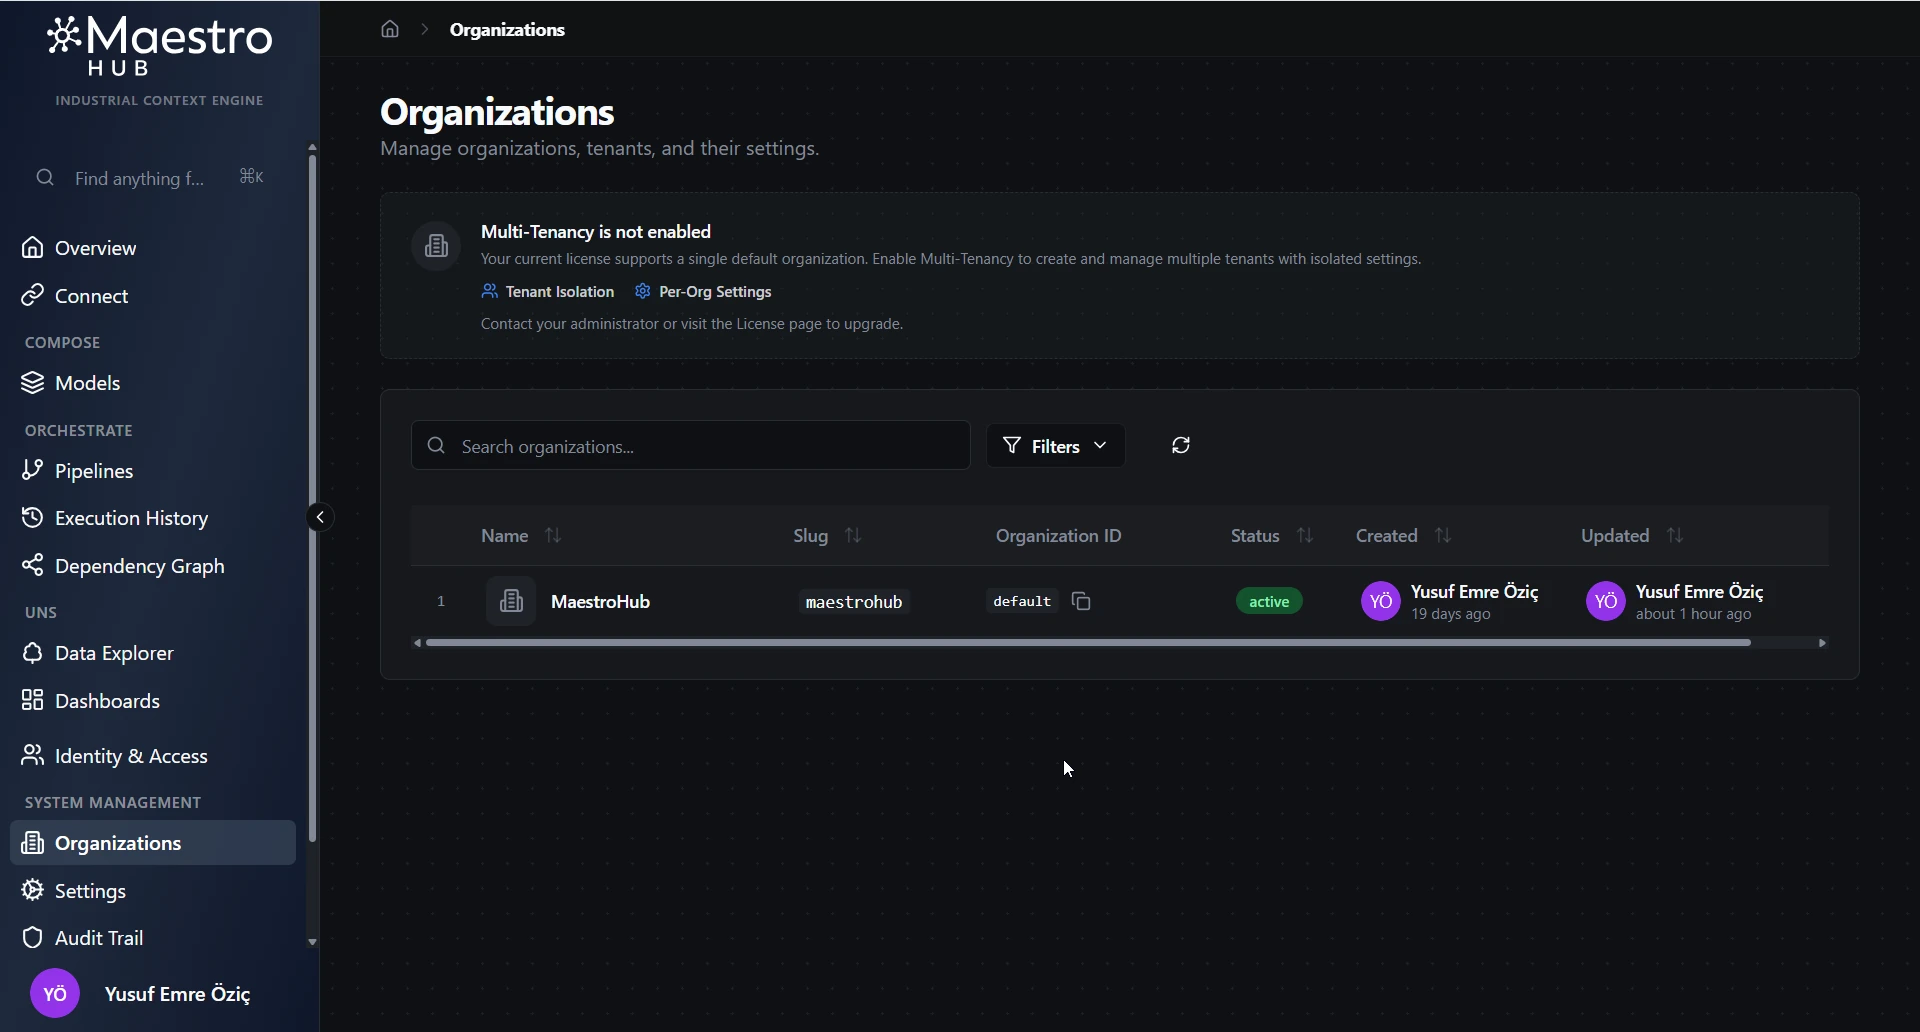
Organizations
Create and manage isolated workspaces. Each organisation has its own connections, pipelines, UNS topics, users, and dashboards.
Browse the Organizations List
Use the Organizations page to search, filter, and review existing organizations before opening one for editing.
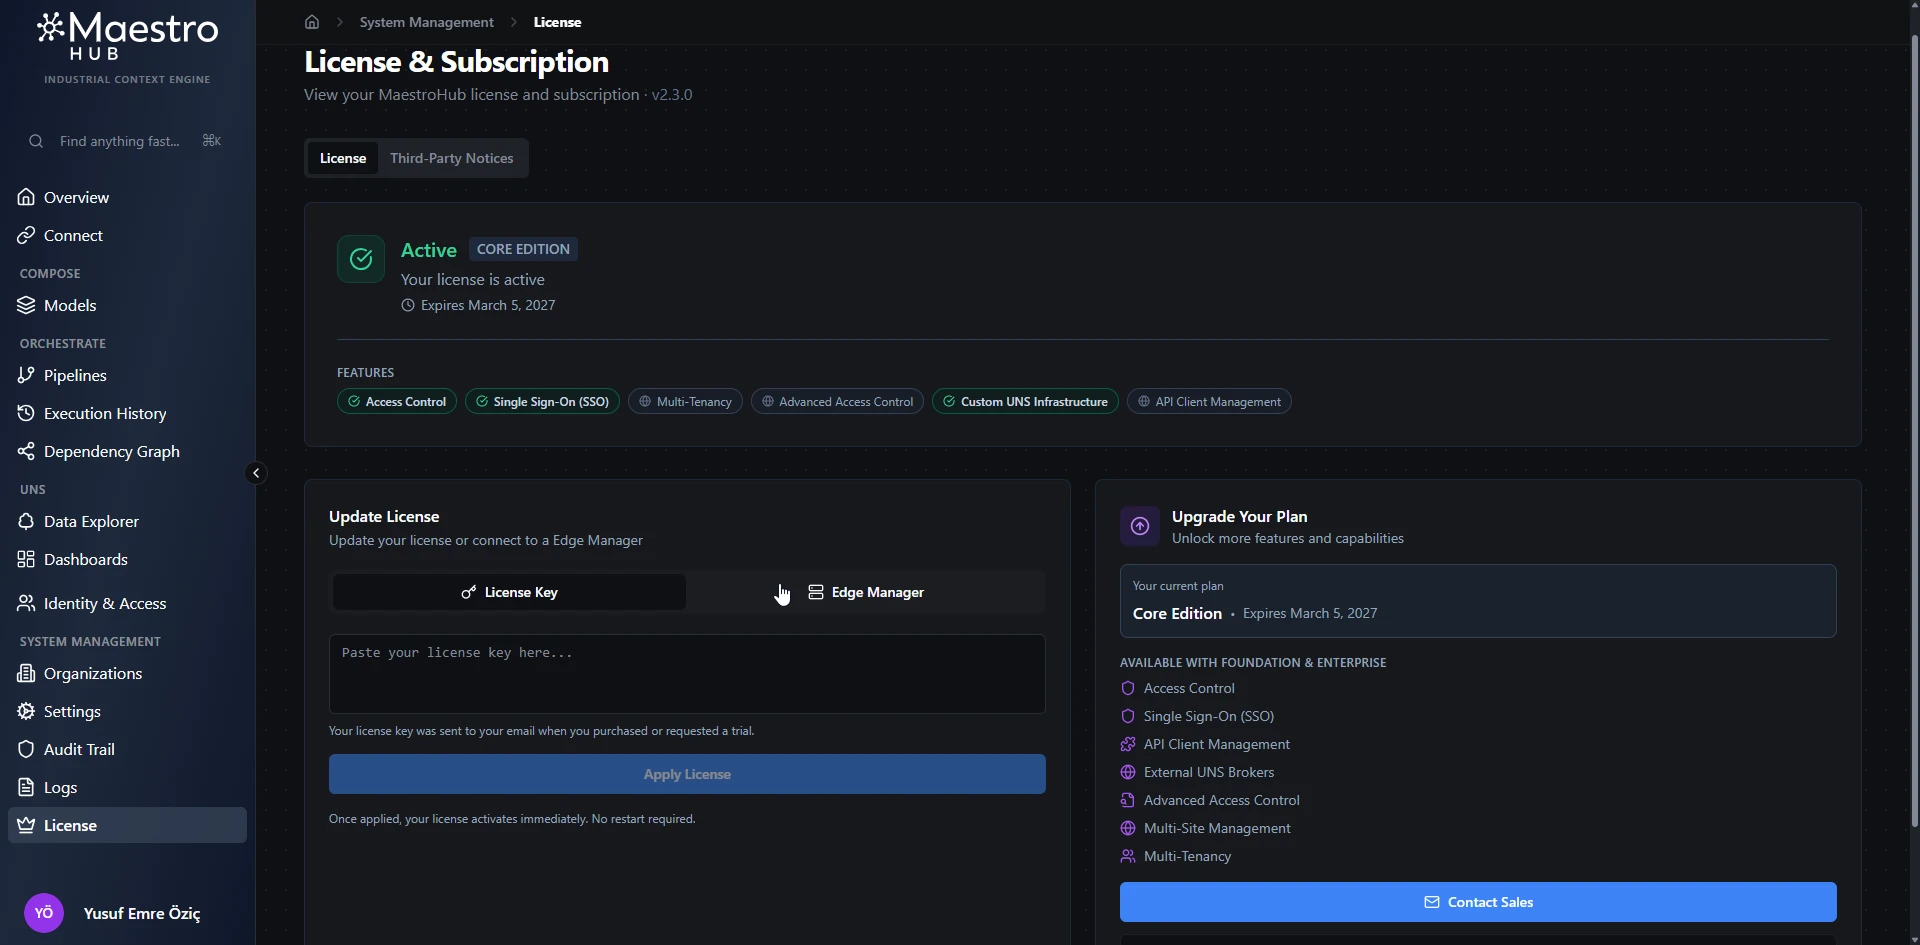
License
Activate your license key, view the edition and expiry date, and link to Edge Manager for fleet-wide licence management.
Review License Status and Update Options
The License tab shows the current plan status, enabled features, and the available methods for updating the license.
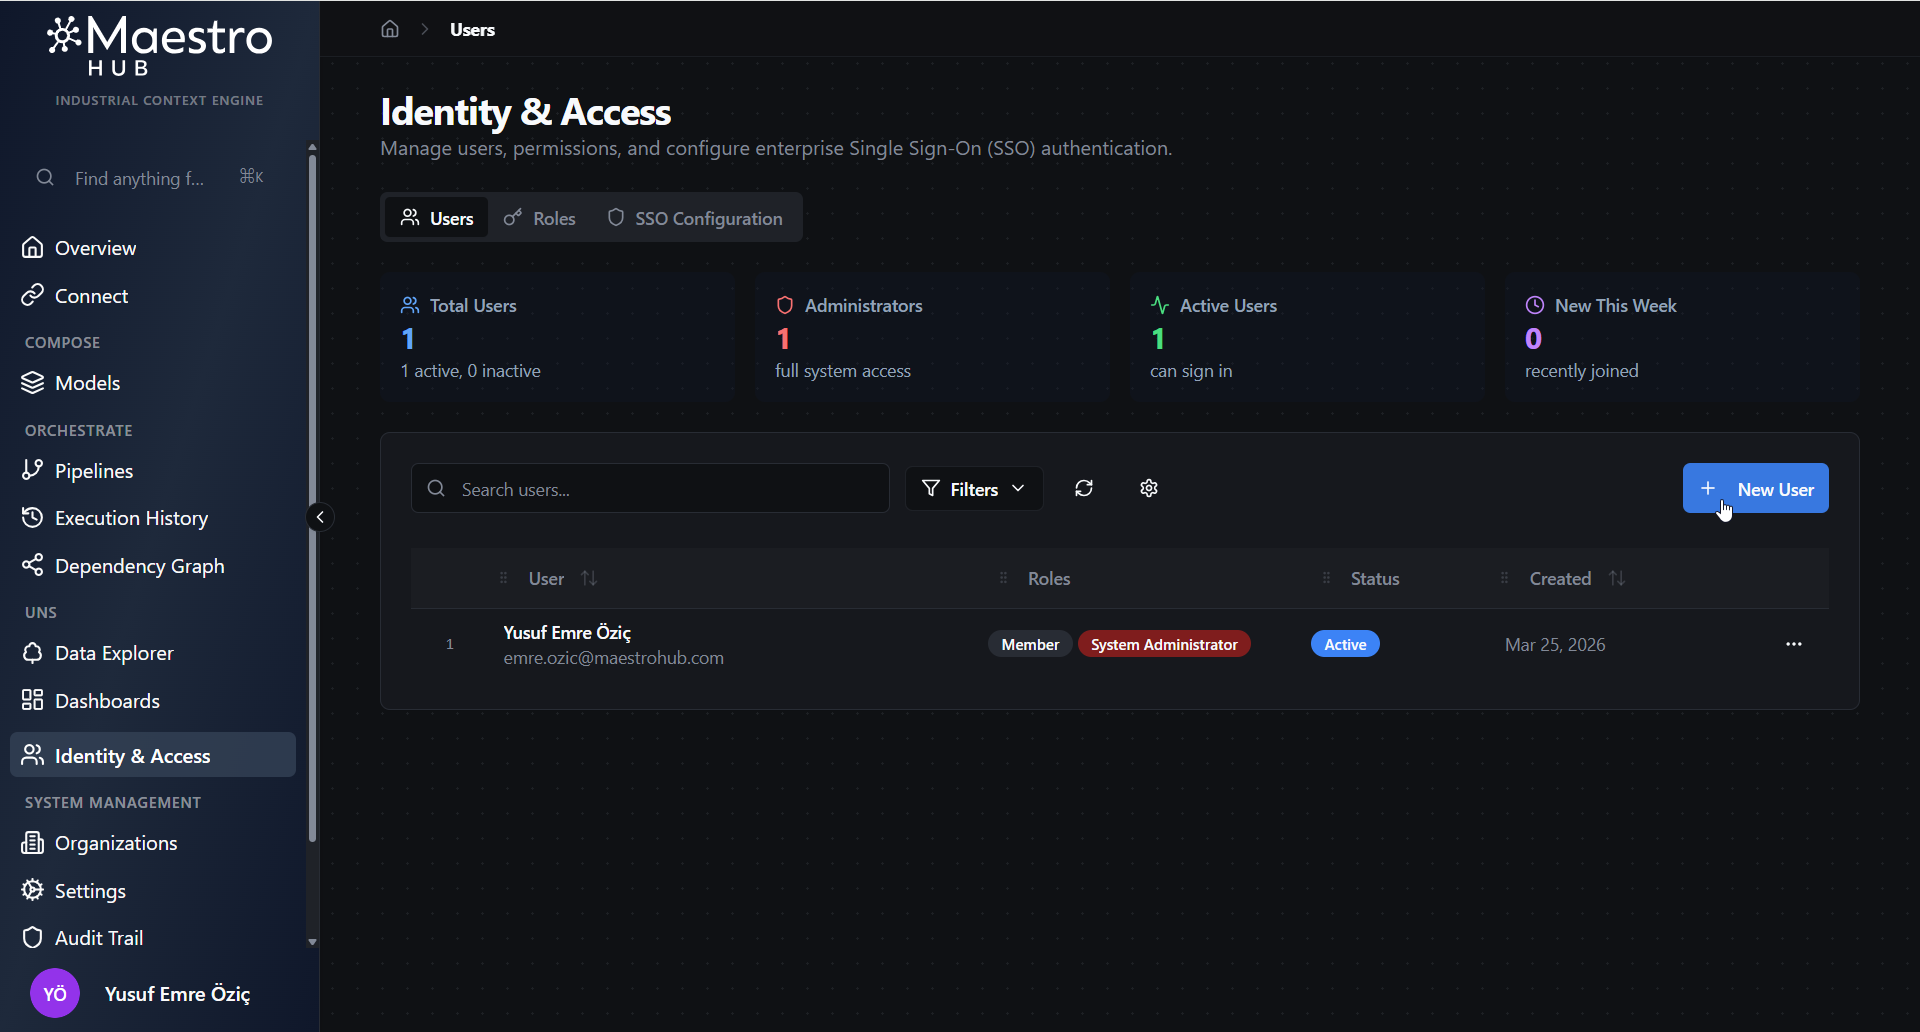
Users & Roles
Invite users by email, assign roles, deactivate accounts, and search or filter the user list.
Open the Users Page
The Users page lists existing accounts and provides the entry point for creating a new user.
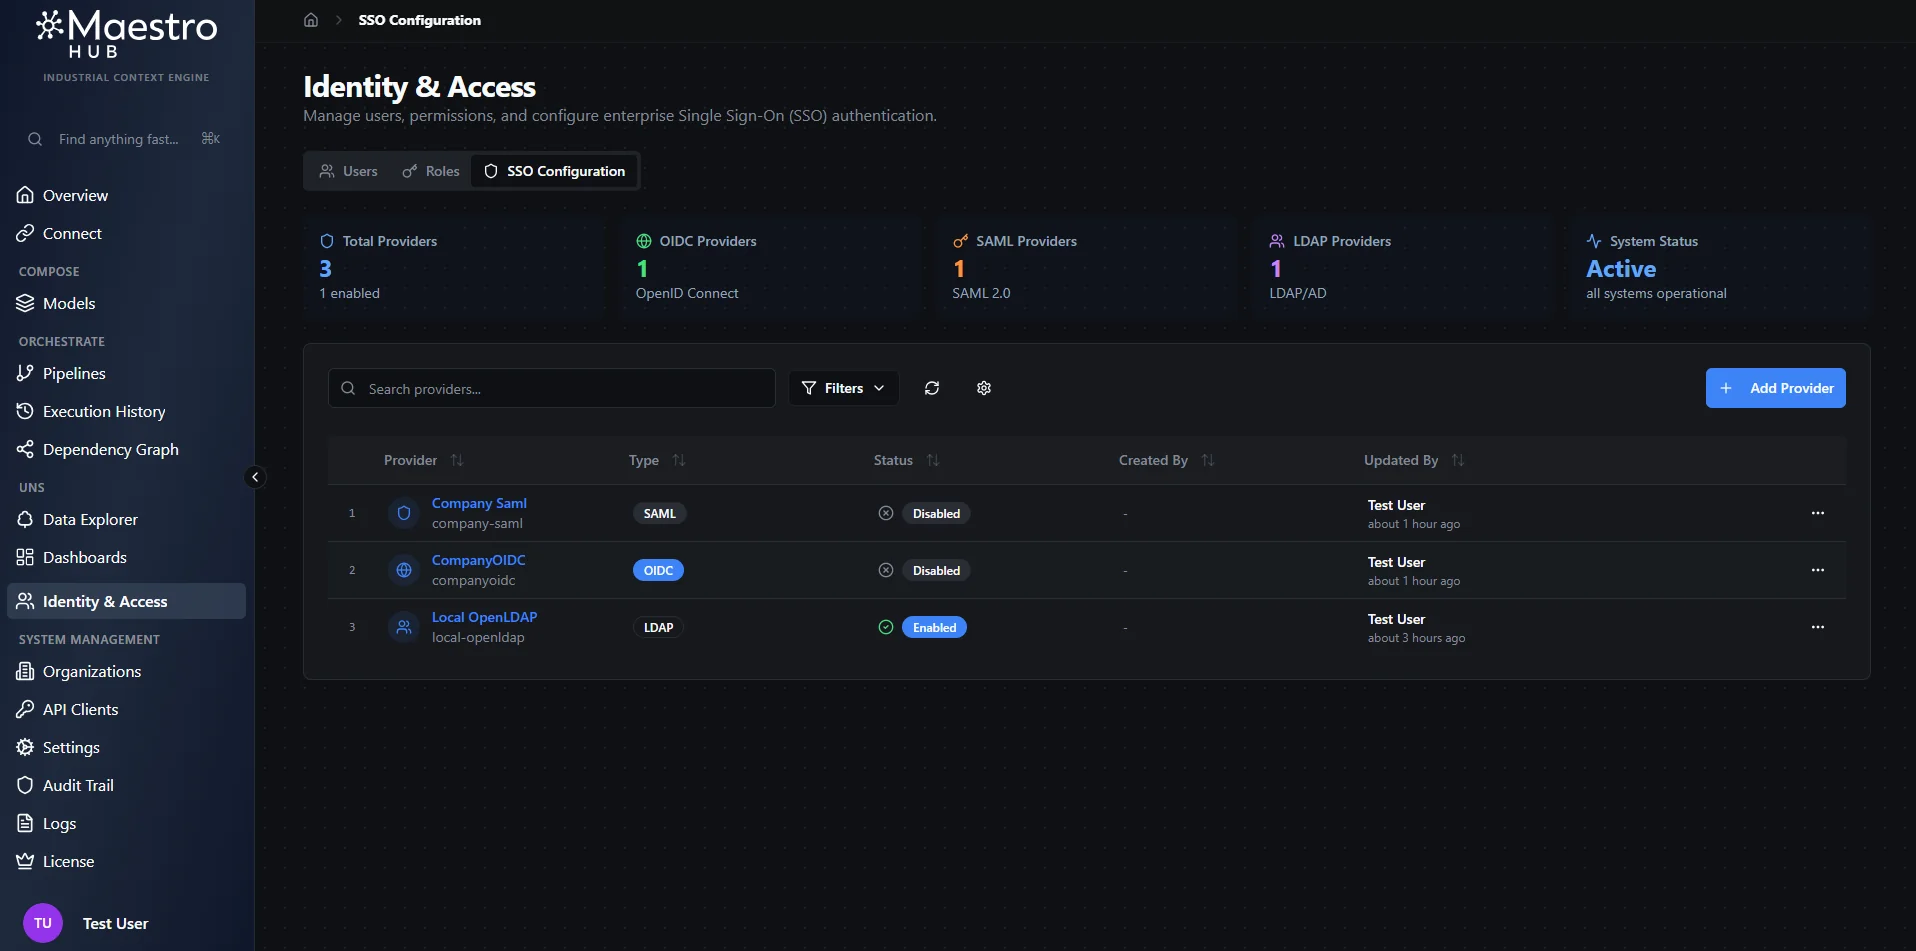
SSO Deep-Dive
Connect an identity provider — Azure AD, Okta, Google Workspace, Keycloak — via SAML 2.0 or OIDC so users log in with corporate credentials.
SSO Provider Management Dashboard
The main SSO Configuration tab shows all configured identity providers with statistics, filtering, and management actions.
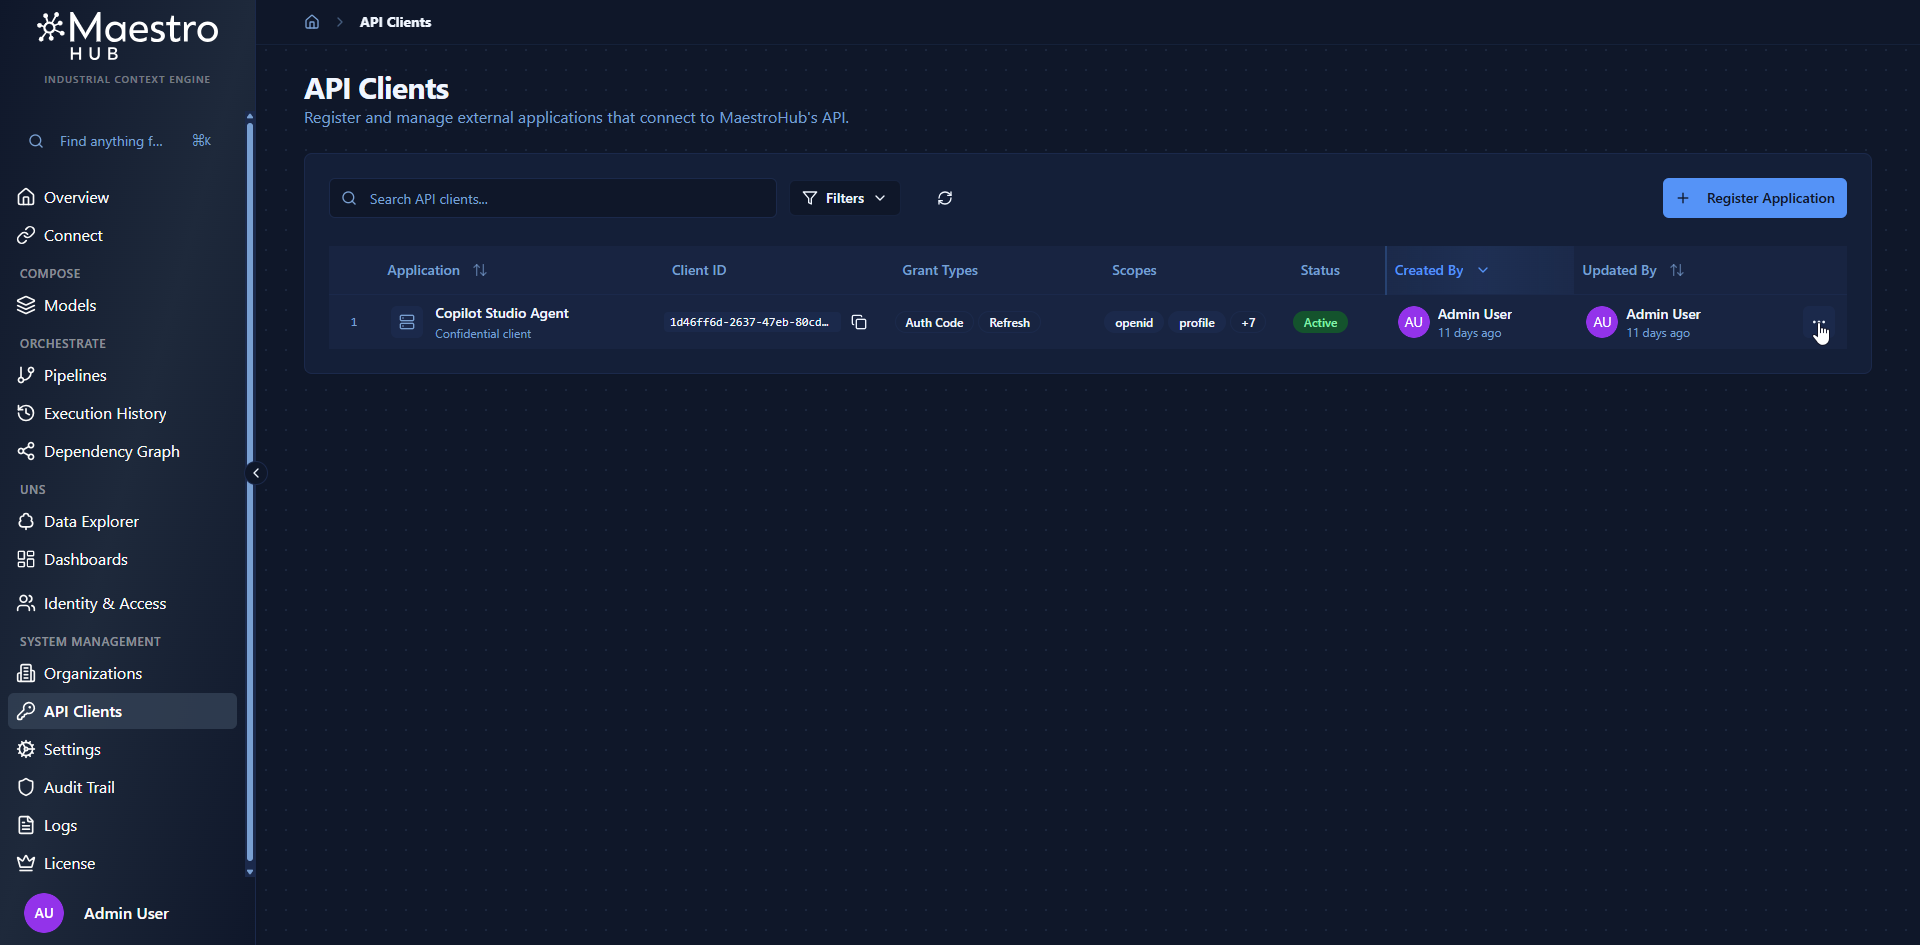
API Clients
Register OAuth2 applications for machine-to-machine access and create Personal Access Tokens for developer tooling and MCP integrations.
Browse Registered API Clients
Use the API Clients page to review registered applications and start a new application registration.