 OPC UA Integration Guide
Connect MaestroHub to industrial OPC UA servers for secure read, write, browse, and monitor operations across your production assets. This guide covers connection setup, function authoring, and pipeline integration.
Overview
The OPC UA connector gives you:
- Secure sessions with selectable security policies, message signing, and certificate trust
- Namespace-aware browsing to discover tags before wiring them into functions
- Low-latency read/write calls tuned for both cyclic polling and on-demand commands
- Real-time subscriptions for event-driven monitoring of node value changes
- Centralized access control leveraging OPC UA user authentication and Maestro role-based access
Combine OPC UA reads with Modbus, MQTT, or REST nodes to blend shop-floor signals with enterprise data.
Connection Configuration
Creating an OPC UA Connection
From Connections → New Connection → OPC UA, configure the fields below:
OPC UA Connection Creation Fields
1. Profile Information
| Field | Default | Description |
|---|---|---|
| Profile Name | - | A descriptive name for this connection profile (required, max 100 characters) |
| Description | - | Optional description for this OPC UA connection |
2. OPC UA Server Configuration
| Field | Default | Description |
|---|---|---|
| Server Hostname | - | OPC UA server hostname or IP address (e.g., opcua.example.com) - required |
| Port | 4840 | OPC UA server port (1-65535) |
| Path | - | Optional server path (e.g., /opcua) |
Server URL Format
The full server URL is automatically constructed: opc.tcp://{hostname}:{port}{path}
Example: opc.tcp://opcua.example.com:4840/opcua
3. Security Configuration
3a. Security Policy and Mode
| Field | Default | Description |
|---|---|---|
| Security Policy | None | OPC UA security policy for message encryption - required |
| Security Mode | None | OPC UA security mode for message protection - required |
Security Policy Options
- None: No security
- Basic128Rsa15: Basic 128-bit RSA encryption
- Basic256: 256-bit encryption
- Basic256Sha256: 256-bit encryption with SHA-256 (recommended)
Security Mode Options
- None: No message protection
- Sign: Messages will be signed for integrity
- SignAndEncrypt: Messages will be signed and encrypted
Important Validation Rules
- When Security Policy is
None, Security Mode must also beNone. - When Security Policy is not
None, certificates are required.
3b. Certificates
(Only displayed when Security Policy is NOT None)
| Field | Default | Description |
|---|---|---|
| Client Certificate | - | Client certificate for server authentication (PEM format) |
| Client Private Key | - | Private key for client certificate (PEM format, required when certificate is provided) |
4. Authentication
| Field | Default | Description |
|---|---|---|
| Authentication Type | Anonymous | Authentication method for OPC UA server access - required |
| Username | - | OPC UA server username (required when Authentication Type is UsernamePassword) |
| Password | - | OPC UA server password (required when Authentication Type is UsernamePassword) |
Authentication Type Options
- Anonymous: No credentials required
- UsernamePassword: Requires both username and password
5. Connection Timeouts
| Field | Default | Description |
|---|---|---|
| Connection Timeout (seconds) | 30 | Maximum time to establish connection (1-300 seconds) |
| Request Timeout (seconds) | 5 | Maximum time to wait for server response (1-300 seconds) |
6. Session Configuration
| Field | Default | Description |
|---|---|---|
| Session Timeout (minutes) | 60 | OPC UA session timeout duration in minutes (0-1440, 0 = disabled, max 24 hours) |
| Reconnect Interval (seconds) | 1 | Interval for reconnection attempts in seconds (1-60, max 1 minute) |
7. Retry Configuration
| Field | Default | Description |
|---|---|---|
| Max Retries | 3 | Maximum number of retry attempts (0-10) |
| Retry Delay (milliseconds) | 500 | Delay between retry attempts in milliseconds (100-10000 ms, 100 ms - 10 s) |
8. Connection Labels
| Field | Default | Description |
|---|---|---|
| Labels | - | Key-value pairs to categorize and organize this OPC UA connection (max 10 labels) |
Example Labels
environment: production- Deployment environmentteam: automation- Responsible teamprotocol: opcua- Connection protocolregion: us-east-1- Geographical region
- Security Configuration: When Security Policy is set to anything other than
None, certificates become mandatory. - Certificate Validation: Private key is required when a client certificate is provided.
- Authentication: When Authentication Type is
UsernamePassword, both username and password fields become required. - Server URL: The system automatically constructs the full OPC UA server URL from hostname, port, and path.
- Session Management: Session timeout can be disabled by setting it to 0, but this is not recommended for production environments.
- Retry Behavior: The system will attempt reconnection based on the reconnect interval and will retry failed operations according to the retry configuration.
- Default Port: The standard OPC UA port is 4840.
- Timeout ranges: All timeout values must be within their specified ranges to ensure proper operation.
Function Builder
Creating OPC UA Functions
After saving the connection, author reusable OPC UA functions:
- Open Functions → New Function
- Choose OPC UA Read, Write, Browse, or Monitor as the function type
- Select the OPC UA connection profile you configured
- Define target nodes, payload mappings, and execution options
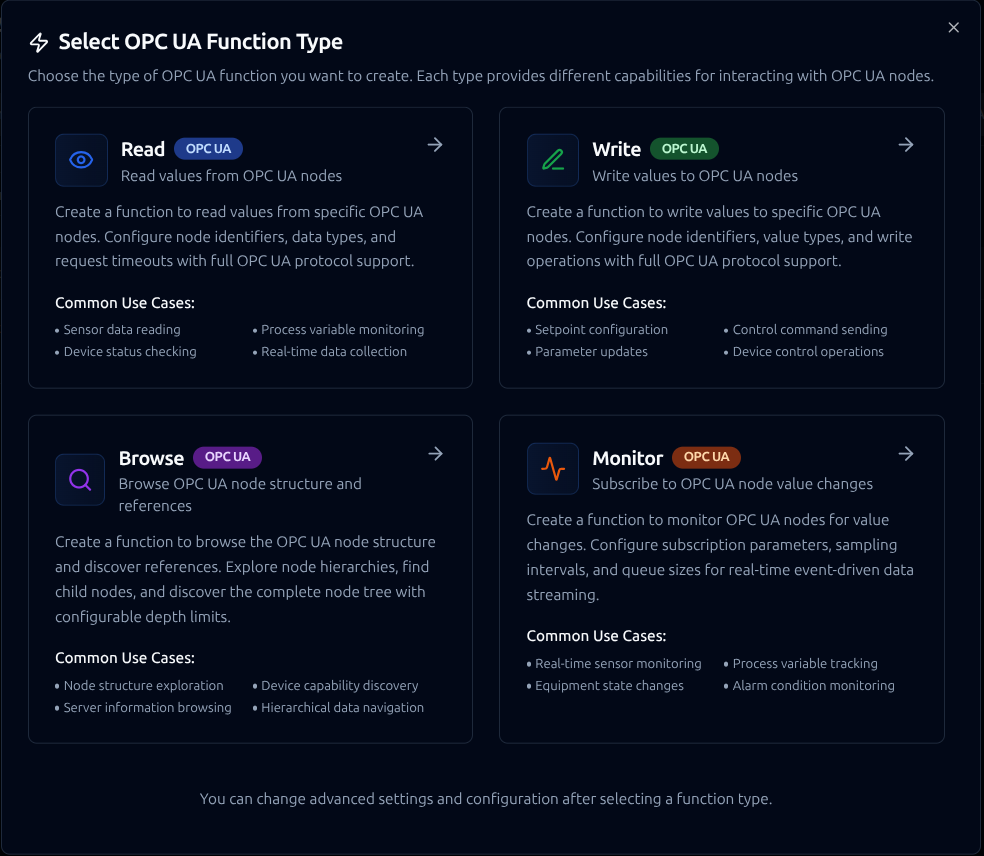
Create reusable read, write, browse, and monitor operations for OPC UA assets
Quick Add: Bulk Function Creation
When you need to create multiple OPC UA functions at once, the Quick Add feature accelerates the setup process by allowing batch creation from a table or CSV import.
When to Use Quick Add
- Onboarding a new OPC UA server with many nodes to monitor
- Converting existing node lists from spreadsheets or server documentation
- Rapidly setting up data collection for multiple process variables
- Standardizing function definitions across similar OPC UA devices
How to Use Quick Add
- Navigate to your OPC UA connection in Connections
- Click Quick Add Functions button
- Choose your input method:
- Table Entry: Define functions row by row in the interface
- CSV Import: Upload a prepared CSV file with node definitions
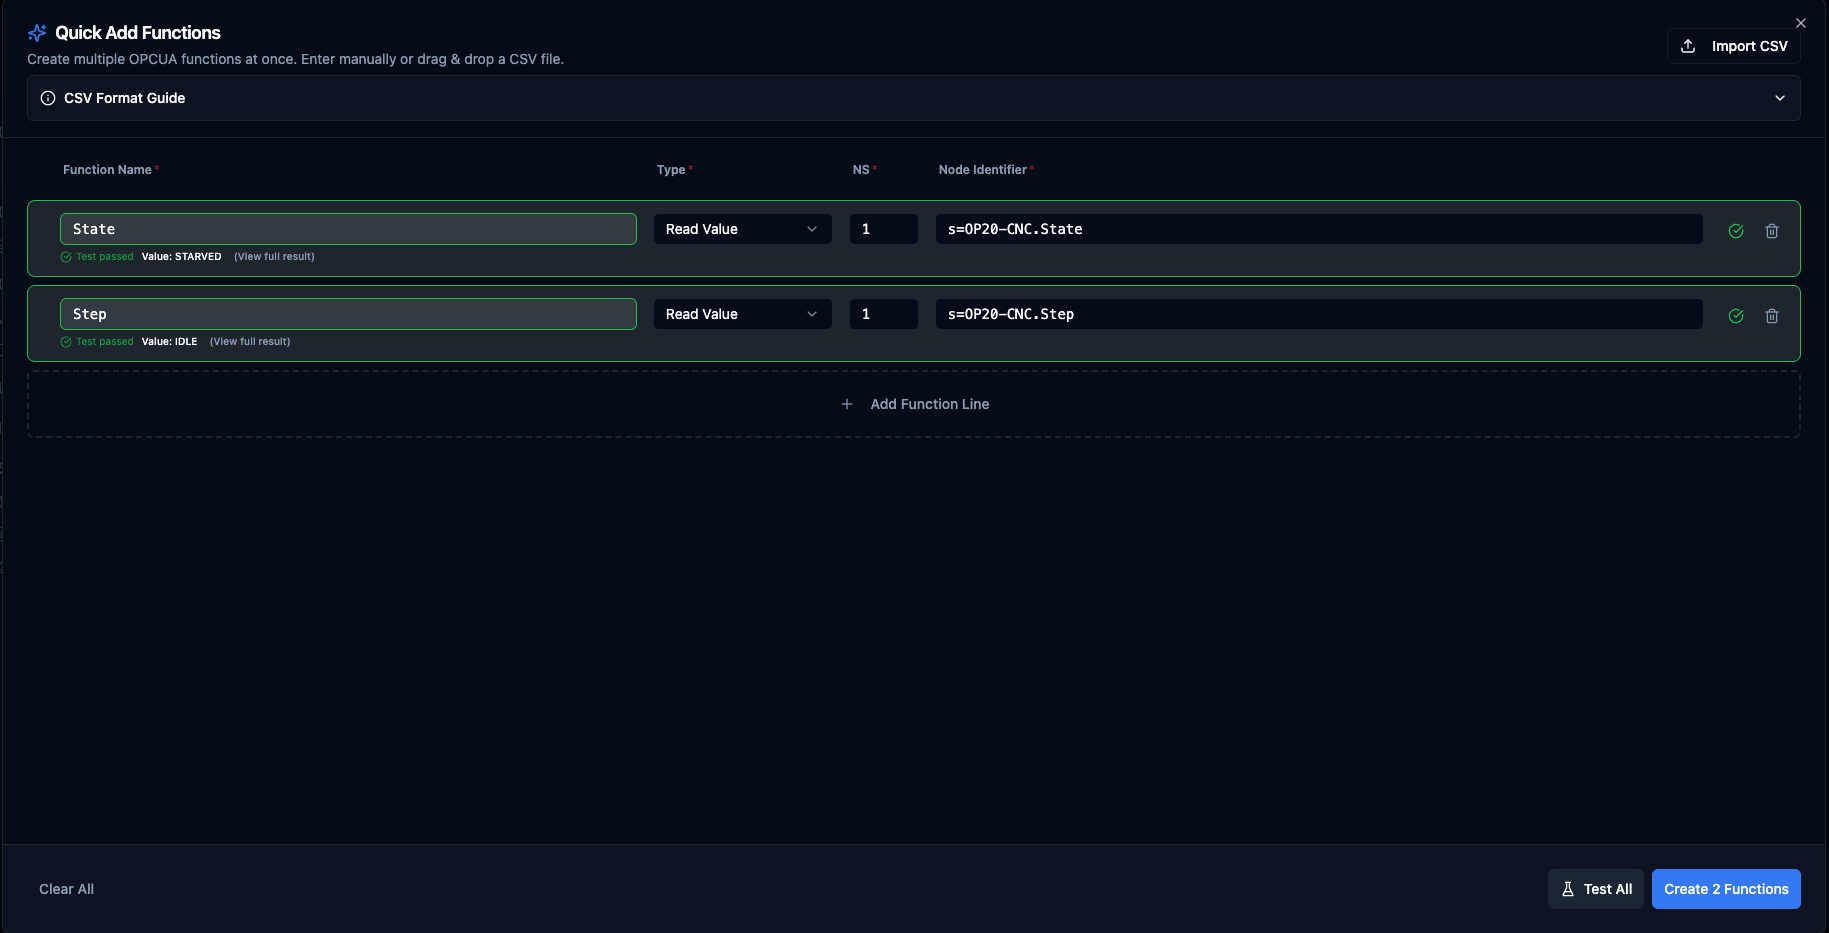
Quick Add Functions dialog for OPC UA with table entry and CSV import options
Table Columns
| Column | Required For | Description | Example |
|---|---|---|---|
| Function Name | All | Unique name for the function within this connection | ReactorTemperature |
| Type | All | OPC UA operation | opcua.read, opcua.write, opcua.browse |
| NS | All | Namespace index (0-65535) | 2 |
| Node Identifier | All | OPC UA node ID with type prefix, or a ((parameter)) template | s=Sensors.Temp01 |
| Data Type | Writes only | OPC UA data type used to coerce the value before sending | Int32, Double, Boolean, String |
| Value | Writes only | Literal value or ((paramName)) template substituted at run-time | 1500, ((targetTemp)) |
| Labels | Optional, all | Per-function tags for filtering and grouping. Click the Labels button to edit; the badge shows the current count. In CSV use key=value;key=value. Up to 10 labels per function. | area=reactor;env=prod |
Read and Browse rows ignore the Data Type and Value columns — leave them blank. Write rows require both.
Supported Function Types
opcua.read(Read Value): Read current value from an OPC UA nodeopcua.write(Write Value): Write a value to an OPC UA nodeopcua.browse(Browse Nodes): Explore the node structure and discover child nodes- Monitor Nodes: Subscribe to value changes for real-time notifications — Monitor functions are created via the full Function Builder, not Quick Add, because they configure many per-node parameters (sampling interval, queue size, discard policy) that wouldn't fit the table model.
Node Identifier Formats
OPC UA node identifiers must include a type prefix:
i=123— Numeric identifier (e.g.,i=2253for ServerStatus)s=StringId— String identifier (e.g.,s=Device.Sensor.Temperature)g=550e8400-e29b-41d4-a716-446655440000— GUID identifierb=SGVsbG8gV29ybGQ=— Byte string (Base64 encoded)
You can also use a ((parameter)) template inside the identifier (for example s=Devices.((deviceId)).Temp or fully ((nodeRef))); the parameter is resolved at run-time.
Writable Data Types
For write rows, the Data Type must be one of the OPC UA primitive types the backend can coerce values into:
Boolean, SByte, Byte, Int16, UInt16, Int32, UInt32, Int64, UInt64, Float, Double, String
Values are sent as strings — the backend parses them with the chosen type's coercion rules (e.g. Int32 rejects non-integer or out-of-range values; Boolean accepts true/false/1/0).
CSV Import Format
The CSV header must match the column keys exactly. Note: functionType — not type.
The labels column is optional. Pairs are separated by ; and each pair uses key=value. The first = per pair is the delimiter so values can contain =. Label values cannot contain a literal ; in CSV — use the popover editor when you need that.
name,functionType,namespaceIndex,identifier,dataType,value,labels
ReactorTemperature,opcua.read,2,s=Sensors.Temp01,,,area=reactor;env=prod
PressureSensor,opcua.read,2,i=1001,,,area=reactor
DeviceStatus,opcua.read,2,s=Device.Status,,,
SetMotorSpeed,opcua.write,2,s=Controls.MotorSpeed,Int32,1500,team=automation
SetPointFromParam,opcua.write,2,s=Controls.SetPoint,Double,((targetTemp)),team=automation;priority=high
EnableHeater,opcua.write,2,s=Controls.HeaterEnable,Boolean,true,team=automation
BrowseObjects,opcua.browse,0,i=85,,,
Files exported from Excel-on-Windows (with a UTF-8 BOM) are accepted — the BOM is stripped automatically. Quoted fields, escaped quotes (""), and CRLF line endings follow RFC 4180.
Use the Example CSV button in the Quick Add dialog header to download a starter template with these exact columns, or Copy / Download inside the CSV Format Guide pane.
Validation Rules
- Function names must be unique within the connection (duplicates within a single Quick Add batch are auto-suffixed
_2,_3, …). - Namespace index is required and must be 0-65535 (typically 0 for standard nodes, 2+ for custom nodes).
- Node identifier must use a type prefix (
i=,s=,g=,b=) or contain a((parameter))template. - For write rows: Data Type and Value are both required, and Data Type must be one of the writable types above.
- Labels are optional. Each label needs a non-empty key and value; keys must be unique within a row; up to 10 labels per function.
- Validation runs before Test All and Create — errors surface inline on each row, with no HTTP traffic, so what you test is exactly what gets submitted.
Test All vs Submit
Both Test All and Create N Functions build their request payload from the same row-to-wire-format builder. A row that passes Test All will not be rejected at submit for a shape reason. Backend errors (permissions, server-side type mismatch, unreachable node) surface in the toast and on the failing row so you can fix and retry without re-typing every other row.
Best Practices
- Use meaningful function names that match your process or equipment hierarchy.
- Use the Browse function on a small scope first to discover the namespace and exact identifiers before creating read/write functions in bulk.
- Keep namespace indexes consistent across related nodes.
- Test a small batch with Test All before importing thousands of rows — backend-side per-node errors are easier to triage in small batches.
- For repeating write workflows, set the value to
((paramName))and configure the parameter once in the full form rather than creating one function per literal value.
Read Function
Purpose: Read values from specific OPC UA nodes. Configure node identifiers, data types, and request timeouts with full OPC UA protocol support for real-time data collection.
Configuration Fields
| Field | Type | Required | Default | Description |
|---|---|---|---|---|
| Namespace Index | Number | Yes | - | OPC UA namespace index (0-65535) |
| Node Identifier | String | Yes | - | OPC UA node identifier with type prefix. Examples: i=123 (numeric), s=StringId (string), g=550e8400-e29b-41d4-a716-446655440000 (GUID), b=SGVsbG8gV29ybGQ= (byte string) |
| Request Timeout (seconds) | Number | No | 5 | Maximum time to wait for server response (1-60 seconds) |
Use Cases: Sensor data reading, process variable monitoring, device status checking, real-time data collection
Write Function
Purpose: Write values to specific OPC UA nodes. Configure node identifiers, value types, and write operations with full OPC UA protocol support for control operations.
Configuration Fields
| Field | Type | Required | Default | Description |
|---|---|---|---|---|
| Namespace Index | Number | Yes | - | OPC UA namespace index (0-65535) |
| Node Identifier | String | Yes | - | OPC UA node identifier with type prefix. Examples: i=123 (numeric), s=StringId (string), g=550e8400-e29b-41d4-a716-446655440000 (GUID), b=SGVsbG8gV29ybGQ= (byte string) |
| Value to Write | Object | Yes | - | Value to write to the OPC UA node (supports parameters). Example: {"temperature": ((value)), "timestamp": "((now))"} |
| Request Timeout (seconds) | Number | No | 5 | Maximum time to wait for server response (1-60 seconds) |
Use Cases: Setpoint configuration, control command sending, parameter updates, device control operations
Browse Function
Purpose: Browse the OPC UA node structure and discover references. Explore node hierarchies, find child nodes, and discover the complete node tree with configurable depth limits.
Configuration Fields
| Field | Type | Required | Default | Description |
|---|---|---|---|---|
| Namespace Index | Number | Yes | 0 | OPC UA namespace index (0-65535) |
| Node Identifier | String | Yes | - | OPC UA node identifier to browse. Examples: i=84 (Root folder - standard root node), i=85 (Server object), i=2253 (ServerStatus), s=MyCustomNode (string identifier) |
| Request Timeout (seconds) | Number | No | 10 | Maximum time to wait for server response (1-60 seconds) |
Use Cases: Node structure exploration, device capability discovery, server information browsing, hierarchical data navigation
Monitor Function
Purpose: Subscribe to OPC UA node value changes and receive real-time notifications. Unlike read operations that poll for data, monitor functions establish continuous subscriptions that push updates when values change—enabling event-driven automation without constant polling.
Monitor functions are designed for use as pipeline triggers. When configured, incoming value changes automatically start pipeline executions. See OPC UA Trigger Node for pipeline integration details.
How Monitoring Works
OPC UA monitoring follows a structured workflow:
- MaestroHub creates a Subscription on the OPC UA server with a defined publishing interval
- One or more Monitored Items are registered for specific nodes
- The server samples each node at its configured sampling interval
- When values change, the server queues notifications and publishes them to MaestroHub
- MaestroHub receives notifications and triggers pipeline executions
- Subscriptions remain active until explicitly stopped or the connection ends
This push-based model is optimized for low-latency, continuous telemetry and is essential in industrial environments where many node values change frequently.
Configuration Fields
Monitor function configuration is defined at two levels: subscription parameters that control publishing behavior, and node parameters that define how each node is sampled.
Subscription Parameters
| Field | Type | Required | Default | Description |
|---|---|---|---|---|
| Publishing Interval (ms) | Number | No | 100 | Interval in milliseconds at which the subscription publishes notifications to MaestroHub. Lower values provide faster updates but increase network traffic. |
| Priority | Number | No | 0 | Subscription priority (0–255). When multiple subscriptions have pending notifications, higher priority subscriptions are serviced first. Use 0 if no special priority is needed. |
Monitored Nodes
Add one or more nodes to monitor. Each node can have individual sampling settings:
| Field | Type | Required | Default | Description |
|---|---|---|---|---|
| Namespace Index | Number | Yes | - | OPC UA namespace index (0-65535) |
| Node Identifier | String | Yes | - | OPC UA node identifier with type prefix: i=123 (numeric), s=MotorSpeed (string), g=550e8400-e29b-41d4-a716-446655440000 (GUID), b=SGVsbG8= (byte string) |
| Sampling Interval (ms) | Number | No | 0 | How often the server samples this node. 0 = fastest practical rate, -1 = use publishing interval as sampling interval. |
| Queue Size | Number | No | 10 | Maximum notifications to buffer for this node (1–1000). Larger queues prevent data loss during bursts but use more memory. |
| Discard Oldest | Boolean | No | true | When the queue is full: true = discard oldest notification and add new one, false = replace the newest notification. |
Example Configuration
{
  "publishingInterval": 100,
  "priority": 0,
  "nodes": [
    {
      "namespaceIndex": 2,
      "identifier": "i=123",
      "samplingInterval": 0,
      "queueSize": 10,
      "discardOldest": true
    },
    {
      "namespaceIndex": 2,
      "identifier": "s=MotorSpeed",
      "samplingInterval": 50,
      "queueSize": 5,
      "discardOldest": true
    },
    {
      "namespaceIndex": 3,
      "identifier": "s=Temperature",
      "samplingInterval": 100,
      "queueSize": 20,
      "discardOldest": false
    }
  ]
}
This configuration creates a subscription with a 100ms publishing interval, monitoring three nodes—each with its own sampling interval, queue size, and discard policy.
Output Data Format
When a monitored node value changes, MaestroHub receives a notification with the following structure:
{
  "value": 23.5,
  "nodeId": "ns=2;i=123",
  "namespaceIndex": 2,
  "identifier": "i=123",
  "sourceTimestamp": "2024-01-15T10:30:00.000Z",
  "serverTimestamp": "2024-01-15T10:30:00.001Z",
  "statusCode": "Good"
}
| Field | Description |
|---|---|
value | The current value of the monitored node |
nodeId | Full OPC UA node identifier |
namespaceIndex | Namespace index of the node |
identifier | Node identifier string |
sourceTimestamp | Timestamp when the value was sampled at the source |
serverTimestamp | Timestamp when the server processed the notification |
statusCode | OPC UA status code indicating data quality |
Reconnection Behavior
MaestroHub automatically handles connection disruptions to ensure monitoring continuity:
| Scenario | Behavior |
|---|---|
| Connection lost | System detects disconnection and queues pending operations |
| Connection restored | Subscriptions and monitored items are automatically recreated |
| Session timeout | New session established with all monitors restored |
| MaestroHub restart | All monitors for enabled pipelines are restored on startup |
No manual intervention is required—monitoring continues seamlessly after transient failures.
Best Practices
Sampling and Publishing Intervals
- Set
publishingIntervalbased on how quickly you need to react to changes (100–1000ms is typical) - Set
samplingIntervalequal to or faster thanpublishingIntervalto avoid missing changes - Use
samplingInterval: 0for critical nodes that need the fastest possible updates
Queue Size Selection
- Use smaller queues (1–10) for real-time dashboards where only the latest value matters
- Use larger queues (20–100) for data logging where every change must be captured
- Enable
discardOldest: trueto always see the most recent values
Node Selection
- Group related nodes (e.g., sensors on the same machine) into a single monitor function
- Create separate monitor functions for nodes with different criticality or update requirements
- Use the Address Space Browser to discover available nodes before configuring monitors
Use Cases: Real-time equipment monitoring, process variable tracking, alarm condition detection, production event streaming, quality metric collection
Using Parameters
Parameters follow the ((parameterName)) syntax and appear in the function editor panel.
| Configuration | Description | Example |
|---|---|---|
| Type | Coerce runtime values into OPC UA data types | number, string, boolean, datetime, buffer |
| Required | Enforce presence of the parameter | Required / Optional |
| Default Value | Provide fallback values for unattended runs | 0, false, NOW() |
| Description | Help field to capture node purpose | "Target furnace temperature in °C" |
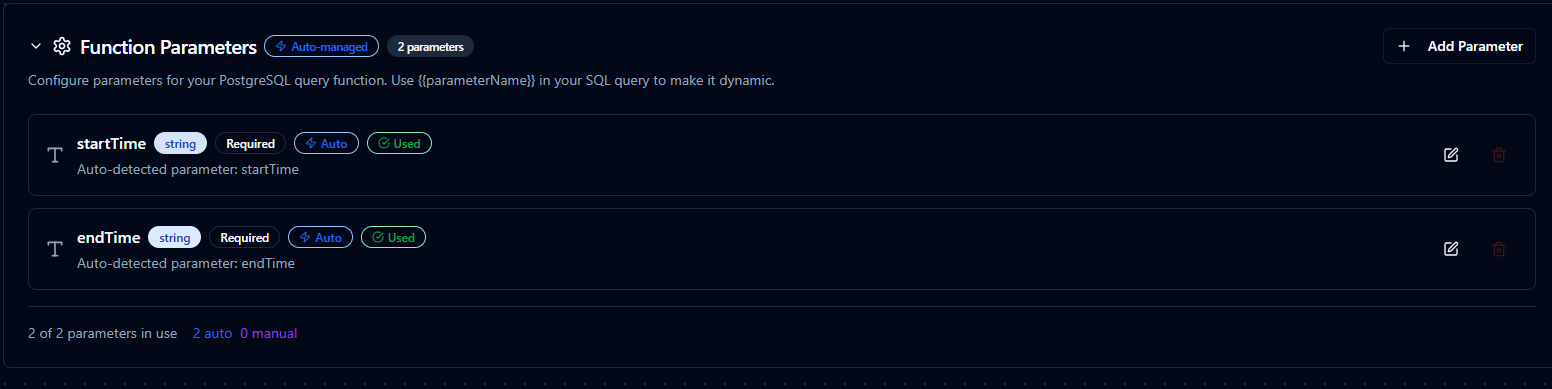
Configure parameter validation, defaults, and descriptions for OPC UA calls
Pipeline Integration
Use the OPC UA connection functions you create here as nodes inside the Pipeline Designer to coordinate machine data with the rest of your production flow.
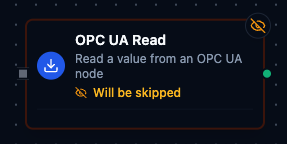
Connector Nodes
Drag in the read, write, or browse node, bind its parameters to upstream outputs or constants, and tune retries or error branches so operators get the right context at the right moment.
If you are planning broader orchestration, review the Connector Nodes page for guidance on where OPC UA nodes fit within multi-system automation patterns.
Trigger Nodes
Use OPC UA Monitor functions as pipeline triggers to start executions automatically when node values change. The OPC UA Trigger Node enables fully event-driven automation—no polling required.
When to use triggers vs. connector nodes:
| Approach | Use Case |
|---|---|
| OPC UA Trigger | Start pipelines when specific node values change (event-driven) |
| OPC UA Read Node | Read values within an already-running pipeline (request-response) |
OPC UA node with function selection, connection, and parameter bindings
Common Use Cases
Event-Driven Equipment Monitoring
Subscribe to temperature, vibration, or energy tags using Monitor functions and automatically trigger pipelines when values change. Forward updates to MQTT, REST, or historian targets for real-time central visibility without polling overhead.
Real-Time Alarm Processing
Monitor alarm condition nodes and trigger immediate notifications or corrective actions when alarms activate. Capture alarm timestamps, acknowledge states, and operator responses in a complete audit trail.
Production Event Streaming
Stream production counters, cycle times, and quality metrics to analytics platforms as they change. Use subscriptions to capture every value change for accurate OEE calculations and trend analysis.
Command and Control
Trigger setpoint updates, mode changes, or alarm acknowledgements based on business rules or operator actions, with MaestroHub logging command details, operators, and timestamps for complete audit trails.