Connect - Universal Data Collection
Connect is your gateway to bringing data from any source into MaestroHub. Whether you're working with industrial PLCs, IoT sensors, enterprise databases, or cloud services, Connect provides pre-built connectors that eliminate the complexity of integration.
Why Connect?
Traditional industrial integrations require custom development, protocol expertise, and ongoing maintenance. Connect changes this by offering:
- No-code configuration – Set up connections through an intuitive interface without writing code
- Native protocol support – Built-in connectors for the most common industrial and enterprise systems
- Secure by default – TLS encryption, authentication, and credential management built-in
- Reusable configurations – Create connection profiles once, use them across multiple pipelines
- Built for operations: connectors with health checks, reconnects, and per-connection status
How Connect Works
Connect operates through three key concepts:
1. Connection Profiles
Define how to reach a system – broker URLs, database credentials, protocol settings. Create once, reuse everywhere.
2. Functions
Define what data to read or write – tag subscriptions, SQL queries, MQTT topics. These are reusable building blocks you configure per connection.
3. Pipeline Integration
Use your functions in Orchestrate pipelines to trigger data collection, transform results, and route data to its destination.
Connection Statuses
Every connection profile has a runtime state that reflects its current condition. Understanding these statuses helps you monitor and troubleshoot your integrations.
| Status | Description |
|---|---|
| Idle | The connection is registered but not actively running. This is the initial state before a connection is started, or after it has been manually stopped. |
| Connecting | The connection is in the process of establishing communication with the target system. |
| Connected | The connection is active and healthy. Data collection and function execution are fully operational. |
| Disconnected | The connection has lost communication with the target system. MaestroHub will automatically attempt to reconnect. |
| Reconnecting | An automatic reconnection attempt is in progress after a disconnection. |
| Failed | Reconnection has kept failing: the circuit breaker has tripped three times in a row. MaestroHub keeps retrying, paced by the circuit breaker, and the first successful attempt returns the connection to Connected. Check that the target system is running and reachable; you do not need to restart the connection. |
| Suspended | The connection has been intentionally paused by an operator. No data collection or reconnection attempts occur while suspended. See Connection Suspension below. |
What a Lost Connection Writes
When a connection leaves Connected for Disconnected, Reconnecting or Failed, every subscribed function it was delivering replays its last known value once as a sample marked quality bad with reason comm_error — the OPC convention: last value, Bad. The sample takes the same path a device reading takes, so a pipeline publishing from that trigger stores it as bad · comm_error at the moment the link dropped, charts show the outage where it happened, quality-based alerts fire, and an onChange trigger fires for it even though the value itself did not change (a change of verdict is a change). The receiver stamps the disconnect time; the device's own timestamps are not replayed. A function that never delivered a value has nothing to replay and stays silent. Suspending or stopping a connection is intentional and writes nothing.
Connection Suspension
Suspension allows operators to intentionally pause a connection without deleting or reconfiguring it. This is useful during planned maintenance windows, infrastructure changes, or when you need to temporarily stop data collection from a specific source.
When you suspend a connection:
- All active communication is gracefully stopped
- Automatic reconnection is disabled
- A suspension reason is recorded for audit purposes
- Functions targeting the suspended connection will not execute
To resume a suspended connection, use the Resume action. Resume resets the circuit breaker and reconnection backoff and starts the connection straight away. While the organization is in maintenance mode, Resume is refused; the connections that maintenance suspended resume on their own when it ends.
Connection Status History
MaestroHub records every state transition for each connection, building a complete audit trail of connection health over time. The Connection Health dashboard provides:
- Status Timeline — A visual bar showing how the connection spent its time across different states over a selected period
- State Change Events — A chronological list of every status transition, including error messages and suspension reasons
- Uptime Statistics — Calculated uptime percentage, failure counts, and average recovery times
- Failure Tracking — Connections with the most failures are highlighted so you can prioritize remediation
You can access status history from the Health tab on any connection profile, or view the system-wide Connection Health page for an overview of all connections.
Scaling
Every connection form has a Scaling tab, available once the connection has been saved. It sets Desired replicas: how many MaestroHub replicas run this connection in parallel, each owning one slot and sharing the load. If the cluster has fewer live replicas than you ask for, the extra slots show as pending until more replicas join.
The value is read-only, and the tab shows the reason, in these cases:
- single-binary – Multi-replica scaling needs a microservices deployment. A single-binary deployment runs each connection on one instance.
- protocol-locked – The protocol always runs on a single replica (for example Siemens S7, OPC UA, Modbus and MQTT 3.1.1), or it uses a single slot, where every replica uses the connection on its own and a value above 1 has no effect (for example REST, SMTP and Azure Blob).
Changing the value requires the connection:update permission.

Scaling tab on a single-binary deployment: one replica, read-only, with the reason shown
Subscriptions
Connect → Subscriptions lists the live data feeds your pipelines keep open. A subscription exists while an enabled pipeline uses a subscribe function (MQTT, Sparkplug B, Redis and similar) as its trigger. Use it to find out why MaestroHub is subscribed to a device or broker.
| Column | Shows |
|---|---|
| Connection | The connection the feed runs on. |
| Function | The subscribe function and its type. If the function was deleted, the row says so: the pipeline asks for a feed that can never start until you change it. |
| Demanded by | The enabled pipelines that use this feed. Each one links to the Pipeline Designer. |
| State | The connection's current state, and the number of replicas running it when there is more than one. |
There is no cancel button. MaestroHub keeps the subscriptions in line with your enabled pipelines, so a cancelled feed would come straight back. To stop a feed, disable the pipelines listed under Demanded by. Search filters by connection, function or pipeline name, and the list refreshes every 30 seconds.
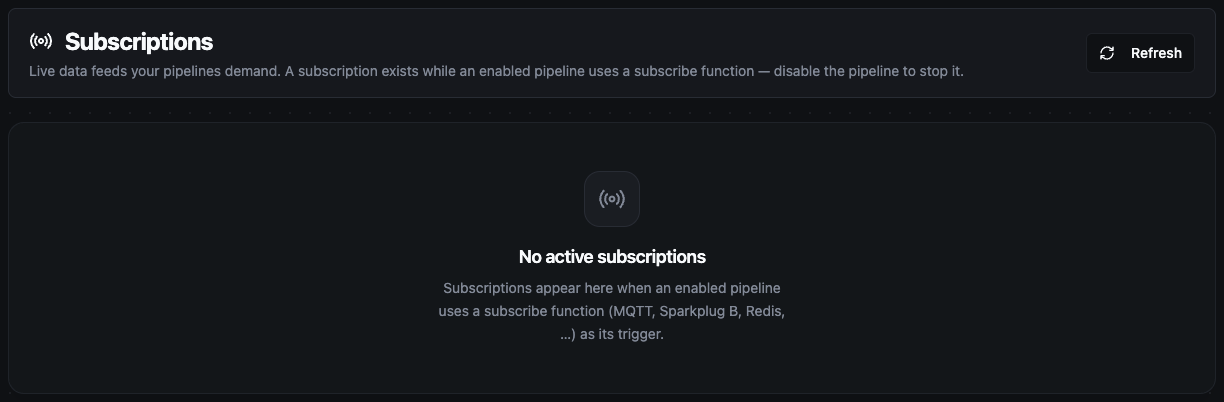
Connect → Subscriptions with no enabled pipeline holding a feed open
Network Diagnostics
Network Diagnostics, on the Connections page, checks whether the MaestroHub server can reach a host and port. Use it to tell a network problem (firewall, routing, DNS, the device being down) from a connector that is misconfigured: if the test fails, fix the network first; if it succeeds but the connection does not, check the connection's settings and credentials.
- Single Test – Enter an IP Address or Hostname, a Port (default 80), a Protocol (TCP or UDP) and a Timeout (seconds) (default 5), then select Test Connection.
- Batch Test – Add several hosts, each with its own port, protocol and timeout, and select Test All Hosts. The hosts are tested in parallel, and a summary shows how many succeeded and failed.
Each result shows the host and port, the resolved IP address, a success or failure message, the protocol, the time of the test and, on success, the latency. For a hostname that cannot be resolved, the result says so. A UDP test sends nothing to the target, because UDP has no handshake: a success means the host name resolved, not that anything is listening on the port.
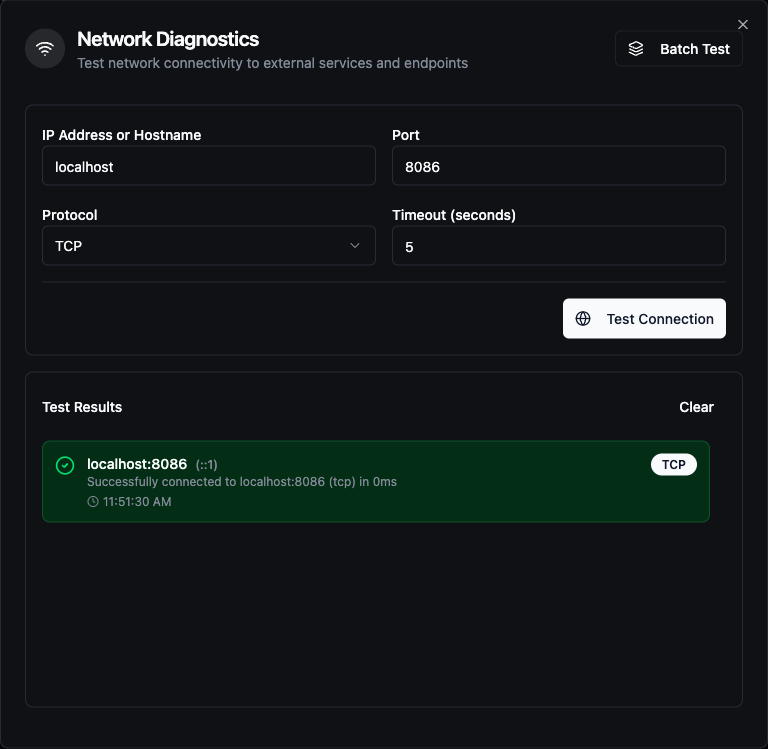
Single Test with a successful TCP result
Running a test requires the connection:test permission, and every test a person runs is recorded in the audit log.
Getting Started
Choose the connector that matches your data source:
- Browse the connector documentation to understand capabilities
- Create a connection profile with your system's credentials
- Define functions to specify what data to collect
- Build pipelines in Orchestrate to put your data to work
Each connector guide includes detailed configuration references, security best practices, and real-world examples to help you get up and running quickly.
Once you've connected your data sources, explore Schemas to give your UNS topics typed, validated data contracts, or jump straight into Orchestrate to build your first data pipeline.