 InfluxDB Integration Guide
Connect to InfluxDB to read and write time-series data in your pipelines. This guide covers connection setup, function configuration, and pipeline integration for InfluxDB 2.x deployments.
Overview
The InfluxDB connector enables integration with InfluxDB time-series databases, commonly used for storing metrics, telemetry, IoT data, and industrial signals. It provides:
- Flux query support for flexible time-series data retrieval with filtering and aggregation
- Line Protocol writes for efficient data ingestion with measurements, tags, and typed fields
- Secure token authentication with TLS/HTTPS support and custom CA certificates
- Batching and retry controls for reliable high-throughput data operations
- Template parameters for dynamic queries and writes based on runtime input
This connector is optimized for InfluxDB 2.x with its bucket/organization model and Flux query language. Support for InfluxDB 1.x and 3.x is planned for future releases.
Connection Configuration
Creating an InfluxDB Connection
Navigate to Connections → New Connection → InfluxDB and configure the following:
InfluxDB Connection Creation Fields
1. Profile Information
| Field | Default | Description |
|---|---|---|
| Profile Name | - | A descriptive name for this connection profile (required, max 100 characters) |
| Description | - | Optional description for this InfluxDB connection |
2. Connection Settings
| Field | Default | Description |
|---|---|---|
| Server URL | - | InfluxDB server URL (e.g., http://localhost:8086 or https://us-east-1-1.aws.cloud2.influxdata.com) – required |
| Organization | - | InfluxDB organization name – required |
| HTTP Request Timeout (sec) | 20 | Timeout for HTTP requests to InfluxDB (1-300 seconds) |
3. Authentication
| Field | Default | Description |
|---|---|---|
| Auth Token | - | API token for authentication – required. Masked on edit; leave empty to keep stored value |
4. TLS/Security Settings
| Field | Default | Description |
|---|---|---|
| CA Certificate | - | Custom CA certificate in PEM format for server validation |
| Skip Verify | false | Skip server certificate verification (use only for development/testing) |
Enabling Skip Verify disables TLS certificate validation. Use only in trusted development environments, never in production.
5. Batching Settings
| Field | Default | Description |
|---|---|---|
| Use GZip | false | Enable GZip compression for write requests to reduce bandwidth |
| Batch Size | 5000 | Maximum number of points per write batch (1-100,000) |
| Flush Interval (ms) | 1000 | Maximum time before flushing buffered points (100-60,000 ms) |
| Precision | ns | Timestamp precision for writes: ns (nanoseconds), us (microseconds), ms (milliseconds), or s (seconds) |
6. Retry Configuration
| Field | Default | Description |
|---|---|---|
| Max Retries | 5 | Maximum retry attempts for failed requests (0-20, 0 = disable retries) |
| Retry Interval (ms) | 5000 | Initial delay between retry attempts (100-60,000 ms) |
| Max Retry Interval (ms) | 125000 | Maximum delay cap for exponential backoff (1,000-300,000 ms) |
| Max Retry Time (ms) | 180000 | Total time limit for all retry attempts (1,000-600,000 ms) |
| Retry Buffer Limit | 50000 | Maximum points to buffer for retry (1,000-1,000,000) |
7. Advanced Settings
| Field | Default | Description |
|---|---|---|
| Default Tags | - | Key-value pairs automatically added to all written data points (max 10 tags) |
Example Default Tags
environment: productionsource: maestrohubsite: factory-1
8. Connection Labels
| Field | Default | Description |
|---|---|---|
| Labels | - | Key-value pairs to categorize and organize this InfluxDB connection (max 10 labels) |
Example Labels
env: prod– Environmentteam: data-platform– Responsible teamregion: us-east-1– Deployment region
- Required Fields: Server URL, Organization, and Auth Token must be provided.
- Authentication: InfluxDB 2.x uses token-based authentication. Generate tokens in the InfluxDB UI under Load Data → API Tokens.
- Batching: The connector buffers write points and flushes them based on Batch Size or Flush Interval, whichever is reached first. This improves throughput for high-frequency writes.
- Retry Logic: Implements exponential backoff for transient failures. The delay doubles after each retry up to Max Retry Interval.
- Default Tags: Useful for adding consistent metadata (e.g., source system, environment) to all data points without modifying individual writes.
Function Builder
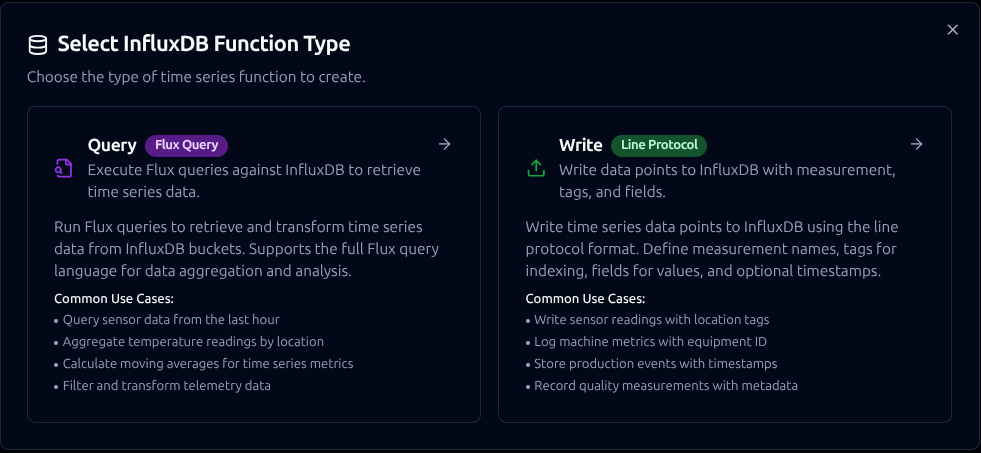
Creating InfluxDB Functions
Once you have a connection established, you can create reusable query and write functions:
- Navigate to Functions → New Function
- Select InfluxDB Query or InfluxDB Write as the function type
- Choose your InfluxDB connection
- Configure the function parameters
Design reusable InfluxDB Query and Write functions with Flux queries, field definitions, and parameter configuration
Query Function
Purpose: Execute Flux queries against InfluxDB to retrieve time-series data. Use this for reading metrics, aggregating data, and filtering by time range or tags.
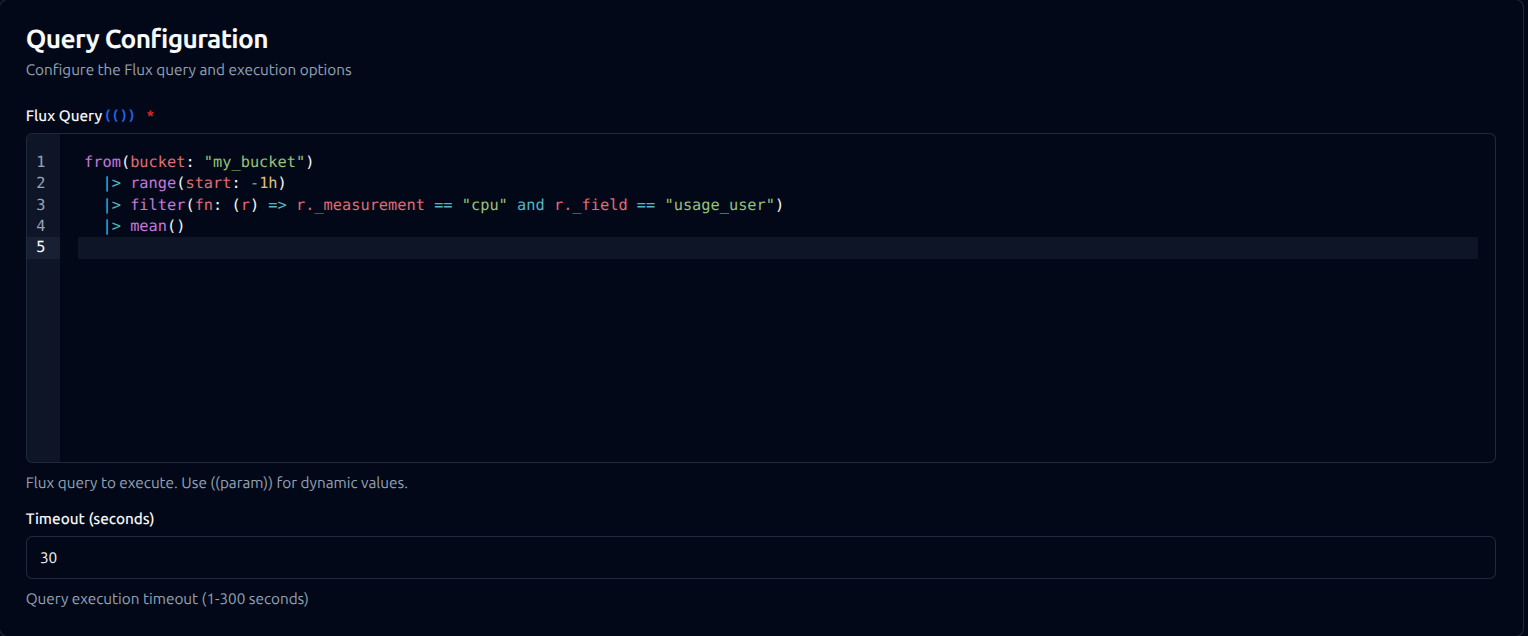
Query function configuration with Flux query editor and timeout settings
Configuration Fields
| Field | Type | Required | Default | Description |
|---|---|---|---|---|
| Flux Query | String | Yes | - | Flux query to execute. Supports template parameters using ((paramName)) syntax. |
| Timeout (seconds) | Number | No | 30 | Query execution timeout (1-300 seconds) |
Example Flux Queries
// Retrieve temperature readings from the last hour
from(bucket: "sensors")
  |> range(start: -1h)
  |> filter(fn: (r) => r._measurement == "temperature")
  |> filter(fn: (r) => r.location == "factory-1")
// Calculate hourly averages for the past 24 hours
from(bucket: "metrics")
  |> range(start: -24h)
  |> filter(fn: (r) => r._measurement == "cpu_usage")
  |> aggregateWindow(every: 1h, fn: mean)
  |> yield(name: "hourly_avg")
// Query with template parameters
from(bucket: "((bucket))")
  |> range(start: ((startTime)), stop: ((endTime)))
  |> filter(fn: (r) => r._measurement == "((measurement))")
  |> filter(fn: (r) => r.asset_id == "((assetId))")
Response Format
{
  "success": true,
  "records": [
    {"_time": "2024-01-15T10:00:00Z", "_value": 23.5, "location": "factory-1"},
    {"_time": "2024-01-15T10:01:00Z", "_value": 23.7, "location": "factory-1"}
  ],
  "recordCount": 2,
  "organization": "my-org"
}
Use Cases:
- Retrieve sensor readings for dashboards and analytics
- Calculate aggregates (mean, max, min) over time windows
- Filter and export historical data for reporting
- Monitor equipment metrics with tag-based filtering
Write Function
Purpose: Write data points to InfluxDB using Line Protocol format. Supports explicit field type selection to ensure correct data types are stored.
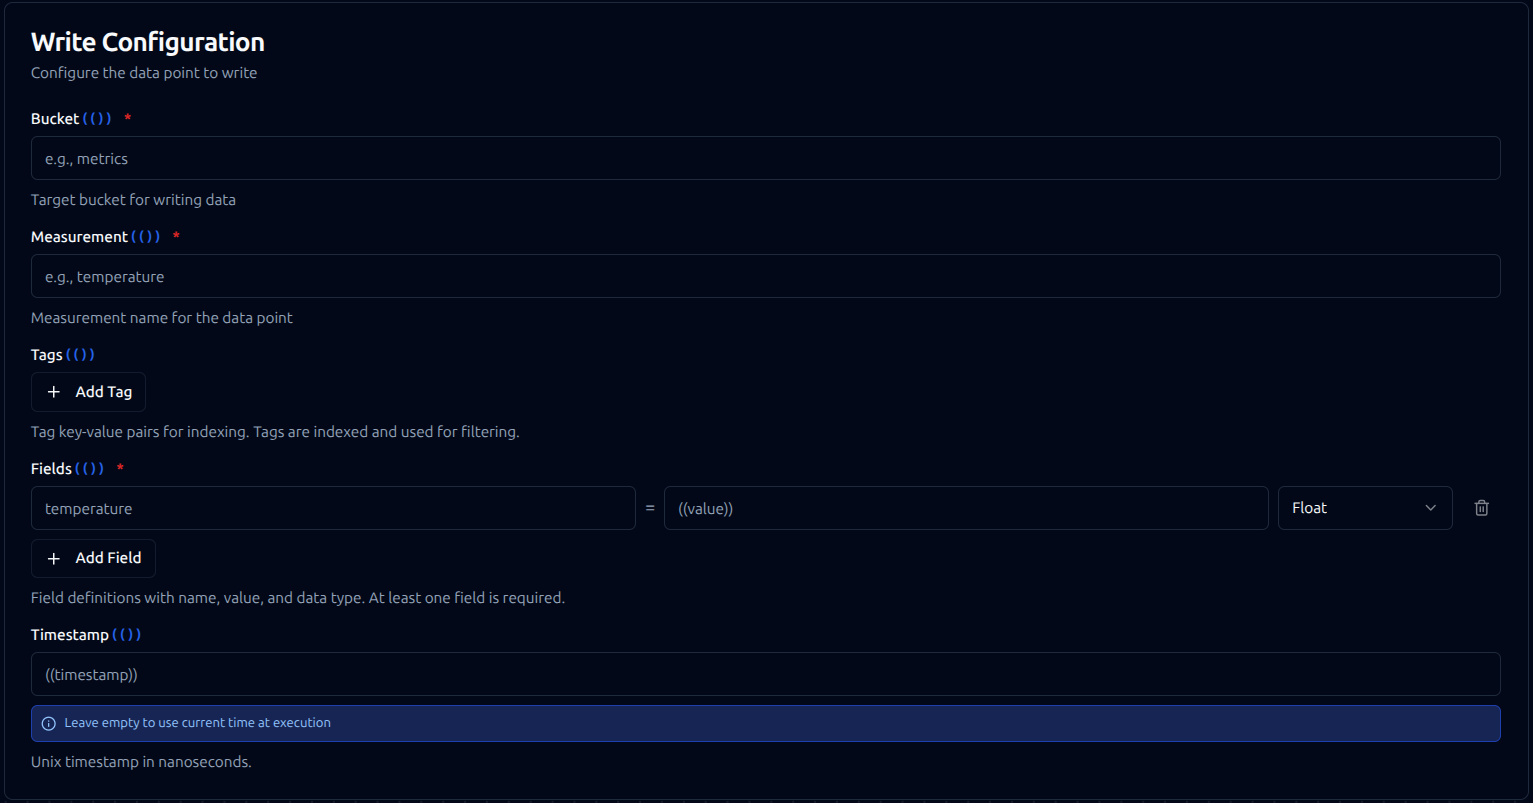
Write function configuration with bucket, measurement, tags, fields, and timestamp settings
Configuration Fields
| Field | Type | Required | Default | Description |
|---|---|---|---|---|
| Bucket | String | Yes | - | Target bucket for writing data. Supports template parameters. |
| Measurement | String | Yes | - | Measurement name for the data point (similar to a table name). Supports template parameters. |
| Tags | Object | No | {} | Key-value pairs for indexed dimensions used in filtering and grouping. Tag values are always strings. |
| Fields | Array | Yes | - | Array of field definitions with name, value, and type. At least one field is required. |
| Timestamp | String/Number | No | current time | Unix timestamp in nanoseconds. Supports template parameters. If empty, uses current time at execution. |
Field Definition Structure
Each field in the Fields array must contain:
| Property | Type | Required | Description |
|---|---|---|---|
| name | String | Yes | Field name. Supports template parameters. |
| value | String | Yes | Field value. Supports template parameters (e.g., ((temperature))). |
| type | Enum | Yes | Data type for the field value. |
Supported Field Types
| Type | Description | Example Values |
|---|---|---|
float | 64-bit floating point number | 25.5, 3.14159, -10.0 |
integer | 64-bit signed integer | 100, -50, 0 |
uinteger | 64-bit unsigned integer | 100, 0 (no negative values) |
boolean | Boolean value | true, false |
string | UTF-8 string | "active", "sensor-01" |
Example Configuration
{
  "bucket": "sensors",
  "measurement": "temperature",
  "tags": {
    "location": "factory-1",
    "sensor_id": "temp-001",
    "line": "assembly-a"
  },
  "fields": [
    { "name": "value", "value": "((temperature))", "type": "float" },
    { "name": "humidity", "value": "((humidity))", "type": "float" },
    { "name": "status", "value": "active", "type": "string" }
  ],
  "timestamp": "((timestamp))"
}
Response Format
{
  "success": true,
  "pointsWritten": 1,
  "bucket": "sensors",
  "measurement": "temperature",
  "organization": "my-org"
}
Use Cases:
- Ingest real-time sensor data from industrial equipment
- Store production metrics and KPIs
- Log machine states and events with metadata tags
- Archive telemetry data from IoT devices
Using Parameters
The ((parameterName)) syntax creates dynamic, reusable functions. Parameters are automatically detected and can be configured with:
| Configuration | Description | Example |
|---|---|---|
| Type | Data type validation | string, number, boolean, datetime, json, buffer |
| Required | Make parameters mandatory or optional | Required / Optional |
| Default Value | Fallback value if not provided | sensors, 0, NOW() |
| Description | Help text for users | "Target bucket name", "Sensor temperature reading" |
Pipeline Integration
Use the InfluxDB query and write functions you create here as nodes inside the Pipeline Designer. Drag the function node onto the canvas, bind its parameters to upstream outputs or constants, and configure error handling as needed.
Common patterns include:
- Read → Transform → Write: Query data from InfluxDB, process it, and write results back
- Collect → Store: Gather data from OPC UA, MQTT, or Modbus and store in InfluxDB
- Query → Alert: Monitor metrics and trigger notifications based on thresholds
For broader orchestration patterns that combine InfluxDB with SQL, REST, MQTT, or other connector steps, see the Connector Nodes page.
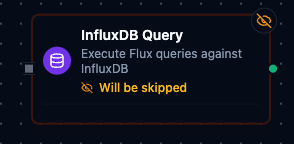
InfluxDB function node with connection, function, and parameter bindings
Common Use Cases
Storing Industrial Sensor Data
Scenario: Collect temperature, pressure, and vibration readings from manufacturing equipment and store them in InfluxDB for monitoring and analysis.
Write Configuration:
{
  "bucket": "factory-telemetry",
  "measurement": "equipment_sensors",
  "tags": {
    "plant": "chicago",
    "line": "assembly-1",
    "machine_id": "((machineId))"
  },
  "fields": [
    { "name": "temperature", "value": "((temp))", "type": "float" },
    { "name": "pressure", "value": "((pressure))", "type": "float" },
    { "name": "vibration", "value": "((vibration))", "type": "float" },
    { "name": "running", "value": "((isRunning))", "type": "boolean" }
  ]
}
Pipeline Integration: Connect after OPC UA or Modbus read nodes to continuously store equipment telemetry.
Querying for Dashboard Visualization
Scenario: Retrieve aggregated metrics for the past 24 hours to display on a real-time dashboard.
Query Configuration:
from(bucket: "factory-telemetry")
  |> range(start: -24h)
  |> filter(fn: (r) => r._measurement == "equipment_sensors")
  |> filter(fn: (r) => r.plant == "((plant))")
  |> aggregateWindow(every: 15m, fn: mean)
  |> pivot(rowKey: ["_time"], columnKey: ["_field"], valueColumn: "_value")
Pipeline Integration: Use in scheduled pipelines that feed visualization dashboards or BI tools.
Monitoring and Alerting
Scenario: Query recent sensor readings to detect anomalies and trigger alerts when values exceed thresholds.
Query Configuration:
from(bucket: "factory-telemetry")
  |> range(start: -5m)
  |> filter(fn: (r) => r._measurement == "equipment_sensors")
  |> filter(fn: (r) => r._field == "temperature")
  |> filter(fn: (r) => r._value > 85.0)
  |> count()
Pipeline Integration: Connect to conditional logic nodes that send alerts via SMTP or MS Teams when anomalies are detected.
Data Migration and Backup
Scenario: Export historical data from InfluxDB for archival or migration to another system.
Query Configuration:
from(bucket: "((sourceBucket))")
  |> range(start: ((startDate)), stop: ((endDate)))
  |> filter(fn: (r) => r._measurement == "((measurement))")
Pipeline Integration: Combine with S3 Write or SQL Insert functions to archive data to cold storage or migrate between systems.