ClickHouse Nodes
MaestroHub provides native ClickHouse integration for analytical queries, DML/DDL execution, and bulk inserts. Communication uses ClickHouse's native TCP protocol, with native typed binding for Map(K, V) / Array(T) / DateTime64 columns, full TLS / mTLS, and LZ4 / ZSTD wire compression.
Configuration Quick Reference
| Field | What you choose | Details |
|---|---|---|
| Parameters | Connection, Function, Function Parameters, Timeout Override | Select the connection profile, function, configure function parameters with expression support, and optionally override timeout. |
| Settings | Description, Timeout (seconds), Retry on Timeout, Retry on Fail, On Error | Node description, maximum execution time, retry behavior on timeout or failure, and error handling strategy. All execution settings default to pipeline-level values. |
Node Types
ClickHouse connector provides three specialized node types for different operation patterns:
| Node | Purpose | Common Use Cases |
|---|---|---|
| Query | Execute SELECT queries and return structured rows | Aggregations, time-series rollups, top-K analytics, enrichment lookups |
| Execute | Execute DML/DDL statements, return rows affected | INSERT … SELECT materialisation, schema migrations, OPTIMIZE TABLE maintenance |
| Write | Load pipeline data into a table with auto schema detection or auto MergeTree creation | Bulk telemetry ingest, native Map/Array column binding, auto-create on the fly |
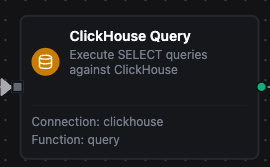
ClickHouse Query Node
ClickHouse Query Node
Execute SQL SELECT queries and return rows as structured data. Supports parameterized queries with ((param)) syntax and full ClickHouse SQL — aggregate combinators, window functions, ARRAY JOIN, LIMIT BY, and time-series helpers like toStartOfHour() / toStartOfFiveMinute().
Supported Function Types:
| Function Name | Purpose | Common Use Cases |
|---|---|---|
| Query | Run parameterized SELECT queries against ClickHouse | Hourly / daily rollups, top-K dashboards, enrichment joins with dictionaries, latest-value lookups via argMax() |
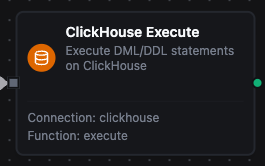
ClickHouse Execute Node
ClickHouse Execute Node
Execute DML/DDL statements — INSERT, INSERT … SELECT, ALTER, CREATE, OPTIMIZE, TRUNCATE, and others — and return affected-row counts where ClickHouse reports them. Use for ad-hoc writes, schema migrations, and table maintenance.
Supported Function Types:
| Function Name | Purpose | Common Use Cases |
|---|---|---|
| Execute | Run any DML/DDL statement against ClickHouse | Materialise rollups with INSERT INTO … SELECT, add columns with ALTER TABLE … ADD COLUMN, force background merges with OPTIMIZE TABLE … FINAL, fast purges with TRUNCATE TABLE |
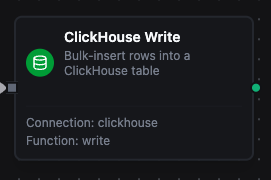
ClickHouse Write Node
ClickHouse Write Node
Bulk-insert pipeline rows into a ClickHouse table using batched VALUES inserts. Supports two paths: writing to an existing table (auto-detected schema mapping) or auto-creating a MergeTree table with operator-supplied ORDER BY. Native Map(K, V) and Array(T) columns are bound directly without JSON round-tripping — a pipeline field of {"unit": "celsius"} lands as a queryable Map, not a string blob.
Supported Function Types:
| Function Name | Purpose | Common Use Cases |
|---|---|---|
| Write | Load structured pipeline data into a ClickHouse table | Stream MQTT / OPC UA / Modbus telemetry into a MergeTree, auto-create tables from pipeline rows, append to a Distributed table fronting a cluster |
Output
Every ClickHouse node delivers its data under result, and execution facts (success, functionId, durationMs, timestamp) under _metadata:
| Node | Expression | Description |
|---|---|---|
| Query | $node["Name"].result.rows | The result rows — one object per row keyed by column name, up to the result limits — the 20,000-row cap and the 25 MB size budget by default. $node["Name"].result.rows[0].<column> reads a value |
$node["Name"]._metadata.truncated | true when the query hit a result limit and rows holds only what fit — the first 20,000 rows at the default cap, or fewer when the size budget tripped first | |
$node["Name"]._metadata.truncatedBy | Which limit cut the result — rows or bytes. Present only when truncated is true | |
$node["Name"].result.rowCount | How many rows were delivered — the same as result.rows.length | |
| Execute | $node["Name"].result.rowsAffected | Rows the statement affected, as the driver reports it |
| Write | $node["Name"].result.rowsInserted | Rows inserted across every batch of this execution |
The call's own facts ride along under _metadata next to the four every connected node carries. A Query delivers $node["Name"]._metadata.driver (the driver name), $node["Name"]._metadata.query (the SQL that ran) , $node["Name"]._metadata.truncated — true when the query hit a result limit and the rows were cut short — and, only then, $node["Name"]._metadata.truncatedBy (rows or bytes: which limit did it). An Execute delivers _metadata.driver and _metadata.query. A Write delivers _metadata.driver, _metadata.table, _metadata.batchSize, _metadata.totalRows (the rows it was given) and _metadata.matchedColumns (the table columns the data was mapped onto), plus _metadata.skippedFields when the data carried fields the table has no column for, or _metadata.schemaEvolution when schema evolution is on and the write added them as columns; when it created the table first, it delivers _metadata.tableCreated and the _metadata.columns it created instead of matchedColumns.
truncated before you aggregateA query stopped at the row limit returns a shorter rows array that looks exactly like a complete result. Nothing fails and nothing warns, so a downstream sum, average or count is silently wrong. The limits are the connectors module's queryResultMaxRows (20,000 rows by default) and queryResultMaxBytes (25 MB by default), whichever trips first, which is why _metadata.truncated is delivered on every query — branch on it, or narrow the query, rather than assuming the read was complete; _metadata.truncatedBy says which limit did it.