Pipelines
Overview
A Pipeline in MaestroHub is a visual workflow that automates data processing and business logic. Pipelines combine nodes (building blocks) to create sophisticated automation without writing code. Each pipeline can be triggered manually or on a schedule, and includes built-in execution monitoring and debugging capabilities.
Navigation Path: Orchestrate > Pipelines
Creating a Pipeline
Click + New Pipeline to open the creation dialog. The dialog has two tabs: Basic Settings and Advanced Settings.
Basic Settings
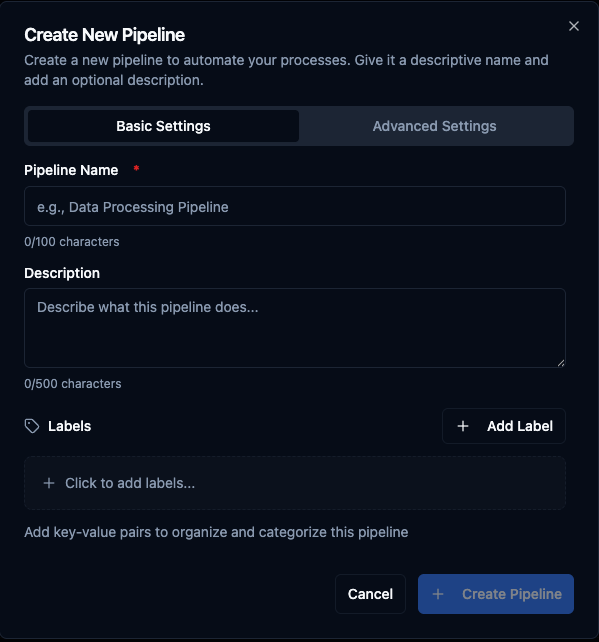
Basic Settings: pipeline name, description, and labels.
| Field | Required | Description |
|---|---|---|
| Pipeline Name | Yes | Unique name for your pipeline (3–100 characters). The system validates uniqueness in real time and suggests alternatives if the name is already taken. |
| Description | No | Describe what this pipeline does (max 500 characters). |
| Labels | No | Key-value pairs to organize and categorize the pipeline (e.g., environment:production, team:data-engineering, owner:mike.jones). |
Advanced Settings
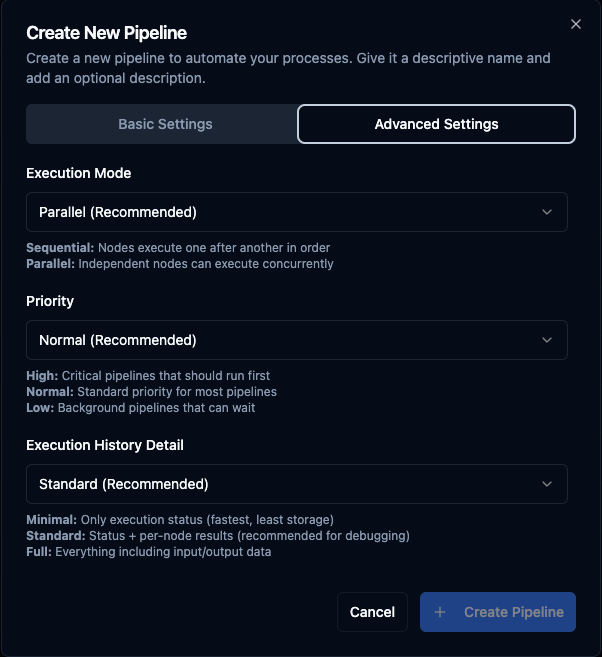
Advanced Settings: execution mode, priority, and execution history detail level.
| Field | Default | Options |
|---|---|---|
| Execution Mode | Parallel (Recommended) | Parallel — independent nodes execute concurrently. Sequential — nodes execute one after another in order. |
| Priority | Normal (Recommended) | High — critical pipelines that should run first. Normal — standard priority for most pipelines. Low — background pipelines that can wait. |
| Execution History Detail | Standard (Recommended) | Minimal — only execution status (fastest, least storage). Standard — status + per-node results (recommended for debugging). Full — everything including input/output data. |
Run timeout — how long one run may take — is not on the create form: a new pipeline gets the default, 30 minutes. To change it, open the pipeline's settings (Edit Pipeline → Advanced → Run timeout) and enter any duration from 1s up to 24h (for example 45m or 6h); leave it empty for the default. See Setting a pipeline's run timeout.
After creating your pipeline, the application redirects you to the Pipeline Designer where you build your workflow.
Error Handling
Pipeline-wide error handling is not on the create form. Open the pipeline's settings and choose the Error Handling tab (Edit Pipeline → Error Handling). These settings are the defaults for every node in the pipeline. A node whose own setting is Pipeline Default uses the value from this tab, and any node can override them in its Settings tab (see Error Handling on the Nodes page).
| Setting | Description |
|---|---|
| Timeout (seconds) | Maximum execution time per node, 1–600 seconds. |
| Retry on Timeout | Retry a node that times out. |
| Retry on Fail | Retry a node that fails. Turning it on shows Advanced Retry Configuration with the same retry settings a node has (see Advanced Retry Settings). |
| On Error | What happens when a node still fails after its retries: Stop Pipeline or Continue Execution. See Run status and On Error. |
Pipeline Designer
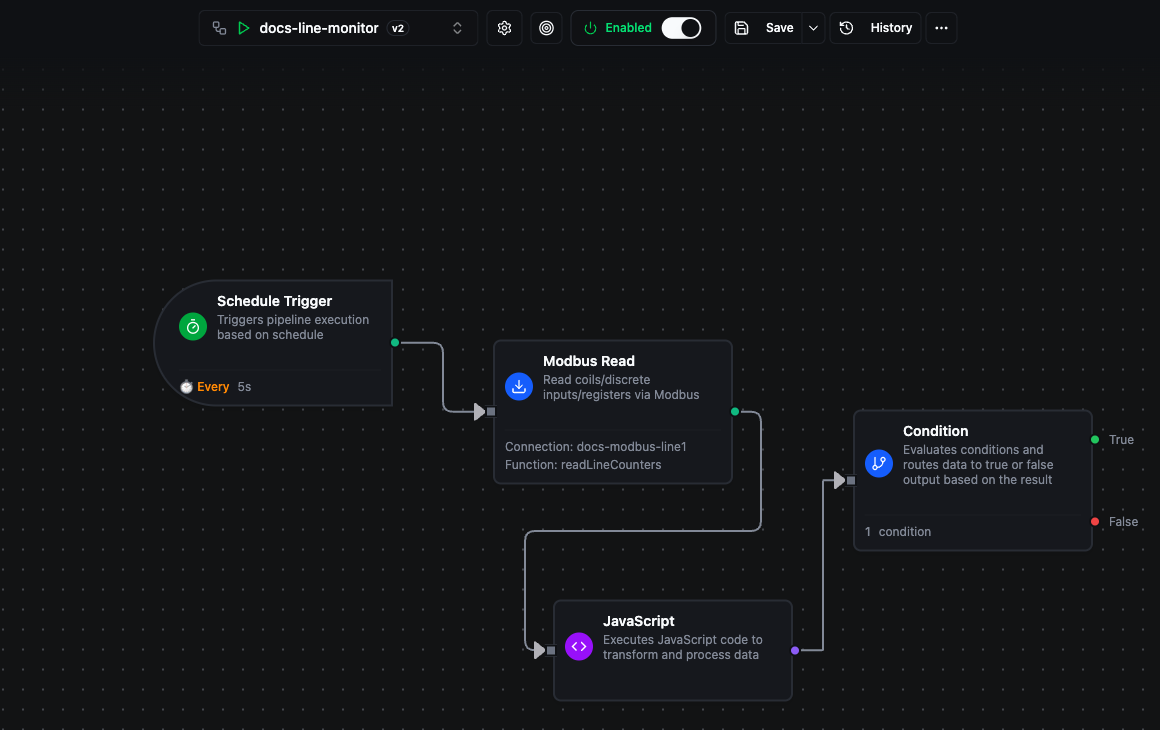
Pipeline Designer showing the toolbar, drag-and-drop canvas with nodes, and the Add Node panel.
The Pipeline Designer is a visual canvas where you build workflows by dragging nodes, drawing connections, and configuring logic. The canvas supports zoom, pan, multi-select, and a minimap for navigating large pipelines.
Toolbar
The toolbar at the top provides quick access to pipeline controls:
| Button | Description |
|---|---|
| Pipeline Selector | Dropdown to switch between pipelines without leaving the designer. |
| Enabled / Disabled | Toggle to activate or deactivate pipeline execution. |
| Save | Saves all changes. Shows a badge with the number of unsaved changes. |
| History | Opens the Execution History sidebar on the right. |
| ⋯ More actions | Opens a menu with the pipeline's secondary tools (see below). |
| Center | Fits all nodes into view. |
The ⋯ More actions menu holds:
| Item | Description |
|---|---|
| Versions | Opens the version history sidebar. See Pipeline Version History. Hidden while you are in Execution Replay. |
| Diagnostics | Checks the pipeline's structure and node connections and lists what it finds: Unused Trigger, Orphan Node, Unreachable Dependency, and Mutually Exclusive Dependencies. Click a node name in a finding to jump to that node on the canvas. When nothing is wrong, it shows No issues found. |
| Store & Forward | Opens the Store & Forward page on its Buffers tab, scoped to this pipeline. |
| Functions (N) | Shown only when the pipeline uses functions from the shared function library. Opens Functions in use. |
| Metrics | Shows or hides the Pipeline Metrics panel. |
| Timeline | Shows or hides the skip timeline (see Skip Timeline). |
Context Menu
Right-click on the canvas to access common actions:
| Action | Shortcut |
|---|---|
| Add node | Tab |
| Add sticky note | Shift + S |
| Save as Template (shown only when nodes are selected) | — |
| Save pipeline | Ctrl + S |
| Refresh pipeline | F5 |
| Reset execution counters | — |
| Tidy up pipeline | Alt + T |
| Select all | Ctrl + A |
Testing Nodes
The designer has no button that runs the whole pipeline. You test one node at a time: open a node and click Test Node. When the node or a node feeding it talks to an external system, a Sandbox | Live control next to the button decides whether the run does real I/O. See Node Configuration & Testing.
When the pipeline runs while it is open in the designer, nodes update in real time to show their current status.
For nodes inside a For-Each loop, the live view shows a sample of the iterations (the first few, periodic snapshots and the last) while the tile's count stays exact; every iteration is available afterwards from Execution History. See Watching a Loop Run.
Node Types
MaestroHub provides a growing library of nodes organized into categories. Open the Add Node panel (press Tab or click the + button) to browse and drag nodes onto the canvas. The panel has three tabs: Categories, All, and Favorites.
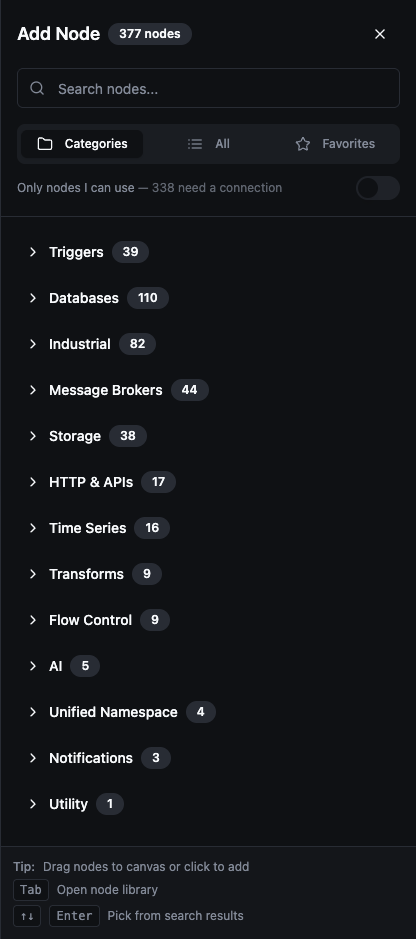
Add Node panel with Categories, All, and Favorites tabs.
| Category | Examples |
|---|---|
| Triggers | Manual, Schedule, Webhook, MQTT, OPC UA, Pipeline Event |
| Industrial | OPC UA Read/Write, Modbus Read/Write, S7 Read/Write, OPC DA Read |
| Databases | PostgreSQL, MSSQL, MySQL, Oracle, MongoDB |
| Time Series | InfluxDB, QuestDB, Prometheus, Timestream |
| Message Brokers | MQTT Publish, Kafka Produce, RabbitMQ Publish, NATS Publish |
| Storage | S3 Fetch/Write, Local File, FTP, Azure Blob |
| HTTP & APIs | REST Request, SOAP Invoke, AWS Lambda Invoke, Smart Connector |
| Notifications | MS Teams, Slack Send Message, SMTP Send |
| Flow Control | Condition, Switch, Merge, For-Each, Wait, JavaScript, Approval |
| Transforms | Set, Buffer, Aggregator, Group By, File Extractor, Convert to File |
| AI | AI Agent, Gemini Generate Content |
| Unified Namespace | UNS Publish, UNS Publish (Batch), UNS Fetch Data, UNS Search Nodes |
| Utility | Sticky Note |
Triggers are always listed first. The other categories are ordered by how many nodes they hold.
The node library grows continuously with new integrations and capabilities. For detailed documentation on specific node types, see the Nodes documentation.
Templates
A template saves a selected group of nodes and the connections between them.
To create one, select nodes on the canvas, right-click the canvas, and choose Save as Template. The option appears only while nodes are selected.
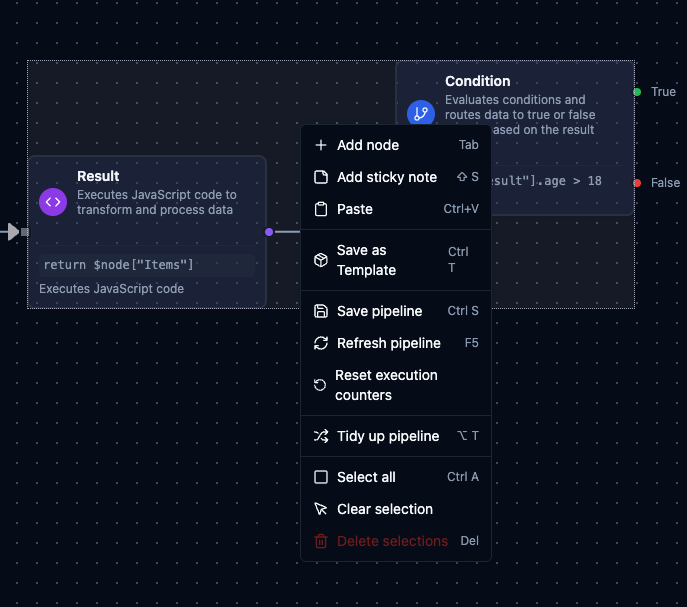
Save as Template in the canvas context menu.
Node Configuration
Each node follows a standardized configuration structure with Basic Information, Parameters, and Settings tabs. When you select a node on the canvas, the configuration panel opens on the right side.
For detailed information about node configuration structure, error handling strategies, and best practices, see the Nodes documentation.
Execution History
Navigation: Orchestrate → Execution History
The Execution History page shows a global table of all pipeline executions across the entire system. Use it to search across pipelines, track specific runs, and monitor overall execution health.
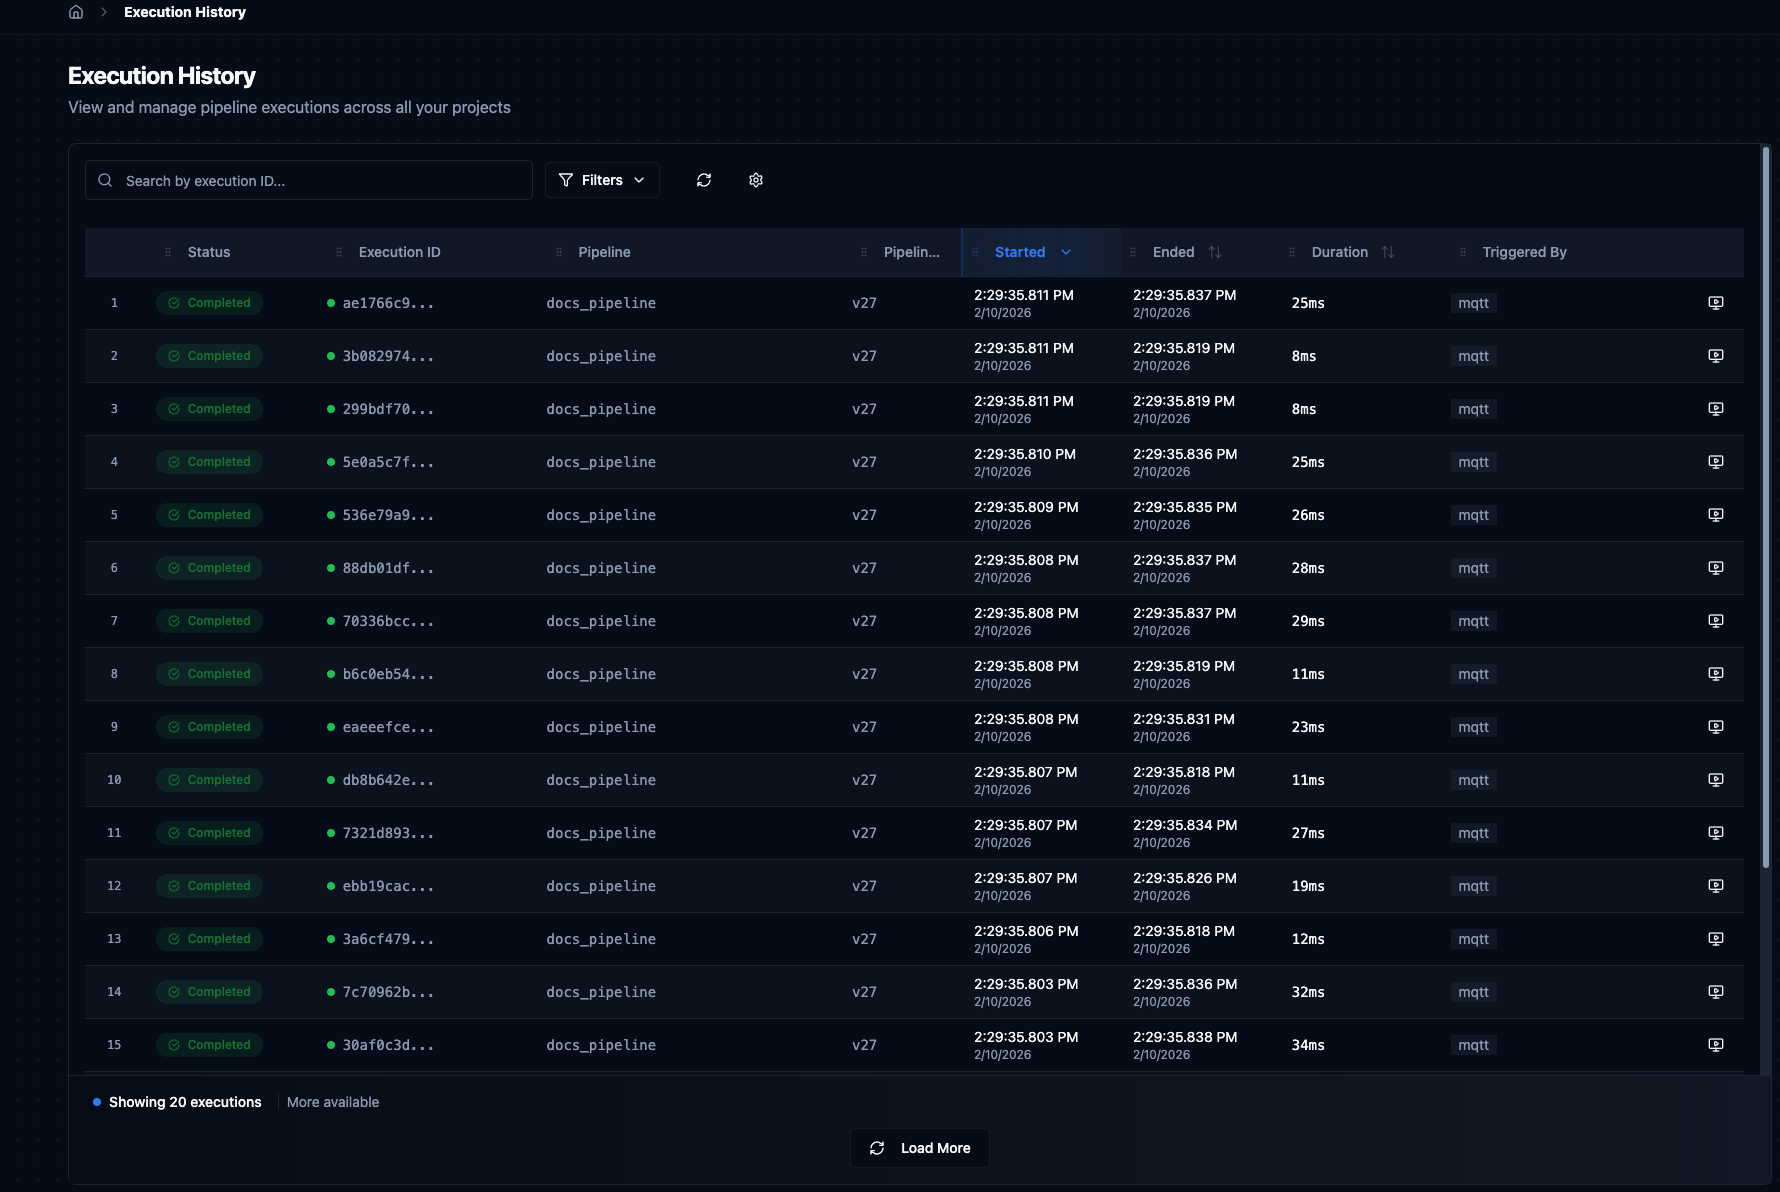
Execution History table showing recent pipeline runs with status, timing, and action buttons.
Table Columns
| Column | Description |
|---|---|
| Status | Color-coded badge — Completed, Completed with Errors, Failed, Running, Queued, or Cancelled. Completed with Errors means a node failed but the pipeline was set to continue; see Run status and On Error. |
| Execution ID | Unique UUID. Click to copy to clipboard. |
| Pipeline | Name of the pipeline that ran. Click to open it in the designer. |
| Pipeline Version | Which version of the pipeline was executed (e.g. v37). |
| Started | Timestamp when execution began. Sortable. |
| Ended | Timestamp when execution finished. Shows "Still running..." for active executions. Sortable. |
| Duration | Total execution time. Color-coded: green under 1 minute, orange over 1 minute. Sortable. |
| Triggered By | How the execution was started — Schedule, Manual, Webhook, or Event. |
Filters
Click Filters to expand the Advanced Filters panel.
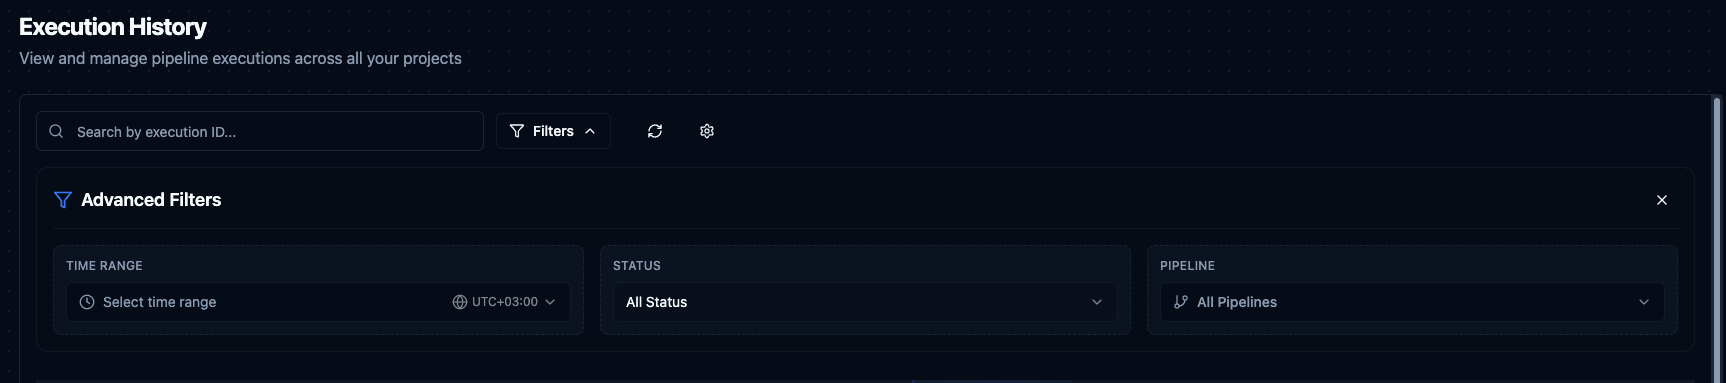
Advanced Filters: Time Range, Status, and Pipeline selectors.
| Filter | Description |
|---|---|
| Search | Search by execution ID with partial matching. |
| Time Range | Preset ranges (Last 1 hour, Last 24 hours, etc.) or custom date range with timezone support. |
| Status | Filter by status: All, Queued, Running, Completed, Completed with Errors, Failed, Failed or Completed with Errors, Cancelled. The combined option lists every run with a node failure — the same population the Overview's Investigate failed runs card counts. |
| Pipeline | Filter by a specific pipeline or show all. |
All filter and sort states persist in the URL, so you can share links with pre-applied filters or bookmark commonly used views.
Actions
| Action | Available When | Description |
|---|---|---|
| View on Canvas | Completed, Completed with Errors, Failed, Cancelled | Opens the execution in Execution Replay mode on the Pipeline Designer. |
| Retry | Failed, Completed with Errors | Reruns the pipeline with the same inputs. Creates a new execution instance. |
| Cancel | Running | Gracefully stops the execution. Completed nodes are preserved. |
Emergency Stop
The Emergency Stop button in the Execution History header stops pipelines for the whole organization, not only one pipeline. It is shown only to users with the org:emergency_recovery permission. It offers two actions:
| Action | What it does |
|---|---|
| Stop pending pipelines | Removes every pipeline run that is waiting to start. Runs that are already running continue. The dialog shows how many runs are waiting. |
| Stop running pipelines | Sends a stop signal to every running pipeline. Each one stops at its next safe point, which can take a moment for slow steps. Work a run has already done (database writes, message publishes, API calls) is not undone. |
Both actions open a confirmation dialog that asks for a Reason (recorded for audit) and for the organization name, typed exactly. Confirm stays disabled until both are filled in. Neither action can be undone.
Stopping running pipelines does not stop new runs from starting. To stop those too, turn on maintenance mode from the organization Overview; it also suspends the organization's connections.
Pagination
The table loads 20 executions by default. Click Load More at the bottom to fetch additional entries. Running and queued executions auto-refresh every 5 seconds.
Execution Replay
Select an execution from the History sidebar or click View on Canvas from the Execution History table to enter Execution Replay mode. This overlays the historical execution results onto the pipeline canvas so you can visually inspect what happened at each node.
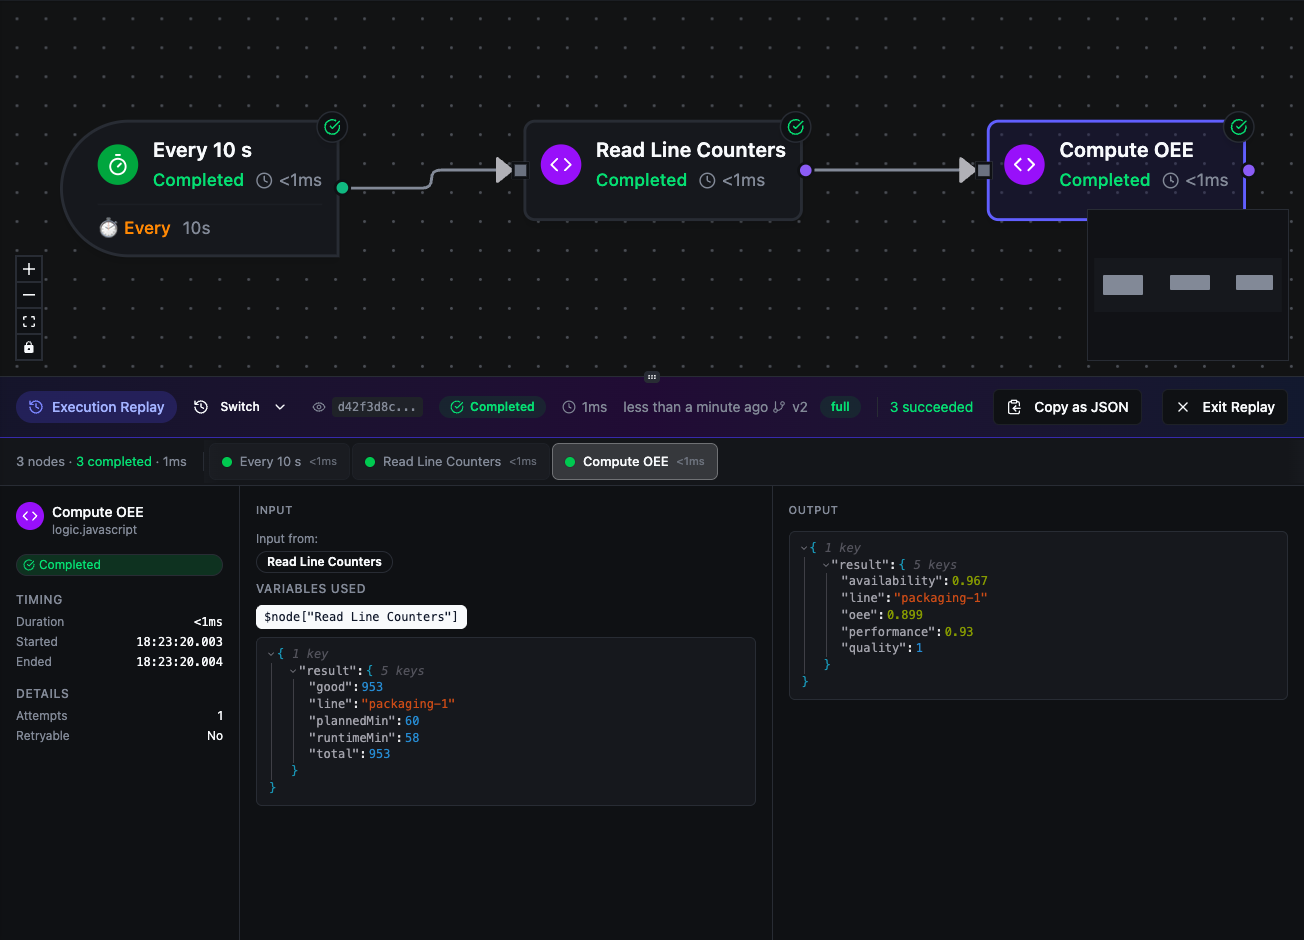
Execution Replay: each node's result on the canvas, and the run's details in the panel below
The panel below the canvas has a header with the run's ID, status, duration, version and detail level (with Switch, Copy as JSON and Exit Replay), a tab for every node that ran, and three columns for the selected node: its status and timing, the input it received, and the output or error it produced. What a run keeps depends on its Execution History Detail: input and output data are kept only at Full. For a node inside a For-Each loop, see Watching a Loop Run. Troubleshooting › Execution Replay describes every part of the panel.
Shareable URL — when you enter Replay mode, the URL updates with ?execution={id}. Share this URL and the recipient will open the same execution directly in Replay mode.
Pipeline Metrics
Choose ⋯ More actions → Metrics in the Pipeline Designer toolbar to open a metrics panel showing real-time performance statistics for the current pipeline. The panel auto-refreshes every 5 seconds.
| Metric | Description |
|---|---|
| Success Rate | Percentage of successful executions with trend indicator. |
| Success / Failed | Counts of successful and failed executions. |
| Total Runs | Total number of executions. |
| Avg Time | Average execution duration. |
The counts start from zero when MaestroHub restarts, and they include every run, not only the ones kept in execution history.
Skip Timeline
Choose ⋯ More actions → Timeline in the Pipeline Designer toolbar to see the trigger fires this pipeline dropped without running in the last 5 minutes. Each skipped fire is a tick on an amber lane; hover over a tick for its time and reason. When there are too many to draw one by one, the lane shows them as a density band instead. The panel refreshes every 3 seconds, and the refresh button reloads it at once.
The header shows the number of skips in the window (total), the rate (per min), the most common reason (primary), and the total number of skips the engine has recorded for this pipeline since it last started (lifetime).
| Reason | Meaning |
|---|---|
| body too slow for cadence | A schedule fire was dropped because earlier runs were still occupying the pipeline. The pipeline takes longer than its schedule interval. |
| pipeline disabled | The pipeline was disabled when the trigger fired. |
| org maintenance | The organization was in maintenance mode, which drops every trigger fire. |
| dispatcher disabled | Trigger dispatching is turned off for the whole deployment (for example, when the license has expired). |
| pipeline not found | The trigger fired for a pipeline that could not be found (for example, one that was deleted). |
When nothing was skipped, the panel says so.