Grafana Nodes
Put an alarm, a batch or a shift handover on the Grafana chart where it happened.
- Needs
- A Grafana connection
- Operations
- Create Annotation
- Output
- The new annotation's id and where it sits
Grafana draws the charts many plants read. MaestroHub's Grafana node adds annotations to them: a marker, or a shaded region, with your text and tags, at the moment the event happened.
Configuration Quick Reference
| Field | What you choose | Details |
|---|---|---|
| Parameters | Connection, Function, Function Parameters, Timeout Override | Select the connection profile, function, configure function parameters with expression support, and optionally override timeout. |
| Settings | Description, Timeout (seconds), Retry on Timeout, Retry on Fail, On Error | Node description, maximum execution time, retry behavior on timeout or failure, and error handling strategy. All execution settings default to pipeline-level values. |
Every node delivers its data under result, and execution facts (success, functionId, durationMs, timestamp) under _metadata, with the call's own facts in $node["Name"]._metadata.method (the operation), $node["Name"]._metadata.connectionId (the connection it ran over) and $node["Name"]._metadata.protocol (grafana).
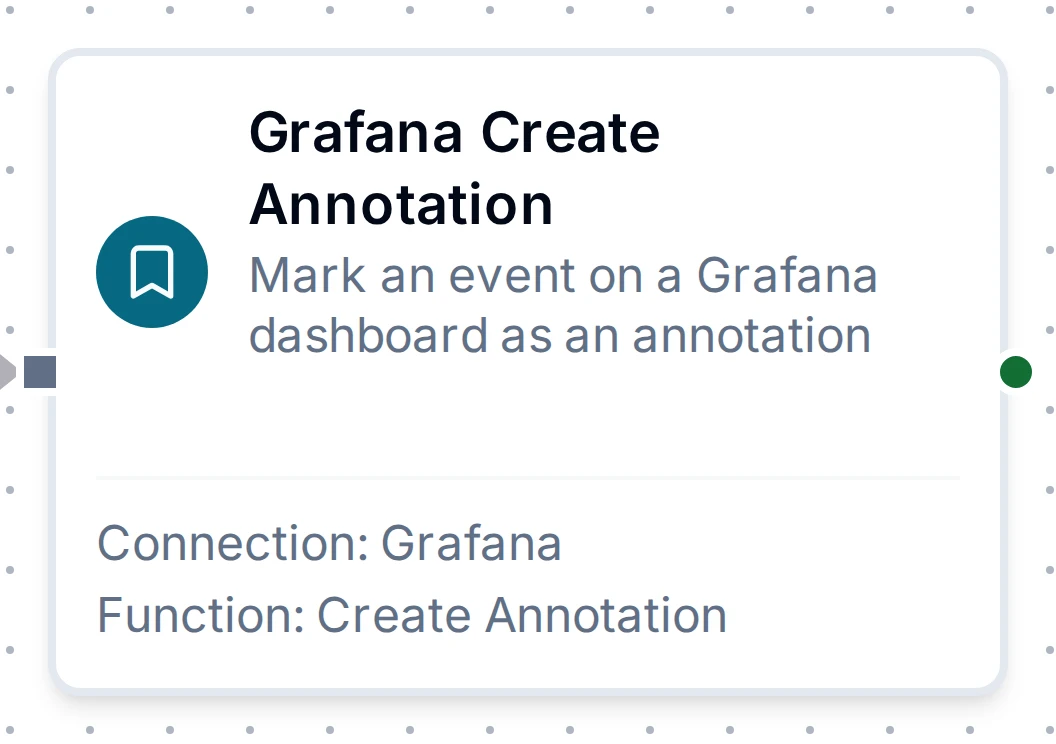
Grafana Create Annotation Node
Grafana Create Annotation Node
Creates one annotation: a point, or a region when an end time is set, on one dashboard, one panel of it, or for the whole Grafana organization. It is placed at the time you give, or, when you give none, at the moment the pipeline produced the write, so an annotation held back by store-and-forward during an outage still lands where the event happened.
Each run adds a marker. Grafana takes no request key, so a run whose answer was lost (a timeout) and that Retry on Fail or store-and-forward sends again can leave a second marker. The node itself never re-sends.
Output
| Expression | Description |
|---|---|
$node["Name"].result.annotationId | Grafana's id of the new annotation |
$node["Name"].result.time | When the annotation sits on the chart, UTC RFC 3339, at Grafana's millisecond precision |
$node["Name"].result.timeEnd | Where a region annotation ends, UTC RFC 3339. Absent for a point annotation |
$node["Name"].result.dashboardUid | The dashboard the annotation is on. Absent for an organization annotation |
$node["Name"].result.panelId | The panel the annotation is on. Absent when no panel was given |
The dashboard list you see while building a function comes from the connection's dashboard picker. It is not a function you can save, so no node returns it.
For every function field, see the Grafana Integration Guide.