 Grafana Integration Guide
Show why the line moved: mark alarms, batches, recipe changes and shift handovers on the Grafana charts your engineers already read.
- Authentication
- Service-account token
- Operations
- Create Annotation
- Works with
- Grafana OSS, Enterprise and Grafana Cloud
Create Grafana annotations from your pipelines. This guide covers the service account Grafana needs, the connection, the function, and how to make an annotation show on the dashboard you expect.
Overview
The Grafana connector enables you to:
- Mark an event on a dashboard, on one panel of it, or for the whole Grafana organization
- Draw a region from a start to an end time, such as a batch or a downtime
- Place it where it happened: at the time you give, or at the moment the pipeline produced the write, so an annotation delayed by an outage still sits at the right place on the chart
- Tag it so Grafana's annotation queries can filter it
- Pick the dashboard from the ones the token can see
Two related needs are met elsewhere, not by this connector:
- A Grafana alert that starts a pipeline: point a Grafana webhook contact point at a Webhook trigger.
- Charts of MaestroHub data in Grafana: let Grafana read the store your pipelines write to, for example through the Prometheus connector.
Prerequisites
- Network access from MaestroHub to Grafana's HTTP port: 3000 by default, or 443 when Grafana sits behind a proxy or is Grafana Cloud (
https://<stack>.grafana.net). - A service account. In Grafana, go to Administration → Users and access → Service accounts → Add service account. Give it a role that may create annotations:
- Grafana OSS: Editor. If the account should change nothing but annotations, give it Viewer instead, and on each dashboard it annotates, Edit permission (dashboard Settings → Permissions → add the service account with Edit). Such an account can annotate those dashboards only; it cannot create organization annotations.
- Grafana Enterprise and Grafana Cloud: role None plus the fixed role Annotation writer (
fixed:annotations:writer).
- A token. On the service account, Add service account token. Grafana shows the token (starting
glsa_) once; copy it.
A service-account token belongs to one Grafana organization: annotations land in that organization. To annotate dashboards of another organization, create a service account there.
Older guides mention Grafana API keys. Grafana has replaced them with service accounts; use a service-account token.
Connection Configuration
Creating a Grafana Connection
Navigate to Connections → New Connection → Grafana and configure the following:
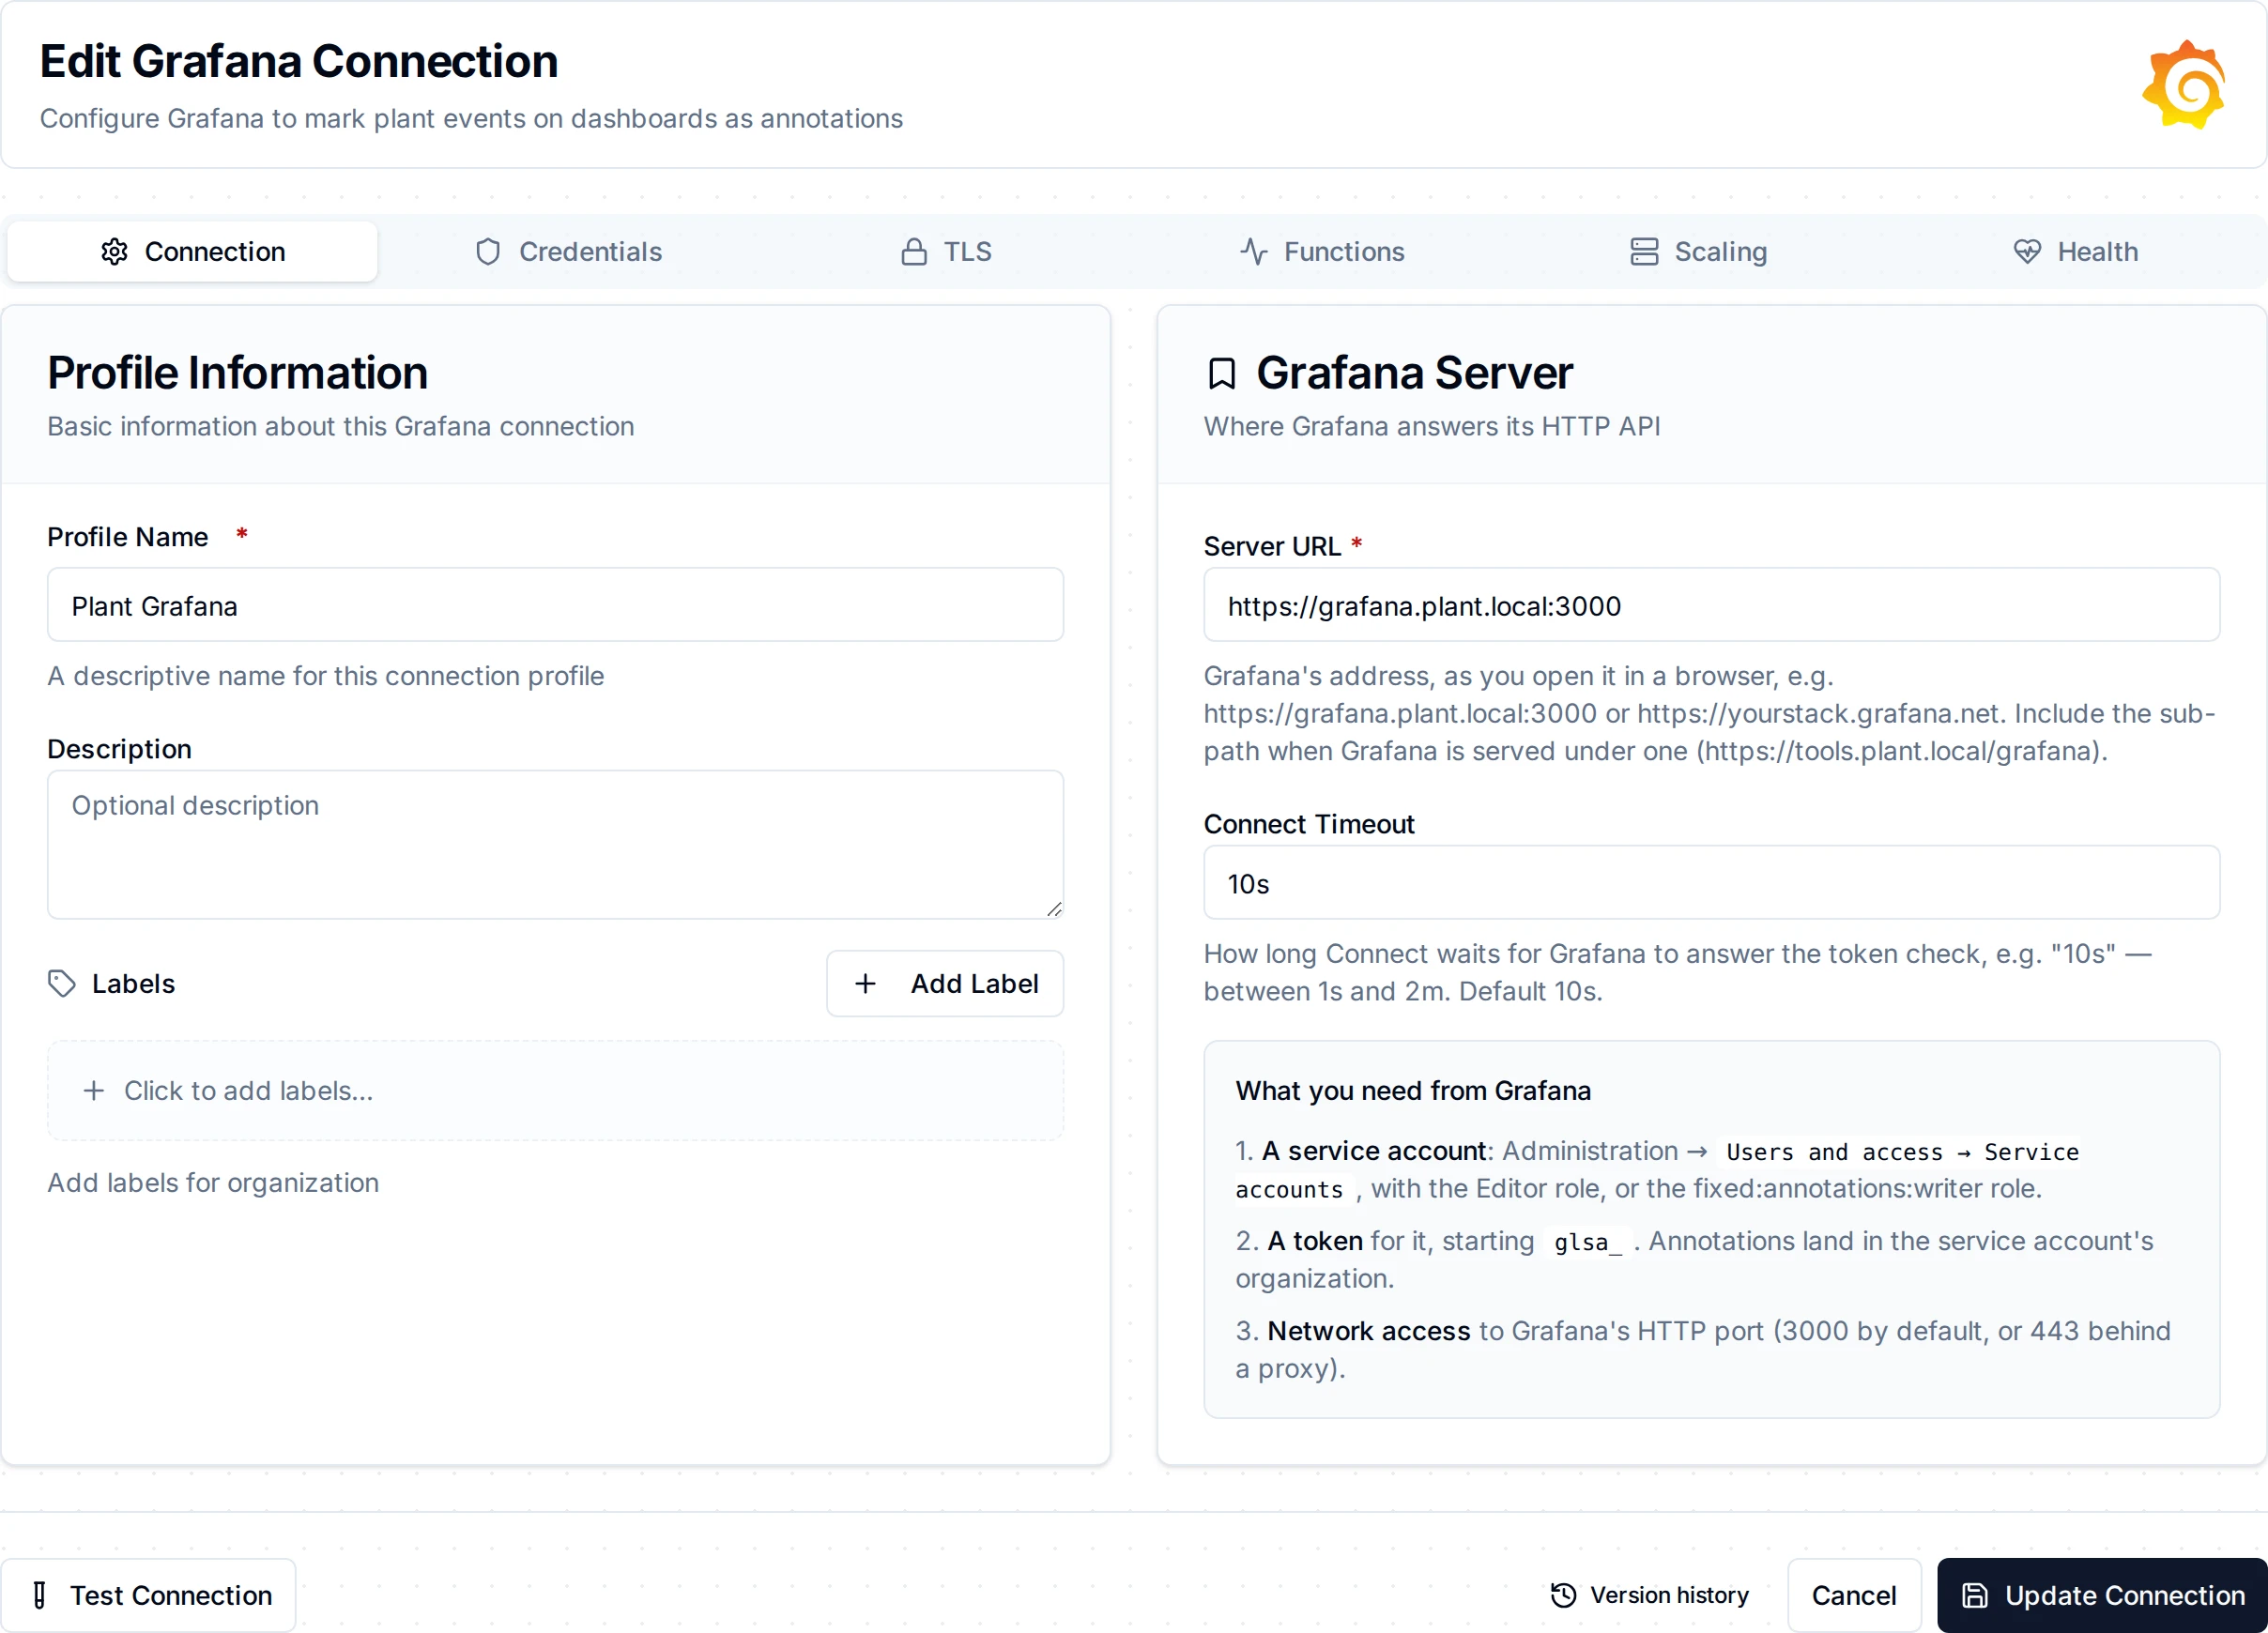
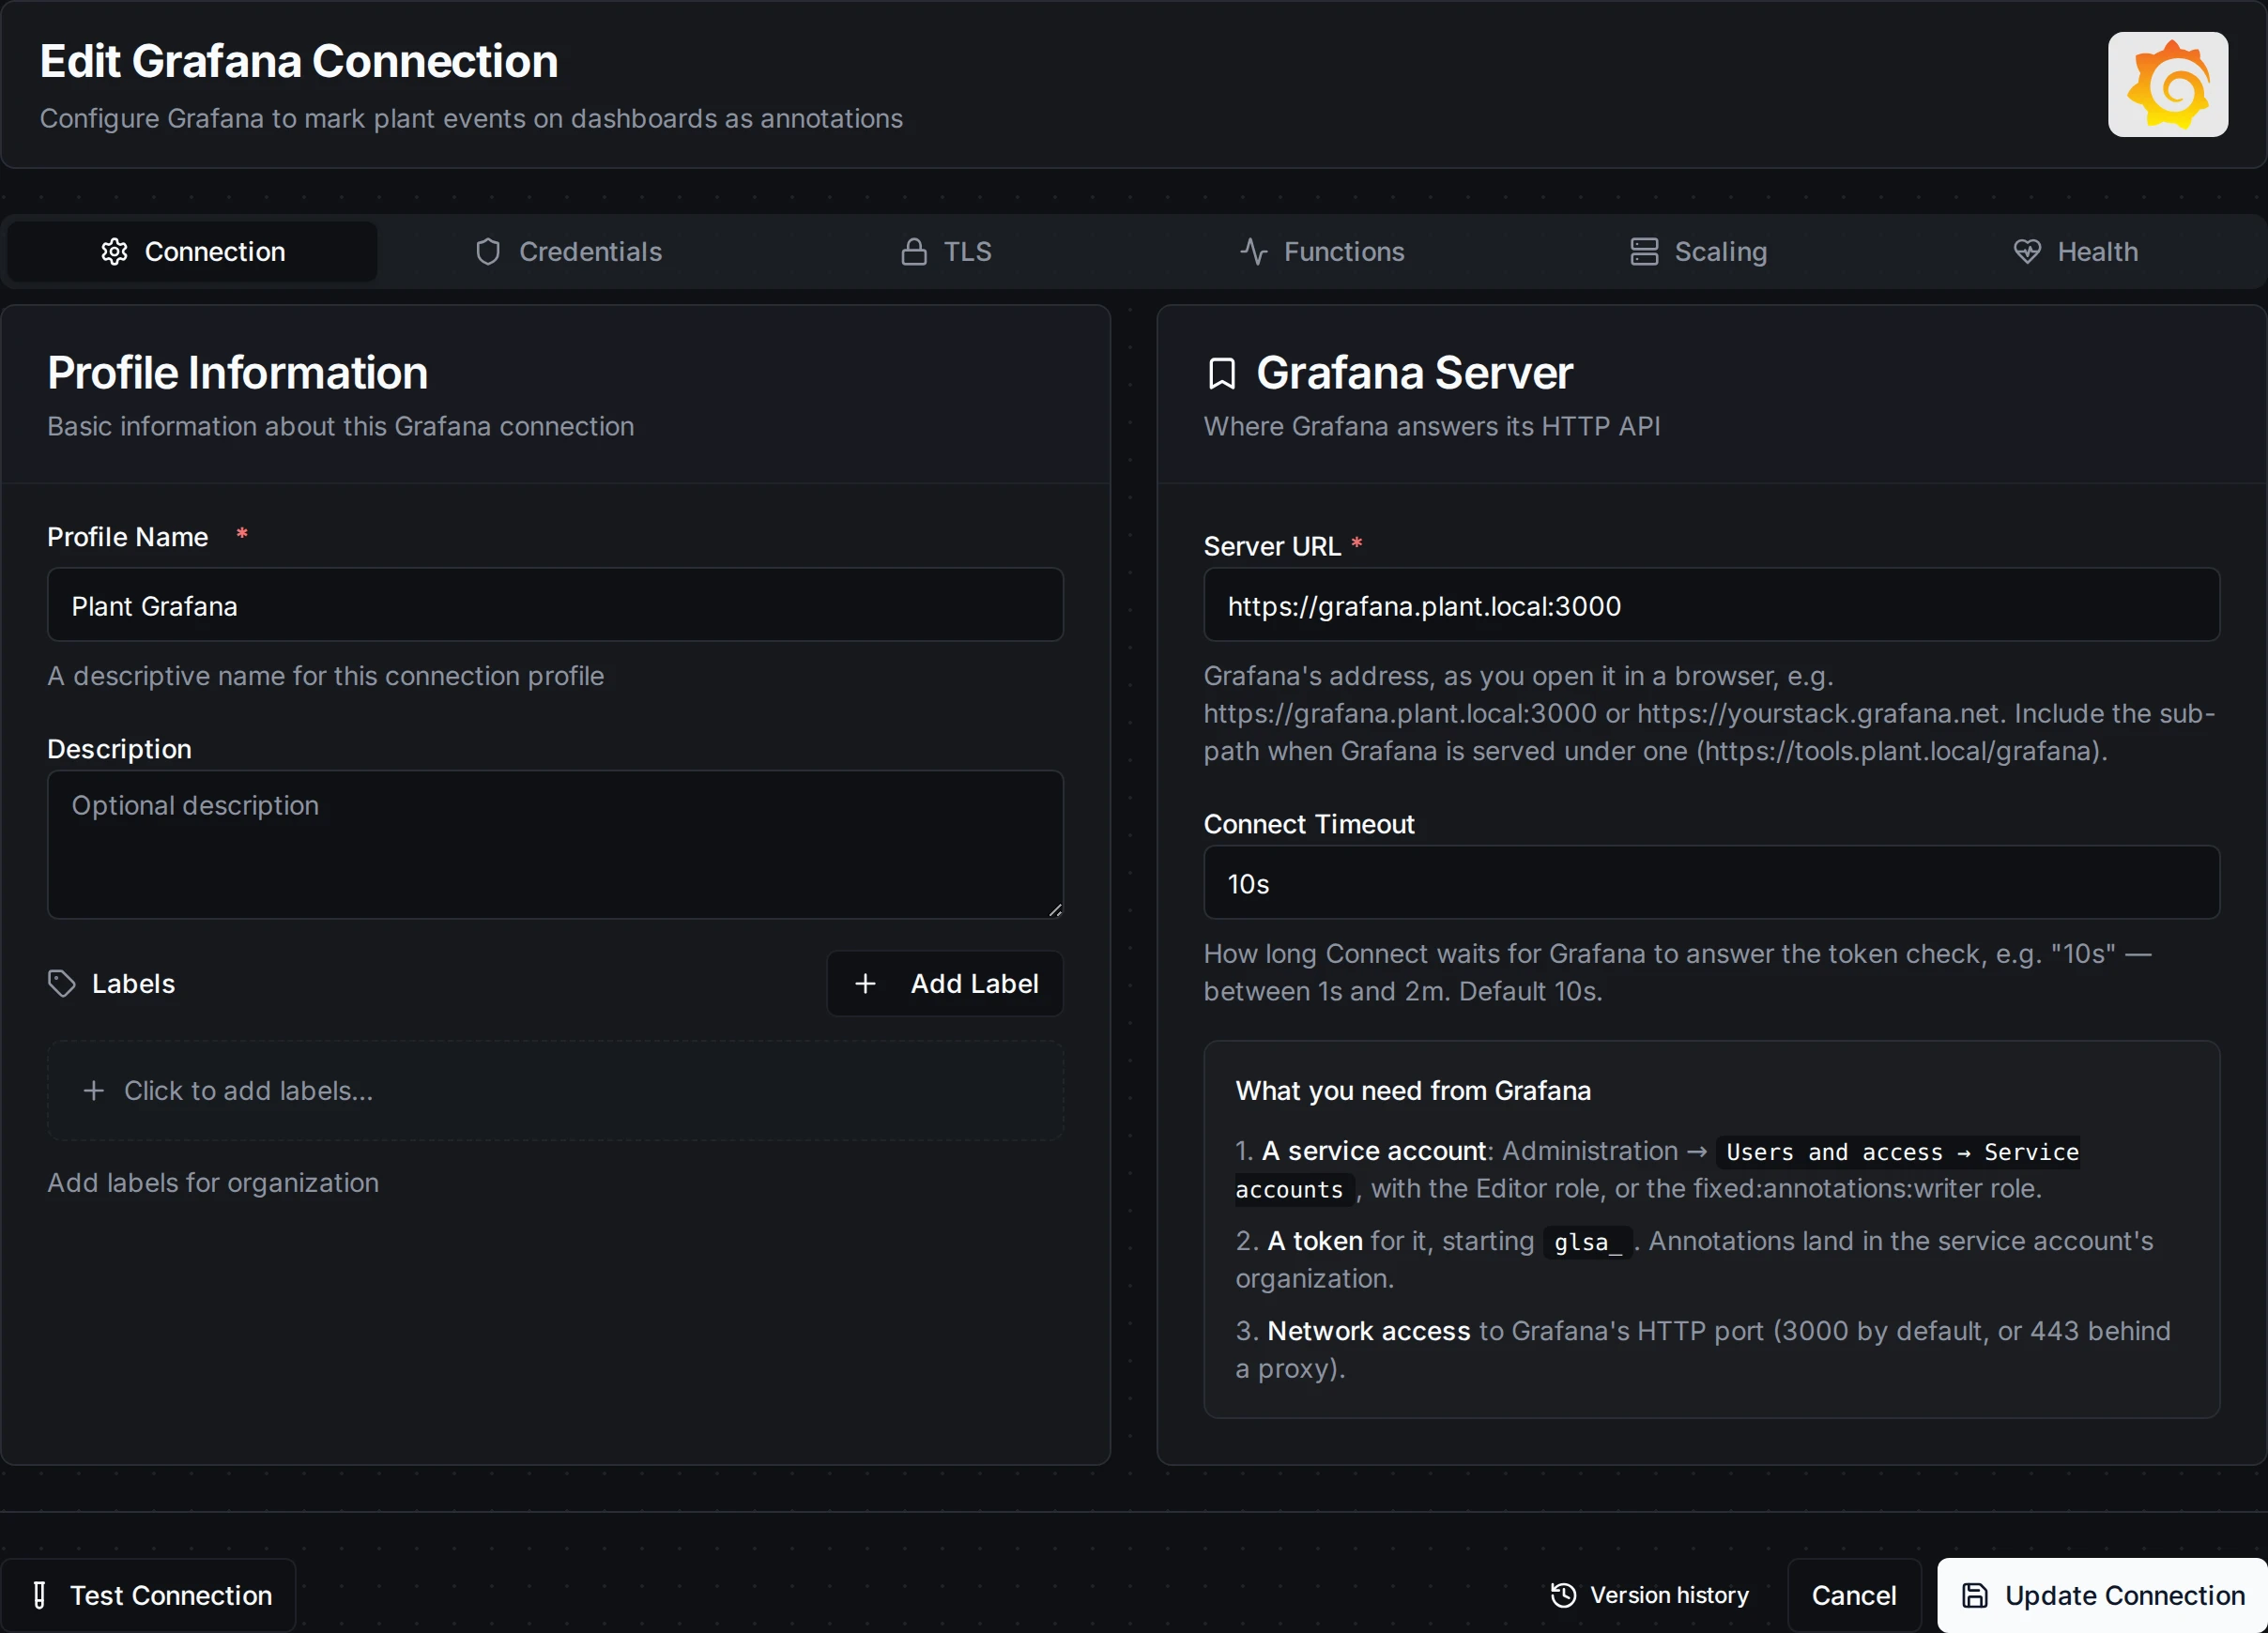
The Grafana connection form
1. Profile Information
| Field | Default | Description |
|---|---|---|
| Profile Name | - | A descriptive name for this connection profile (required, max 100 characters) |
| Description | - | Optional description for this Grafana connection |
2. Connection
| Field | Default | Description |
|---|---|---|
| Server URL | - | Grafana's address as you open it in a browser, e.g. https://grafana.plant.local:3000. Include the sub-path when Grafana is served under one, e.g. https://tools.plant.local/grafana (required) |
| Service Account Token | - | The service account's token, glsa_… (required, stored encrypted) |
| Connect Timeout | 10s | How long Test Connection and Connect wait for Grafana's answer, 1 second to 2 minutes |
3. TLS
| Field | Default | Description |
|---|---|---|
| CA Certificate (PEM) | - | The CA that signed Grafana's certificate, when it comes from your own CA. Leave empty to trust the system's CAs |
| Client Certificate (PEM) | - | For mutual TLS, when a proxy in front of Grafana asks for a client certificate |
| Client Private Key (PEM) | - | The client certificate's key (stored encrypted) |
| Skip Certificate Verification | Off | Accept any certificate. Insecure: use it only to try out a Grafana with a self-signed certificate; give the CA instead |
Plain http:// is accepted for a Grafana on a closed plant network or behind a proxy that terminates TLS. The token then travels unencrypted.
- Test Connection runs one authenticated search (
GET /api/search?type=dash-db&limit=1). It proves that the token works, not only that Grafana is up: a deleted or wrong token fails at once with 401./api/healthis not used because it answers without a token. - Security: the token is stored encrypted and masked on edit. Leave the field empty to keep the stored value.
Function Builder
Creating Grafana Functions
After saving the connection:
- Open the connection and go to its Functions tab → New Function
- Select Create Annotation
- Configure the function's parameters
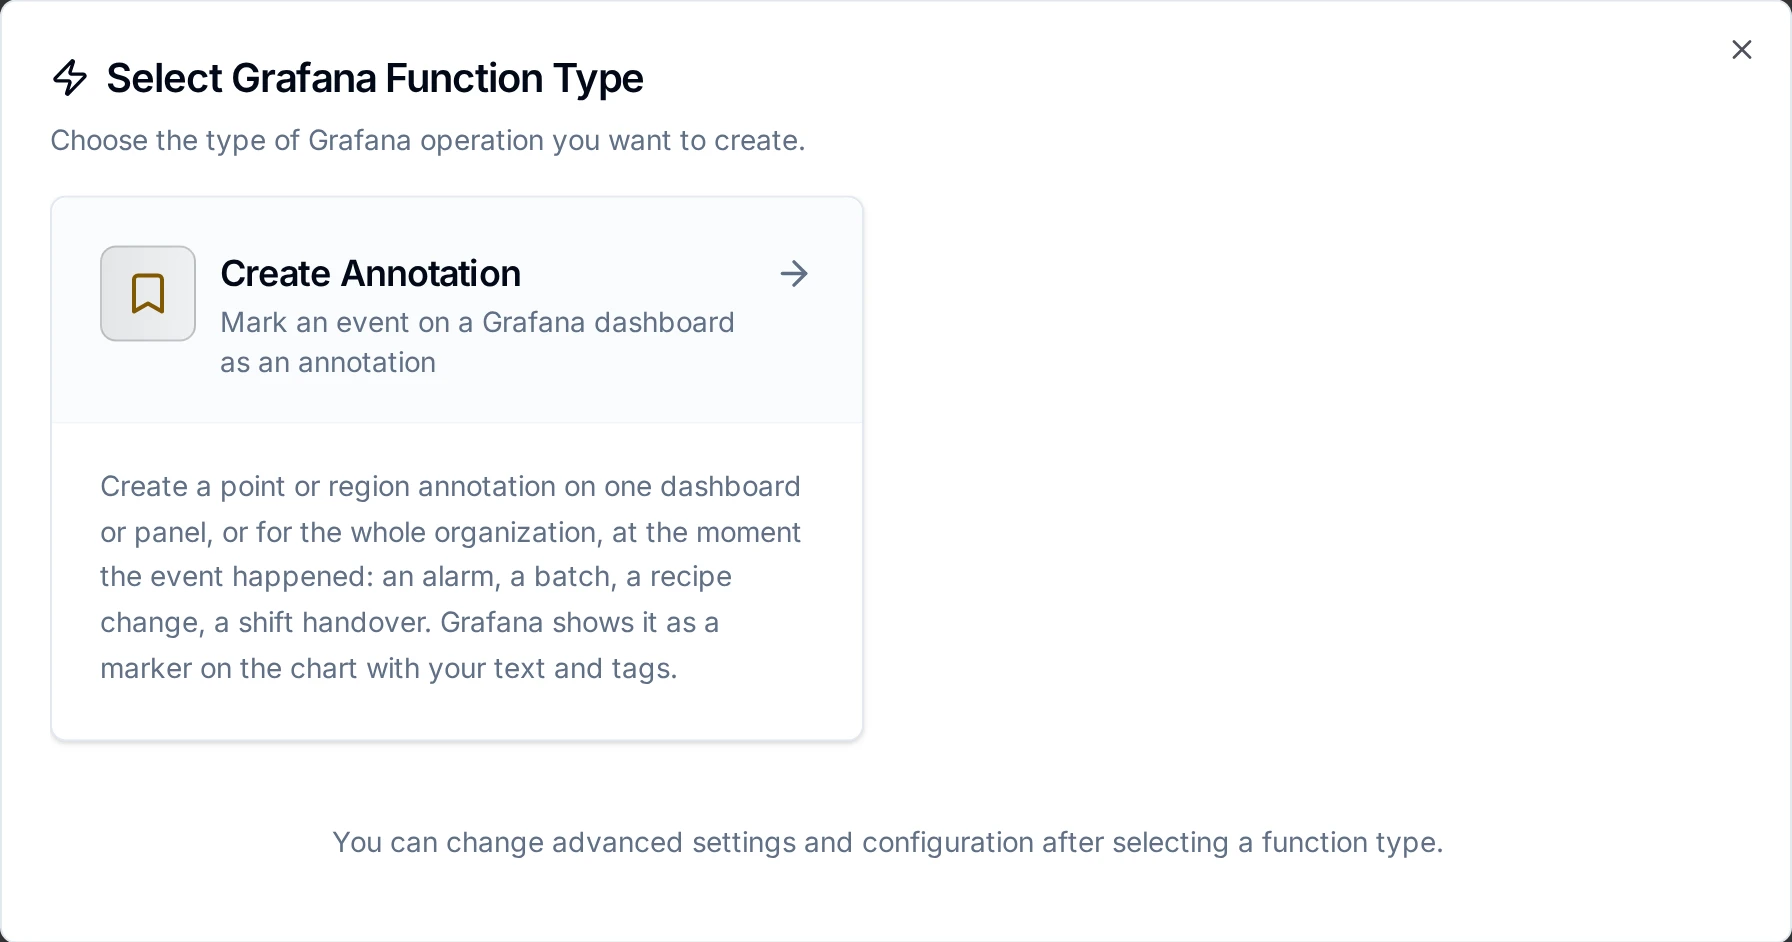
The Grafana function types
Create Annotation Function
Purpose: Mark an event on a Grafana dashboard.
| Field | Type | Required | Default | Description |
|---|---|---|---|---|
| Text | String | Yes | - | What the annotation says, shown in Grafana's tooltip, at most 10,000 characters. Sent as written; Grafana renders simple HTML in it and strips scripts |
| Dashboard | String | No | - | The dashboard's UID, as in its URL /d/<uid>/…. Pick it from the dashboards the token can see, or type it. Empty: an organization annotation (see below) |
| Panel ID | Number | No | - | One panel of the dashboard instead of all of them. The id is in the panel's share link (viewPanel=<id>). Needs a dashboard |
| Tags | List | No | - | Tags for filtering in Grafana. A templated value may hold several, separated by commas |
| Time | String | No | produce time | When the event happened: RFC 3339 (2026-11-03T08:42:58.250Z) or Unix epoch milliseconds (1793695378250). Empty: the moment the pipeline produced the write |
| End Time | String | No | - | Makes the annotation a region, such as a batch or a downtime. Same forms as Time, and not earlier than it |
| Timeout | Duration | No | 30s | Bound on the call |
Every field is checked before anything is sent: an empty text, a dashboard UID that is not one (letters, digits, - and _, at most 40), a panel without a dashboard, an end before the start, or a time in seconds fails the call without contacting Grafana. Grafana would accept a time in seconds and put the marker in January 1970; MaestroHub refuses any number before 1973 and asks whether it is in seconds.
- A wrong or deleted token (401), a service account that may not annotate (403), and a dashboard that does not exist fail the call for good; fix the setting and run again.
- A Grafana that is down, overloaded (429, 5xx) or does not answer in time fails the call for now: Retry on Fail and store-and-forward may send it again.
- Grafana takes no request key, so a create whose answer was lost in a timeout may already be stored. Sending it again can leave a second marker. MaestroHub itself never re-sends.
Using Parameters
Use ((parameterName)) in fields to fill them from pipeline data at run time:
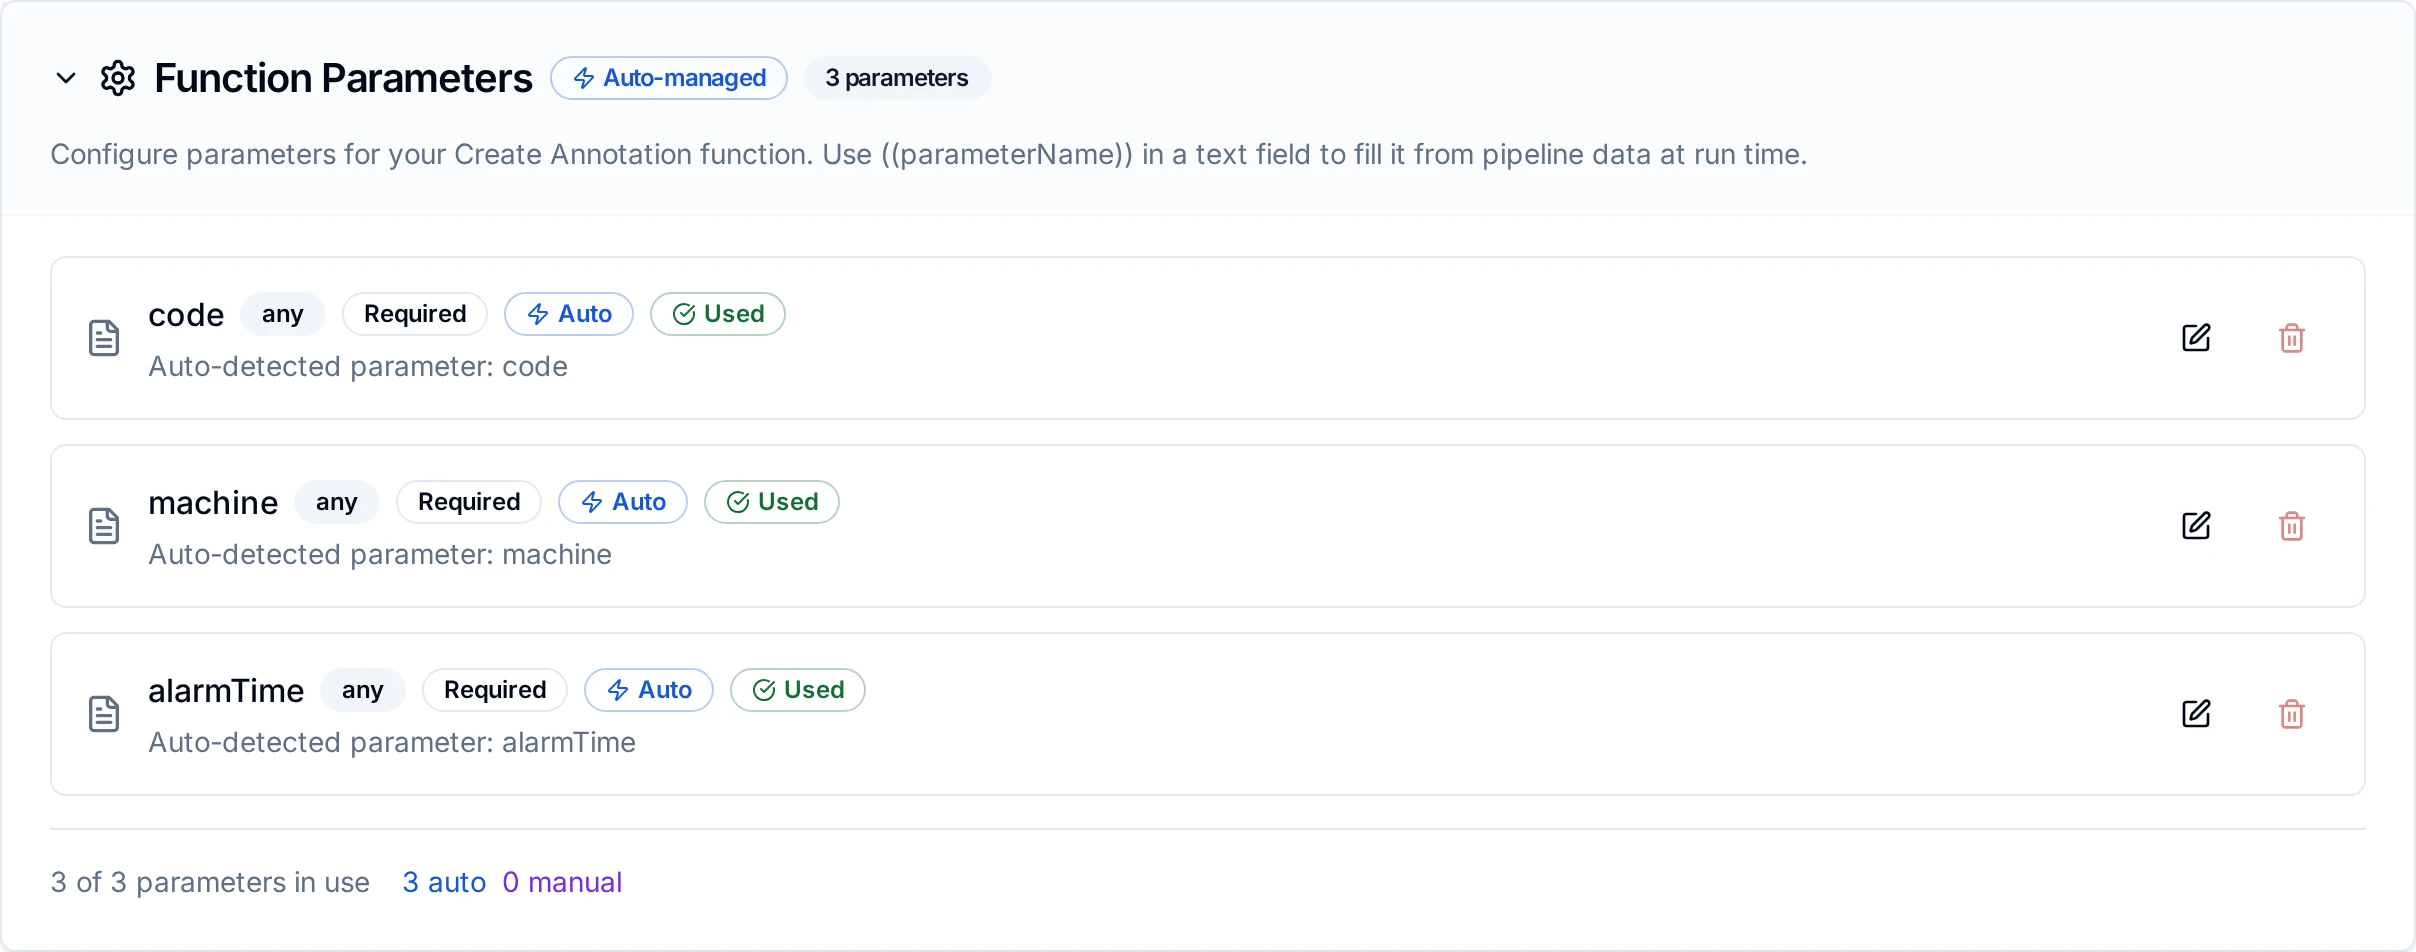
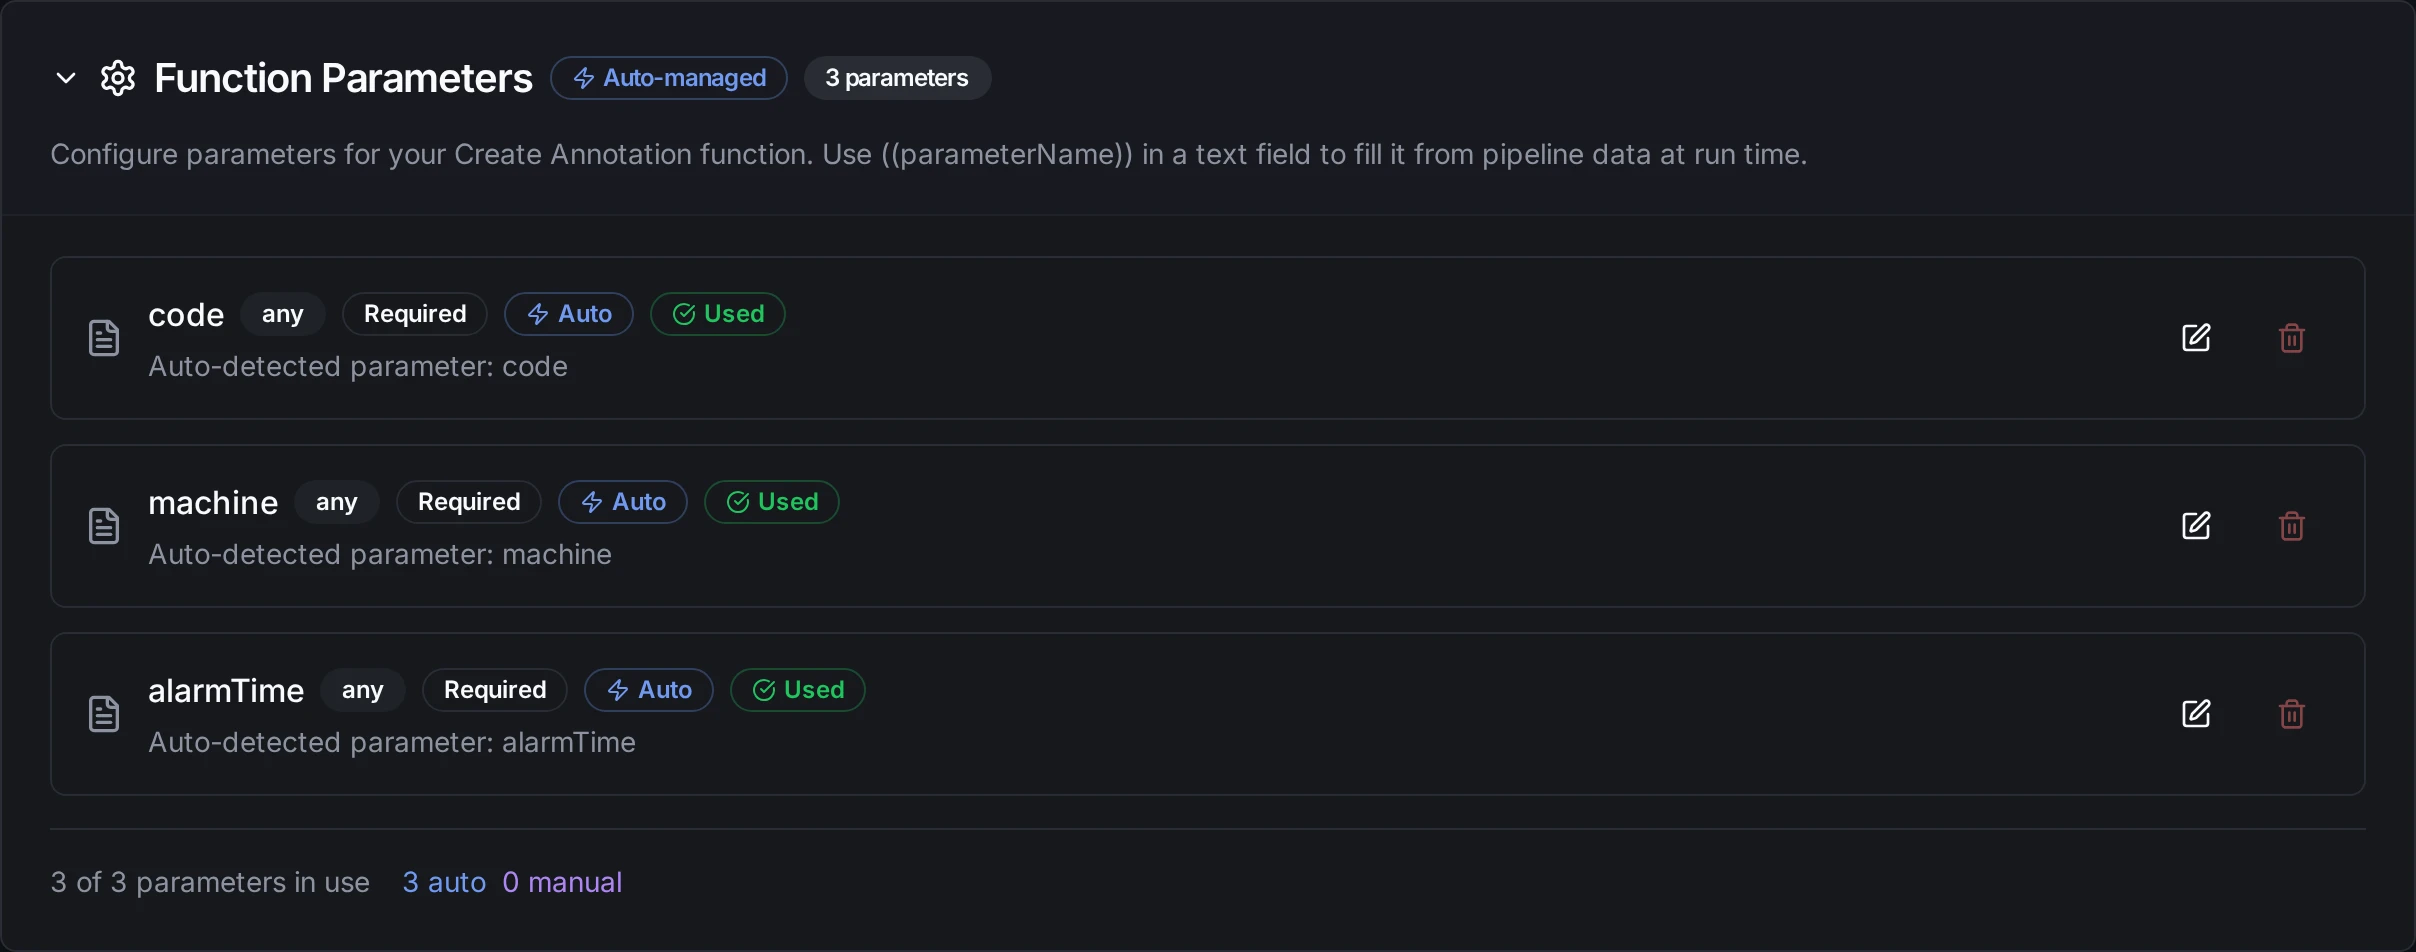
Parameters detected in a Create Annotation function
| Field | Supports Templating |
|---|---|
| Text, Dashboard, Panel ID, Tags, Time, End Time | Yes |
| Timeout | No |
Annotations without a dashboard, and where they show
An annotation with a dashboard shows on that dashboard: Grafana's built-in Annotations & Alerts query shows the dashboard's own annotations.
An annotation without a dashboard belongs to the organization, and no dashboard shows it until one asks for it. To show organization annotations on a dashboard:
- Open the dashboard → Edit → Settings → Annotations → New query
- Data source Grafana, Filter by Tags, and the tags your function sets, for example
line3 - Save the dashboard
This is also how one annotation can appear on several dashboards: tag it, and give each dashboard a tag query.
Pipeline Integration
The function is a node in the Pipeline Designer: Grafana Create Annotation. See the Grafana nodes page for its output.
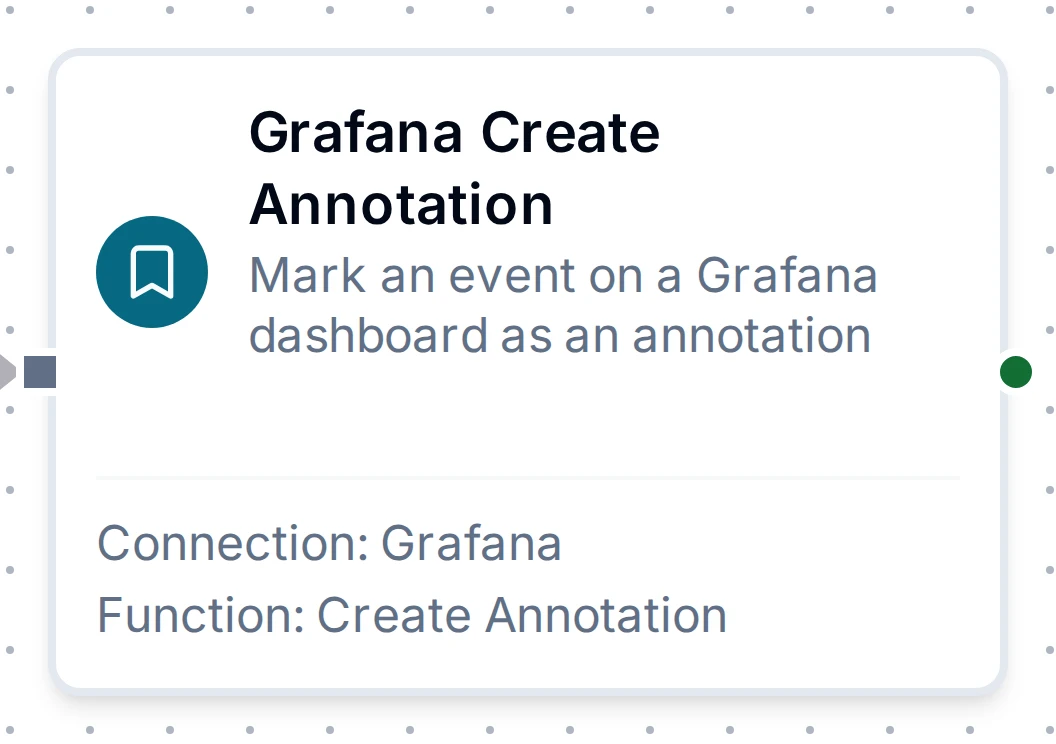
Grafana Create Annotation node
Create Annotation can be buffered by store-and-forward while Grafana is unreachable. Because an annotation carries its own time, one delivered after an outage still sits where the event happened on the chart.
Common Use Cases
Mark each alarm on the line's dashboard
Pipeline Flow:
- OPC UA Monitor trigger on the line's alarm tags
- Condition routes on an alarm becoming active
- Grafana Create Annotation marks it
Function Configuration:
Text: Alarm ((code)) on ((machine)): ((message))
Dashboard: line3-oee
Tags: alarm, line3
Time: ((sourceTimestamp))
Draw a region for every batch
When the batch ends, one annotation covers it from start to end:
Text: Batch ((batchId)), recipe ((recipe))
Dashboard: oven-2
Panel ID: 4
Tags: batch
Time: ((batchStart))
End Time: ((batchEnd))
Troubleshooting
| Problem | Cause and fix |
|---|---|
Test Connection fails with 401 Invalid API key or Unauthorized | The token is wrong, expired or deleted. Create a new token on the service account and paste it into the connection |
401 API key does not belong to the requested organization | The token belongs to another Grafana organization than the one asked for. Use a service account of the organization you annotate |
403 Permissions needed: annotations:create | The service account may not create annotations. Give it Editor, or fixed:annotations:writer, or Edit on the dashboard |
403 Access denied to save the annotation | A Viewer account with Edit on some dashboards annotated another dashboard, or created an organization annotation. Give it Edit on that dashboard too |
dashboard "…" was not found | No dashboard with that UID, or the service account cannot see it. Copy the UID from the dashboard's URL /d/<uid>/… |
| The call succeeds but the dashboard shows nothing | An organization annotation (no dashboard set), or a time outside the dashboard's time range. Set the dashboard, or add a tag query (see above); check the time |
| The marker is in January 1970 | Not possible through MaestroHub: a time in seconds is refused. A marker far from where you expect means the time came from another field; check what ((parameter)) holds |
| Certificate errors on Test Connection | Grafana's certificate is from your own CA: paste that CA under TLS |