Store & Forward
Overview
A pipeline's last step usually writes to something outside MaestroHub — an MQTT broker, a database, a cloud API, an S3 bucket. Those outside systems go down for reasons MaestroHub can't control: a network blip, a maintenance window, a broker restart, an expired credential.
Without protection, every write attempted during that outage is simply gone — no retry, no record, no way to replay it later. For factory-floor telemetry or billable events, that silent loss is exactly what you don't want.
Store & Forward closes that gap. It places a durable buffer between your pipeline and the destination. When the destination is reachable, messages flow straight through. When it isn't, messages pile up safely in the buffer and are delivered automatically — in the original order — the moment the destination recovers. An outage becomes a pause, not a loss.
Navigation Path: Orchestrate > Store & Forward
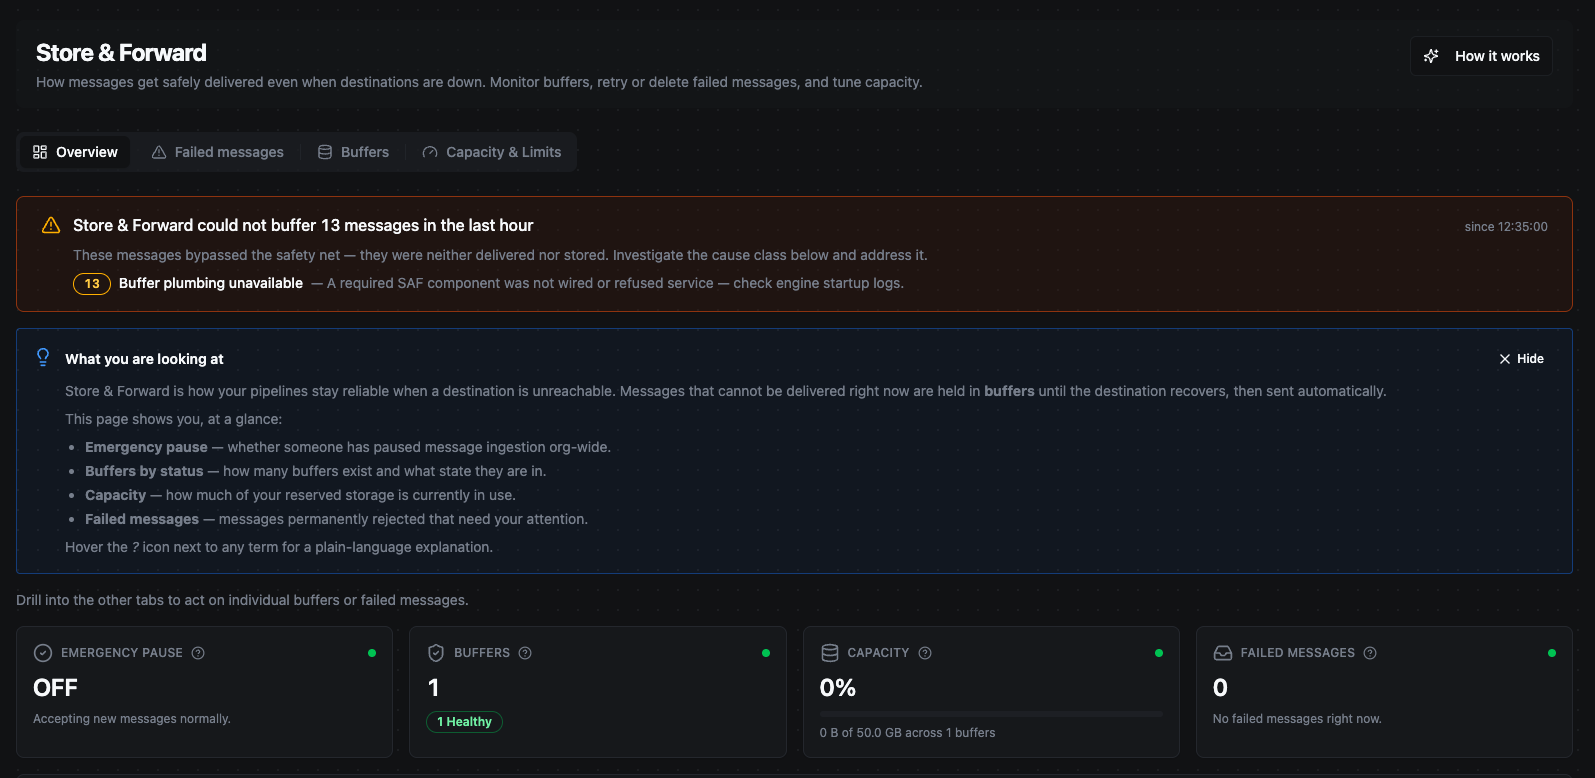
The Store & Forward Overview tab. A healthy system shows zeros everywhere — this page earns its keep on the day a destination goes down.
A healthy Store & Forward page is all zeros. Empty buffers and no failed messages mean every destination is keeping up. This page becomes valuable on the day something goes down and you watch the buffers absorb the outage instead of losing data.
The page header has a How it works button that opens a short, 5-step in-app walkthrough — including an outage simulator you can use to publish messages, take a destination offline, drop a "poison" message, and watch the buffer absorb the outage and drain in order. It's the fastest way to build intuition before a real incident.
Why we built it — the gap it closes
| Without Store & Forward | With Store & Forward |
|---|---|
| A write to a down destination is lost forever. | The write is saved on disk and delivered when the destination is back. |
| You have no record of what failed during an outage. | Every undeliverable message is visible and replayable. |
| One slow destination can stall the whole pipeline. | Each destination is isolated in its own buffer; a slow one can't block the others. |
| A restart or crash of MaestroHub loses anything in flight. | Buffers live on disk and survive restarts and crashes. |
| A bad ("poison") message can jam everything behind it. | Poison messages are set aside so good traffic keeps flowing. |
In short: Store & Forward turns "destinations are unreliable" from a data-loss problem into a routine, observable, recoverable event.
How it works
Store first, then forward
When a pipeline produces a message for an output:
- Store — the message is written to a durable buffer (the "store" step).
- Forward — a background worker continuously reads from the buffer and delivers each message to the destination (the "forward" step).
- If delivery succeeds, the message is removed from the buffer. If it fails, it stays and is retried.
How aggressively step 1 is used depends on the mode you choose per output node (see Choosing a mode below). In the default mode, MaestroHub tries the destination directly first and only starts buffering once a write actually fails — so on the "happy path" there's no extra overhead.
Buffers live on disk
Buffered messages are written to disk, not just held in memory. This is what makes the feature trustworthy: if MaestroHub restarts or crashes while a destination is down, the buffered messages are still there when it comes back up and delivery resumes automatically. Messages are only ever lost if you explicitly delete them or the underlying storage is destroyed.
One buffer per output, not one big queue
The buffer isn't a single org-wide queue. Every (pipeline, output node) pair gets its own buffer. This isolation matters:
- A slow or down destination only fills its buffer. Other destinations keep delivering normally.
- One destination can never reorder, starve, or block another's traffic.
- The Buffers tab is simply the list of these per-output buffers.
Example: A pipeline writes to both MQTT and Postgres. Postgres goes down. The Postgres buffer fills up while the MQTT buffer keeps delivering — the slow destination is isolated to its own row.
Only writes are buffered — never reads
Only write-type operations (publish, insert, call) are eligible for buffering. Reads and lookups never route through a buffer — buffering a read would hand the next step in your pipeline a "saved OK" acknowledgement instead of the actual query result, which would silently corrupt your data. MaestroHub enforces this automatically; there's nothing to configure.
See it in action: a database outage from start to finish
The quickest way to understand Store & Forward is to watch it absorb a real outage. Take a simple pipeline that writes one quality-check record to a PostgreSQL table every few seconds, using the default Buffer only on failure mode.
1. Normal operation — nothing to see
While the database is reachable, every record is written straight through. Rows land in the table, and the Buffers tab stays empty. This is the steady state: on the happy path Store & Forward adds no buffer and no overhead — there's simply nothing to show.
2. The destination goes down — a buffer appears and fills
Now the database goes offline (a restart, a network blip, a maintenance window). The very next write can't reach it, so Store & Forward steps in: a buffer is created for that one (pipeline → output node) pair, and every following record is stored safely on disk instead of being lost. On the Buffers tab you can watch the buffer's pending count climb with each run while the destination stays down — yet the pipeline itself keeps reporting success, because the data is already durably captured.
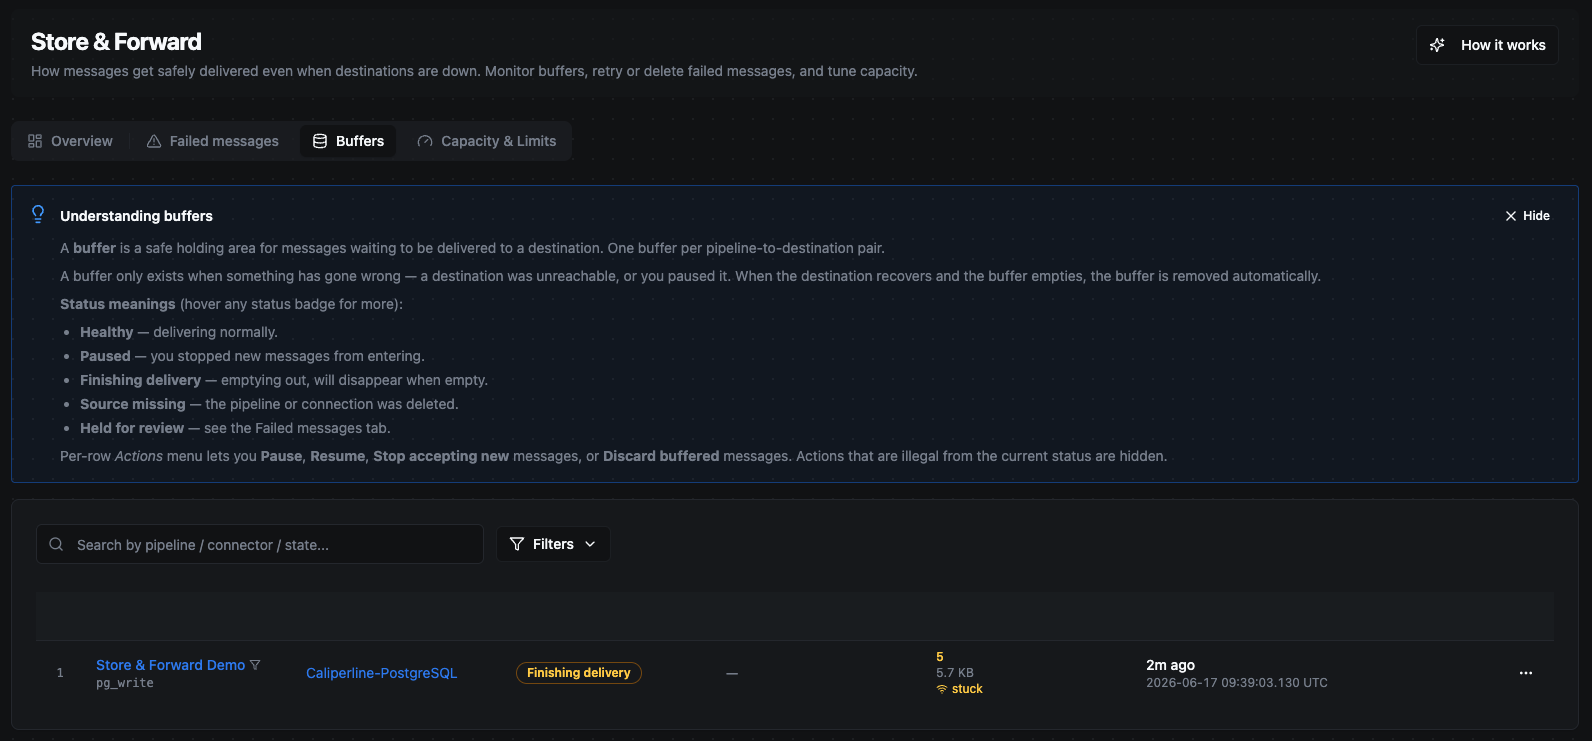
During the outage a buffer appears for the database write, and its pending count climbs every few seconds. The pipeline keeps running — nothing is lost, the messages are just waiting on disk.
3. The destination recovers — the buffer drains in order
The moment the database comes back, the background forwarder starts delivering the backlog automatically — in the original order — without anyone touching the pipeline. The buffer's pending count falls back to zero, and once it's empty the buffer retires itself.
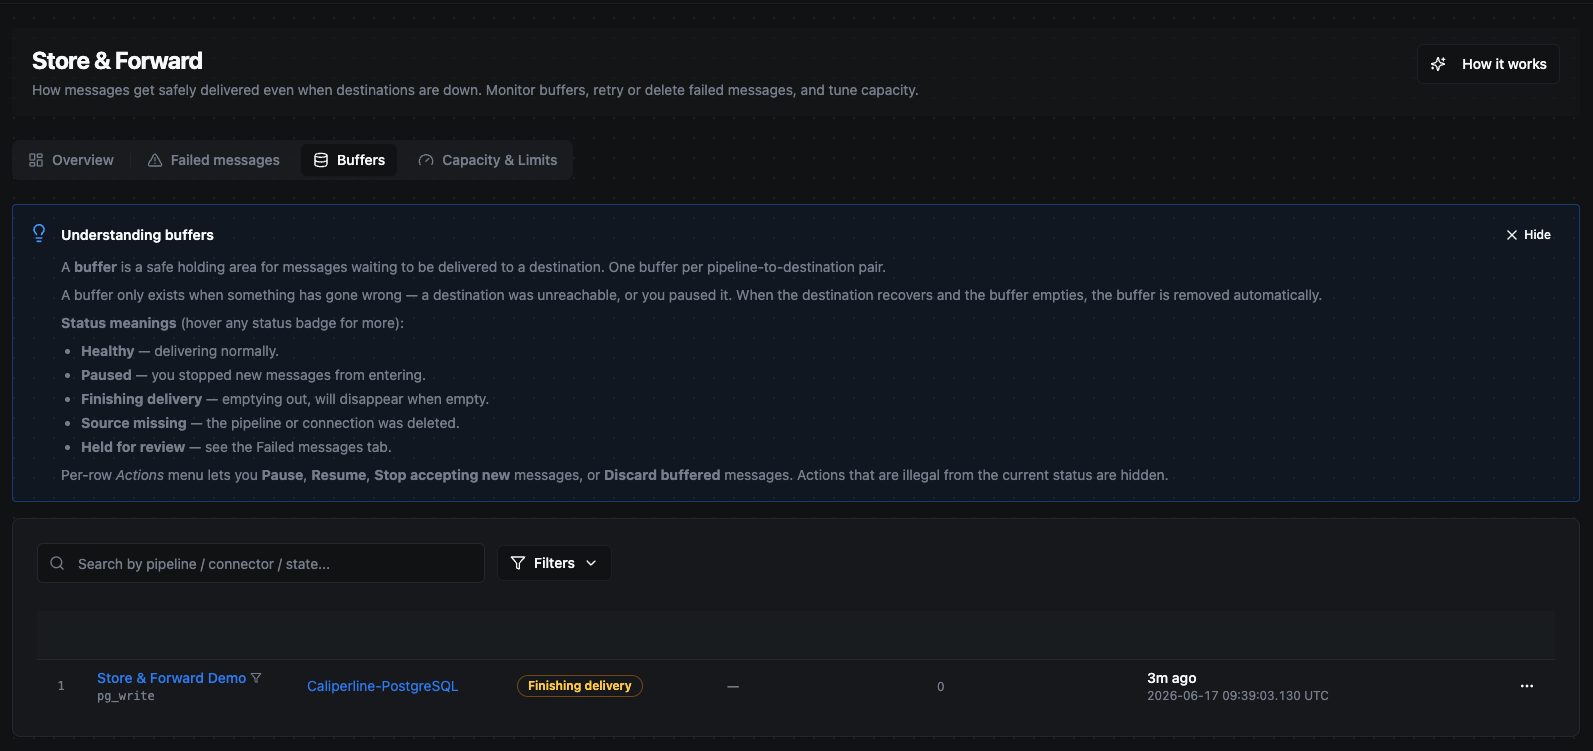
As soon as the connection is re-established, the buffer drains automatically and its pending count falls back to zero. The outage became a pause, not a loss.
The takeaway
Count the rows in the destination table afterward and the records produced during the outage are all there, in sequence — the outage shows up only as a brief delay in when they arrived, never as a gap in the data. That one round-trip — fill on failure, drain on recovery — is the whole promise of Store & Forward.
Choosing a mode (per output node)
Each output node decides how it uses Store & Forward. You set this in the node's configuration panel in the Pipeline Designer, and it's chosen per node — different destinations in the same pipeline can use different modes.
Where to find it: the mode selector appears on any node that writes to a destination — publishing to a broker, inserting into a database, calling an API, sending to a cloud service, and so on. Open the node in the Pipeline Designer and look for the Delivery mode option in its configuration (under the node's advanced / Store & Forward options). You won't see it on nodes that only read data or that don't talk to an outside destination, since those are never buffered.
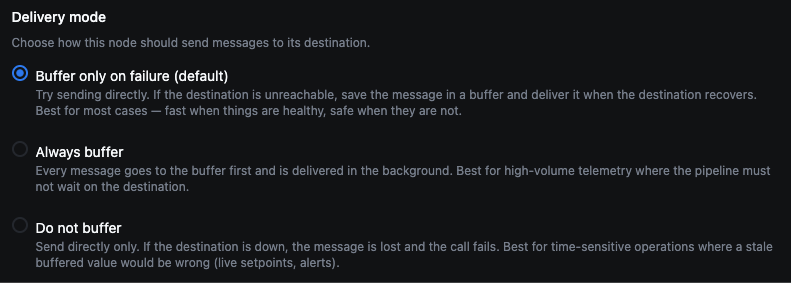
The Delivery mode selector in an output node's configuration. This is one example — the same option appears on any node that writes to a destination.
| Mode | What it does | Best for |
|---|---|---|
Buffer only on failure (default — on_failure) | Tries the destination directly first. Only if the write fails does it save the message to a buffer and deliver it when the destination recovers. Lowest latency on the happy path. | Most cases. Command/control, low-volume state updates, anything where latency matters and you still want a safety net. |
Always buffer (always) | Every message goes through the buffer first and is delivered in the background. This fully decouples your pipeline's speed from the destination's speed. | High-volume telemetry where you never want the pipeline to wait on the destination. |
Do not buffer (off) | Sends directly only. If the destination is down, the message is lost and the call fails. | Best-effort telemetry where occasional loss is acceptable. Never use for billable or critical events. |
If you don't choose anything, the node uses Buffer only on failure.
After a failure in the default mode, that output keeps buffering subsequent messages (instead of trying directly again) until its buffer fully drains. This is deliberate — it preserves the original order of your messages.
When and how it delivers — retries, failed messages, and the brakes
When a destination misbehaves, three mechanisms decide what happens next. Together they guarantee every message has a predictable landing place: delivered, failed, or paused for an operator.
Retries
- Temporary errors (timeouts,
503s, connection refused) are retried automatically with backoff — increasing waits between attempts — up to a per-buffer cap (10 attempts by default). - Rate-limited responses wait exactly as long as the destination asks before retrying, without burning an attempt.
This handles the most common case: a destination that's briefly unavailable and then comes back.
Failed messages (the triage inbox)
Some messages can't be saved by retrying:
- Permanent failures —
4xxerrors, schema/validation rejections, contract mismatches ("poison" data). - Retry-exhausted messages that hit the attempt cap.
These land in Failed messages (internally a dead-letter queue, or DLQ) with the failure reason attached. Crucially, a poison message is set aside here instead of jamming the buffer behind it — delivery keeps flowing past it.
From the Failed messages tab an operator can:
- Replay a message (single or in bulk) after fixing the underlying cause.
- Purge messages that are genuinely unwanted (single or in bulk).
Failed messages are kept for 30 days by default, with a cap of 10,000 entries per buffer so a flood can't fill the disk.
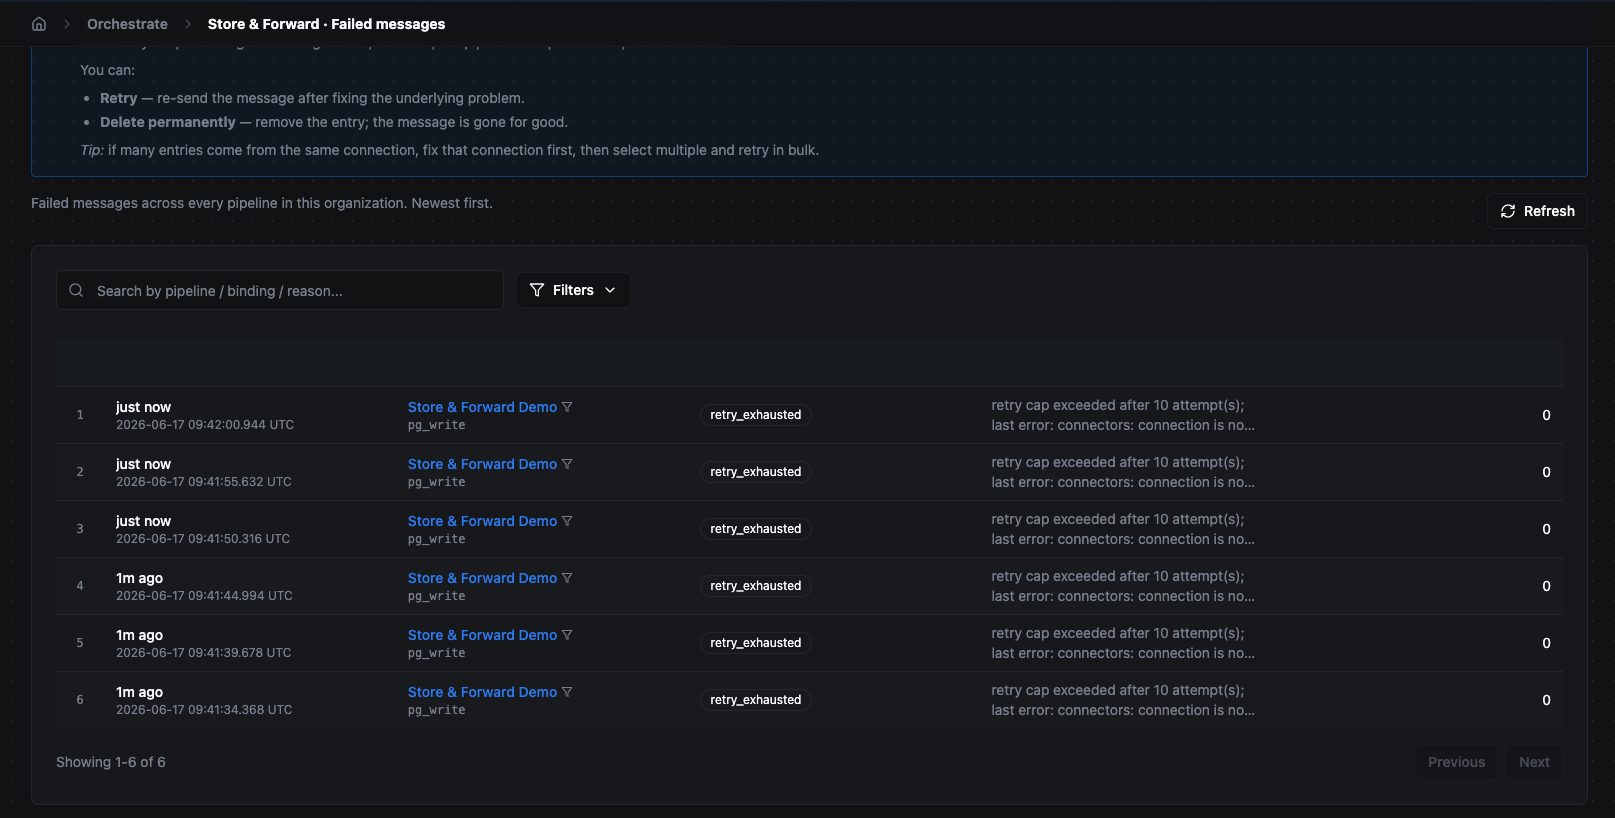
The Failed messages tab — the triage inbox. Filter by reason, replay after fixing upstream, or purge poison batches.
The brakes
When you need to intervene, you have manual controls:
Per buffer:
- Pause — stop accepting new messages into this buffer; keep delivering what's already queued.
- Drain — stop accepting new messages and deliver the backlog, then retire the buffer.
- Purge — drop the buffer's contents.
Org-wide:
- Emergency pause (the kill switch) — stops all new buffering across the organization while letting already-queued messages continue draining. Use it when a destination is making things worse and you need everything to stop accepting new writes immediately. Every toggle is recorded (who, when), and replaying failed messages is blocked until you resume.
Every state change a buffer goes through is audited. You can always see who paused, drained, purged, or resumed — and when. (See Where to see what happened below.)
When Store & Forward itself can't buffer
Very rarely, the safety net itself can't accept a message — meaning the message was neither delivered nor stored. If this happens, the Overview tab shows a prominent amber banner: "Store & Forward could not buffer N message(s) in the last hour." The banner breaks down the cause so you know what to fix:
| Cause shown | What it means | What to do |
|---|---|---|
| Capacity exhausted | The disk pool ran out of room. | Raise the capacity pool, or shrink an existing reservation. The banner links straight to Capacity & Limits. |
| Substrate error | The underlying buffer broker refused the write. | Check the broker's health and the engine logs. |
| Buffer plumbing unavailable | A required Store & Forward component wasn't available. | Check the engine startup logs. |
| Internal error | An unexpected engine error while buffering. | Check the engine logs for the root cause. |
This banner is the one signal that data may actually have been lost, so it's worth acting on immediately. On a healthy system it never appears.
Capacity — where the buffers' space comes from
All buffers draw from one org-wide disk pool. You don't have to size each buffer by hand — most of this is automatic, and there's only one number most operators ever touch.
The org-wide pool (the one number you control)
There's a single total disk budget shared by every buffer in your organization. It defaults to 50 GiB and is the main thing an operator decides. You can change it any time from the Capacity & Limits tab; the Overview tab shows a gauge of how much of it is currently in use. For most installations the default is plenty and you'll never need to change it.
Each buffer's size is automatic
You do not have to assign a size to each buffer. When an output first needs to buffer, MaestroHub creates that buffer automatically with a per-buffer cap of 256 MiB by default. Every buffer draws the space it actually uses from the shared pool as messages arrive, and gives it back as they drain. So in a typical setup, the only capacity decision is the total pool above — everything below it takes care of itself.
Optional: reserve space for a critical destination (guarantees)
By default no buffer has space reserved for it — they all compete fairly for the shared pool. If you have a destination you never want to be squeezed during a busy outage, you can give its buffer a guarantee: a slice of the pool reserved just for it, that no other buffer can take. This is optional and set per buffer; you only do it for the destinations that matter most.
The leftover is a shared "burst" reserve
Whatever isn't reserved by guarantees is a shared burst pool. Any buffer can borrow from it during a bad outage — so a single destination going down can use far more than its everyday footprint — and release it once it drains. The system computes this automatically; there's nothing to set.
Optional: per-organization quota (multi-tenant setups)
If several organizations share one MaestroHub, you can cap how much of the global pool any single org's buffers may reserve. This is the Your org's quota card in the Capacity & Limits tab, where you can set, edit, or clear a quota. With no quota set, an org is bounded only by the global pool minus what other orgs have reserved. A quota only limits reservations (guarantees) — the shared burst pool stays best-effort across tenants. Most single-org installations never need this.
The total pool is read from configuration at startup (and editable any time afterward). Each buffer's size is decided automatically when the buffer is first created — using its guarantee if you set one, otherwise the 256 MiB default. Burst availability is recalculated continuously. The only values an operator sets are the total pool and, optionally, per-buffer guarantees.
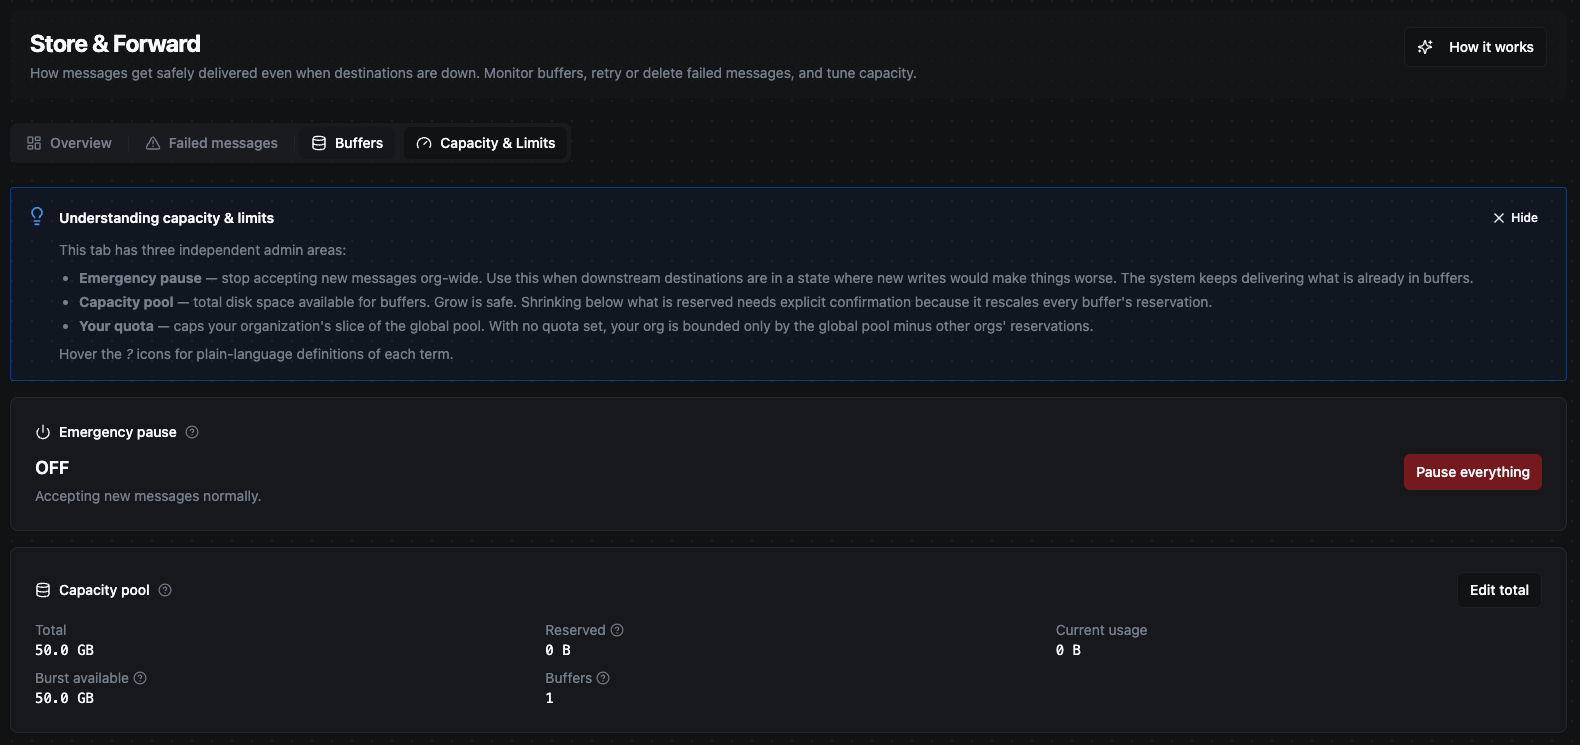
The Capacity & Limits tab: the org-wide disk pool with the portion in use, per-buffer guarantees, the per-org quota, and the recent activity log.
What happens when a buffer fills up
Nothing grows without a limit you chose. When a buffer reaches its capacity, its drop policy decides what happens — and no loss is ever silent:
| Drop policy | Behavior |
|---|---|
| Drop oldest (default) | Evict the oldest message to make room for the new one. |
| Reject new | Refuse new messages until space frees up. |
| Dead-letter new | Send new messages straight to Failed messages instead of dropping them. |
The four tabs at a glance
| Tab | What it's for |
|---|---|
| Overview | "Is anything stuck?" — the one-glance answer. Emergency pause state, buffers grouped by status, capacity gauge, failed-message count, and the destinations with the most pending messages. |
| Failed messages | The triage inbox. Filter by reason, replay after fixing the cause, or purge poison batches — single or in bulk. |
| Buffers | Every per-output buffer with its depth (pending messages/bytes), age of the oldest message, drain rate, and per-buffer actions (pause / drain / purge / replay). |
| Capacity & Limits | Size the org-wide disk pool, set per-buffer guarantees, manage a per-org quota, find the emergency pause, and review the recent Activity (audit) log. |
Viewing every tab is open to anyone with access to the page. Making changes — pausing, draining, purging, replaying, editing capacity or quotas, toggling the emergency pause — requires the durability:write permission. Without it the page is read-only: the action menus and buttons are hidden, but you can still see the full picture and the activity log.
Buffer states and what they mean
A buffer moves through a small set of lifecycle states. Most of the time you'll only see Healthy. The labels below are exactly what the UI shows (the technical name is in parentheses).
| Status (UI label) | Meaning |
|---|---|
| Healthy (active) | Accepting and delivering messages normally. |
| Paused (paused) | You stopped accepting new messages; the queued backlog still drains. |
| Finishing delivery (draining) | No longer accepting new messages — delivering what's queued, then the buffer goes away. |
| Source missing (orphaned) | The pipeline or connection was deleted. The buffer isn't silently discarded — it's parked for a day so you can deliberately recover or discard it. |
| Held for review (dead-letter) | Couldn't deliver after the orphan window expired; remaining messages were moved to Failed messages. |
| Removed (dead) | The buffer was removed. Its history is kept in the audit log. |
Health (operational hints)
Separate from the lifecycle state, a healthy buffer can still be operationally stuck. When available, the Buffers tab shows a Health badge — click it for the reason, when it started, and the last successful delivery:
| Health (UI label) | Meaning |
|---|---|
| Healthy | Messages flowing — delivery completed recently. |
| Idle | Nothing queued and the destination is fine — a quiet topic, no action needed. |
| Blocked | The destination connection isn't delivering. Fix the named connection to unstick it. |
| Stalled | Messages are queued and the destination looks healthy, but nothing is draining — escalate. |
| No input (starved) | Nothing is arriving from upstream. The upstream connection is likely unhealthy. |
| Measuring… (unknown) | Not enough signal observed yet; usually clears within ~30 seconds. |
Where to see what happened — the activity log
Every consequential action is recorded: each emergency-pause flip, capacity edit, buffer state change, and Failed-messages purge. The Capacity & Limits tab has an Activity card showing the most recent events — when, who (the actor), the action, the result (success / denied / failed), and details — with a View full audit log link for the complete history. This is read-only and visible to everyone, so anyone can see what changed without needing write access.
Edge cases worth knowing
- MaestroHub restarts during an outage. Buffered messages are on disk; they're still there after the restart and delivery resumes automatically.
- A poison message in the middle of the queue. It's moved to Failed messages rather than blocking the queue — good traffic behind it keeps delivering. Fix the cause, then replay it.
- The destination is rate-limiting you. MaestroHub honors the requested delay instead of hammering the destination or wasting retry attempts.
- A pipeline or connection is deleted while its buffer still has messages. The buffer becomes Orphaned and is kept for a day so the data isn't lost by accident — recover or purge it deliberately.
- A buffer fills to capacity. Its drop policy decides the outcome (drop oldest / reject new / dead-letter new). The loss is never silent — it's the policy you chose, and it's visible.
- Emergency pause is on and you try to replay failed messages. Replays are blocked until you resume — so you don't reintroduce traffic into a system you just told to stop.
- You pick "Do not buffer" (
off). There's no safety net — a write to a down destination is lost and the call fails. Reserve this for best-effort telemetry only. - Reads are never buffered. Even in "Always buffer" mode, lookups/reads always go directly to the destination so downstream steps get the real result.
- A replay was interrupted by a crash. If the engine crashed mid-retry, the message may have reached the destination or may not. The detail view flags this — check the destination before retrying again, because a blind retry can create a duplicate.
- A message was retried too many times. Further automatic retries are blocked to avoid loops; the entry is flagged in Failed messages. Fix the root cause and retry deliberately, or delete it.
- Someone else is already replaying an entry. While a replay is in progress the Retry button is disabled for that entry; if it appears stuck for more than a few minutes, it clears on the next engine restart.
- Bulk retry / delete in Failed messages. Bulk actions handle up to 100 entries per request; select fewer if you have more, and repeat. The result is summarized (replayed / skipped / failed).
- Store & Forward couldn't buffer at all. See When Store & Forward itself can't buffer — this is the one case where data can actually be lost, and the Overview banner tells you the cause.
Defaults reference
| Setting | Default |
|---|---|
| Mode (per output node) | Buffer only on failure (on_failure) |
| Storage | On disk (survives restarts) |
| Org-wide disk pool | 50 GiB |
| Per-buffer size cap (when no guarantee set) | 256 MiB |
| Per-buffer guarantee | None (0 — optional, set per buffer) |
| Retry attempts before failing | 10 |
| Failed-message retention | 30 days |
| Failed-message cap per buffer | 10,000 entries |
| Drop policy when a buffer is full | Drop oldest |
| Orphaned-buffer retention | 24 hours |
Related
- Pipelines — where output nodes (and their Store & Forward mode) are configured.
- Dependency Graph — see which pipelines write to which connections.