Dependency Graph
Overview
The Dependency Graph is an interactive visualization that maps every entity in your MaestroHub workspace — pipelines, connections, functions, UNS topics, and dashboards — and the dependencies between them. Use it to understand how your system is wired together, trace the impact of a change before making it, and identify unused or isolated resources.
Navigation Path: Orchestrate > Dependency Graph
The Dependency Graph showing pipelines, connections, functions, topics, and dashboards as an interconnected map.
Entity Types
Each node in the graph represents one of five entity types. Every type has a distinct color so you can identify it at a glance.
| Entity Type | Color | Description |
|---|---|---|
| Pipeline | Blue | A workflow in the Pipeline Designer. |
| Connection | Green | A configured connector profile (MQTT, OPC UA, Modbus, etc.). |
| Function | Orange | A reusable function defined within a connection. |
| Topic | Purple | A UNS topic path. |
| Dashboard | Pink | A UNS dashboard. |
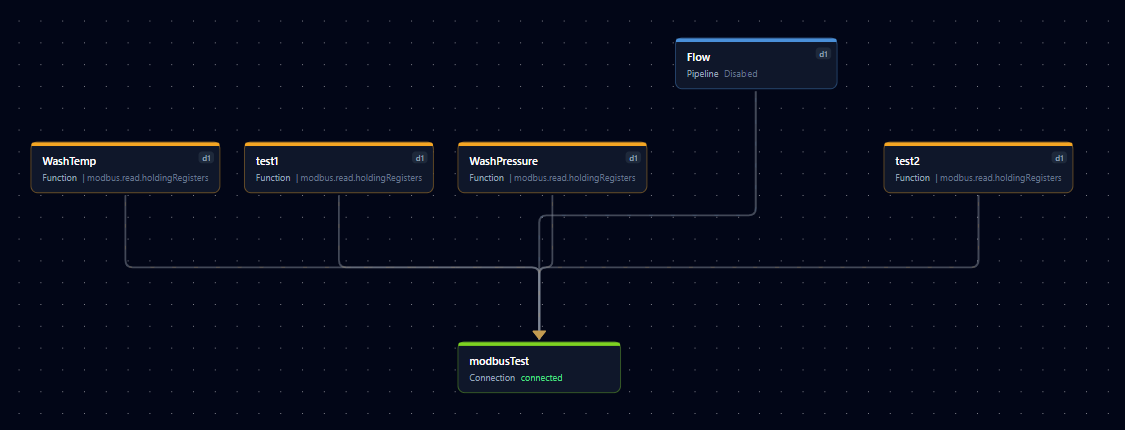
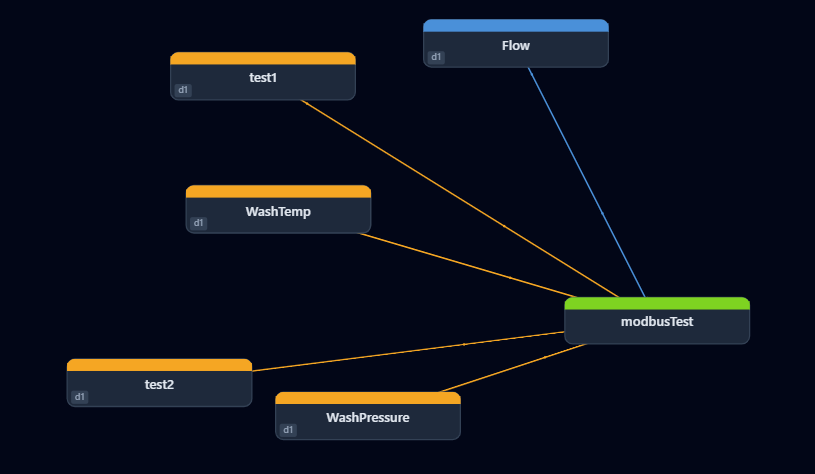
Edges (arrows) between nodes show a dependency relationship — the arrow points from the entity that depends on another toward the entity it depends on (e.g., a pipeline node pointing to the connection it reads from).
Layout Modes
The toolbar offers two layout modes. Your choice is remembered across sessions.
Hierarchical Layout (Default)
The Hierarchical layout arranges nodes in a structured top-to-bottom hierarchy based on dependency depth. Pipelines appear at the top, and the entities they depend on flow downward. This layout is best for understanding cause-and-effect chains and tracing data flow in a structured way.
Hierarchical layout: entities are arranged top-to-bottom by dependency level.
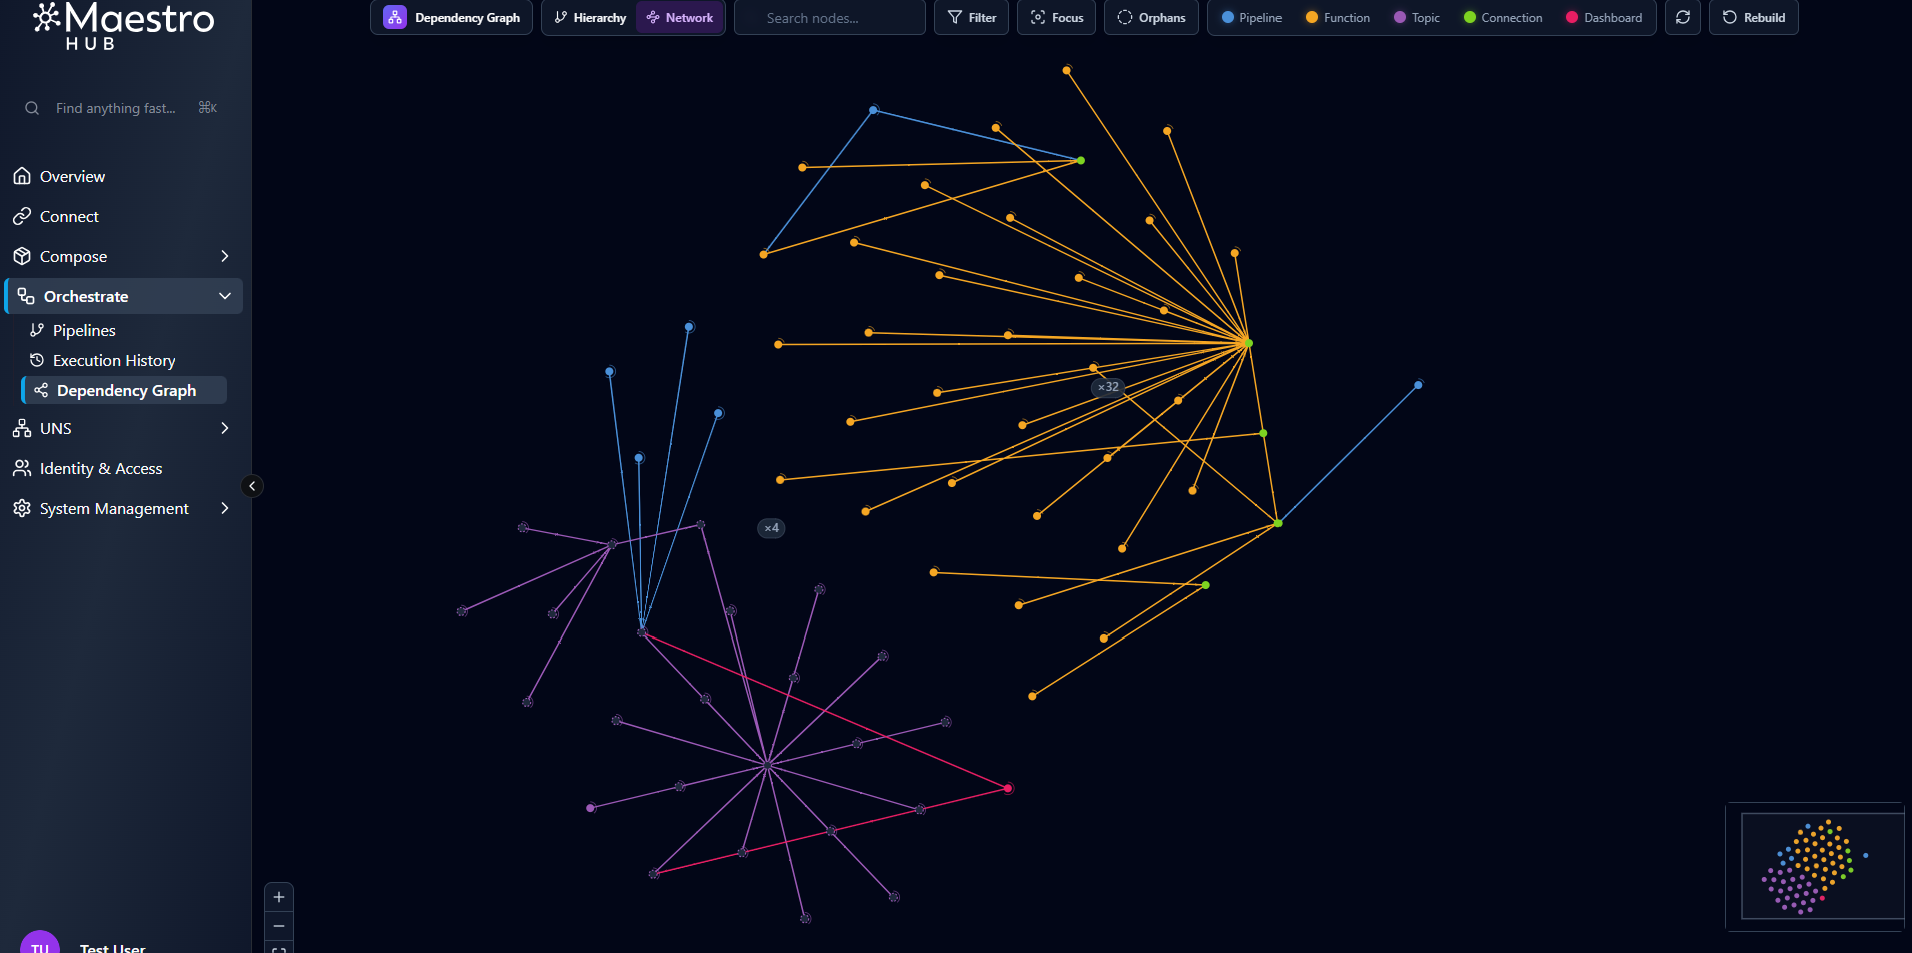
Network Layout
The Network layout uses a force-directed simulation to group entities by type into spatial clusters. Pipelines appear at the top, connections to the right, functions to the left, and topics and dashboards at the bottom. This layout is best for exploring the overall structure of a large workspace and identifying clusters of related entities.
Network layout: entities cluster by type with force-directed positioning.
Switch between layouts using the Layout toggle button in the toolbar.
Navigating the Graph
Zoom and Pan
| Action | How |
|---|---|
| Pan | Scroll wheel (free direction), or middle-click drag |
| Zoom in / out | Ctrl / Cmd + scroll wheel, pinch gesture, or the + / − buttons (bottom-left controls) |
| Fit all nodes to view | Click the Fit button in the bottom-left controls |
| Lock / unlock interactivity | Click the Lock toggle in the bottom-left controls to prevent or allow node dragging |
The graph uses Level of Detail (LOD) rendering: when zoomed out, nodes appear as colored dots to keep the canvas performant with thousands of entities. As you zoom in, nodes expand into labeled cards showing the entity name, type color, and a depth indicator.
Minimap
A minimap in the corner of the Network layout shows your current viewport position relative to the full graph. Click or drag within the minimap to quickly jump to a different area.
Searching
Use the Search bar in the toolbar to find any entity by name, ID, or type.
- Matching nodes are highlighted with a gold glow.
- Use the ↑ ↓ arrows beside the search bar to cycle through all matches one by one. The graph automatically pans and zooms to center each match.
- The match counter shows your current position (e.g., 3 / 12).
- Click ✕ or clear the search field to dismiss the search state.
Filtering
Click the Filters button in the toolbar to show or hide specific entity types.
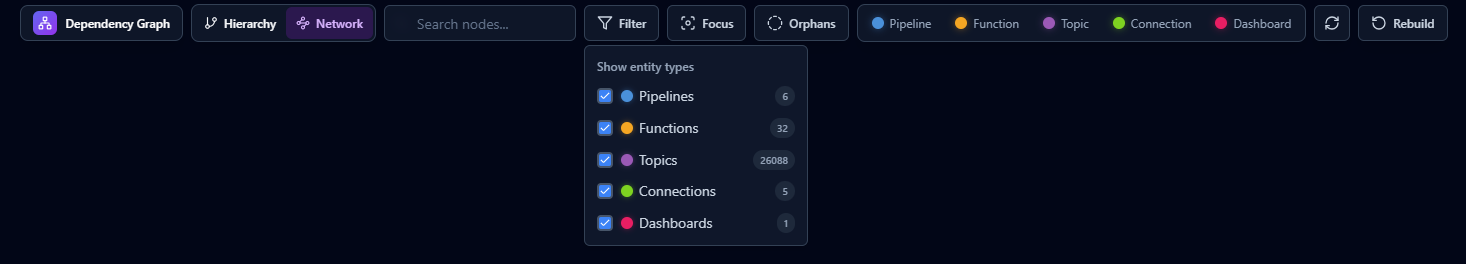
Filter panel: toggle individual entity types on or off, and control orphan visibility.
| Filter | Description |
|---|---|
| Pipeline | Show or hide all pipeline nodes. |
| Connection | Show or hide all connection nodes. |
| Function | Show or hide all function nodes. |
| Topic | Show or hide all UNS topic nodes. |
| Dashboard | Show or hide all dashboard nodes. |
| Show Orphans | When enabled, shows entities that have no connections to any other entity. Orphans are hidden by default. |
Disabling a type also removes all edges connected to nodes of that type from the view.
Hover Highlighting
Hover over any node to highlight its dependency chain.
- The hovered node is shown at full brightness.
- Its direct neighbors (1 hop) appear slightly dimmed.
- 2nd- and 3rd-degree connections are progressively more dimmed.
- All unrelated nodes are faded to near-invisible.
This makes it easy to trace which entities a given pipeline depends on, or which pipelines would be affected if a connection were changed, without clicking into any detail view.
Focus Mode
Focus Mode restricts the graph to show only a selected node and its direct neighbors, hiding everything else. This is useful when working with a very large graph and you want to concentrate on one entity without visual noise.
- Enable Focus Mode by clicking the Focus toggle in the toolbar.
- Click a node to make it the focus. Only that node and its immediate connections remain visible.
- The Focus Mode Indicator at the top of the canvas shows the current focus target.
- Click Exit Focus in the indicator to return to the full graph.
Topic Tree Grouping
UNS topics follow hierarchical paths (e.g., factory/line-1/machine-3/temperature). When many topics share a common path prefix, the graph automatically collapses them into a Topic Group node to reduce clutter.
- A Topic Group node displays a count badge showing how many topics are contained within it, and uses a dashed border to distinguish it from individual topic nodes.
- Click a Topic Group to expand it and see the individual topics inside.
- Click it again to collapse it back.
Node Detail Panel
Click any non-group node to open the Detail Panel on the right side of the screen.
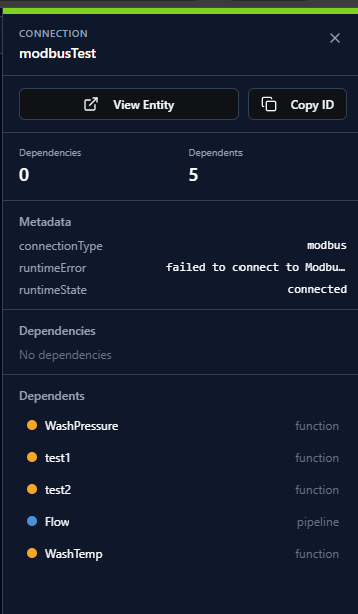
Detail panel showing the selected entity's information, what it depends on, and what depends on it.
The Detail Panel shows:
- Entity name and type
- Dependencies — the entities this node directly depends on (e.g., the connections used by a pipeline)
- Dependents — the entities that directly depend on this node (e.g., pipelines that use this connection)
Click View Entity in the panel (or from the right-click context menu) to navigate directly to that entity's configuration page.
Context Menu
Right-click any node to access quick actions without opening the full detail panel.
| Action | Description |
|---|---|
| Focus | Enters Focus Mode centered on this node. |
| View Entity | Navigates to the entity's configuration page. |
| Expand / Collapse Group | For Topic Group nodes: expands or collapses the topic hierarchy. |
Breadcrumb Trail
As you click through nodes, a breadcrumb trail appears at the top of the canvas recording your navigation path (up to 8 nodes). Click any entry in the trail to jump back to that node's Detail Panel.
Graph Statistics
The toolbar displays live graph statistics:
| Stat | Description |
|---|---|
| Total Nodes | Total number of entities currently visible in the graph. |
| Total Edges | Total number of dependency relationships currently visible. |
Statistics update automatically when entities are added, updated, or removed anywhere in the system.
Live Updates
The Dependency Graph stays in sync with your workspace automatically. When any entity is created, updated, or deleted — in any part of MaestroHub — the graph refreshes in the background within seconds without requiring a manual page reload.
Rebuilding the Graph
In rare cases (for example, after a data migration or system restore), the graph index may become out of sync with the actual state of your workspace. Administrators can trigger a full graph rebuild from the toolbar.
The Rebuild Graph action is only available to users with administrator privileges.
- Click the Rebuild button in the toolbar.
- Confirm the action in the dialog that appears.
- A progress indicator shows rebuild status. The graph refreshes automatically when the rebuild completes.
Rebuilding re-scans every pipeline, connection, function, topic, and dashboard in the system and reconstructs all dependency relationships from scratch.
Depth Indicator
Each node card displays a small depth badge (e.g., d2, d4) in its bottom-left corner. This number represents the maximum transitive dependency chain depth for that entity — how many dependency hops exist from that node to its deepest downstream dependency.
A depth of d0 means the entity has no dependencies. A high depth value (e.g., d5) indicates the entity sits at the top of a long dependency chain.
- Use Hierarchical layout when tracing a specific pipeline's data flow from source to output.
- Use Network layout when exploring the overall shape of your workspace and spotting isolated clusters.
- Enable Show Orphans periodically to identify connections or functions that are no longer used by any pipeline.
- Use Focus Mode on a connection before making configuration changes to quickly see which pipelines will be affected.