Can we trust the numbers?
Questions about whether a number in MaestroHub can be believed, and how to check it yourself. All questions
How do you measure data quality?
Available
Every value MaestroHub stores is good, uncertain or bad, with a reason. The worst verdict from the source, the pipeline and MaestroHub's own checks wins. On top of that, each signal shows whether it is arriving, late or silent.
Three levels, always with a reason
- Good: the source and every check agree the value can be used.
- Uncertain: usable with care, for example a value that has not changed for longer than its meaning allows (frozen).
- Bad: do not use, for example a value outside its meaning's range, or the last value of a device that stopped answering.
The reason comes from a fixed list (out of range, wrong shape, frozen, stale, communication error, out of service and others), so it can be filtered and counted. A stored value keeps its quality; history is not judged again later.
Who decides
| Source of the verdict | What it can say |
|---|---|
| The device or system that sent it | Its own quality, where it has one (OPC UA status codes, for example). MaestroHub never makes it better. |
| The pipeline that produced it | A function can mark its output uncertain or bad, with a reason. A value computed from inputs is never better than its worst input. |
| MaestroHub's checks on the topic | A value of the wrong type is refused. A value out of range or of the wrong shape is stored as bad; a frozen or stale one as uncertain. On a branch whose validation rule is Enforce, a value that breaks its rules is refused instead. |
Alarms never change quality: an alarm says the value is high, quality says whether the value can be believed.
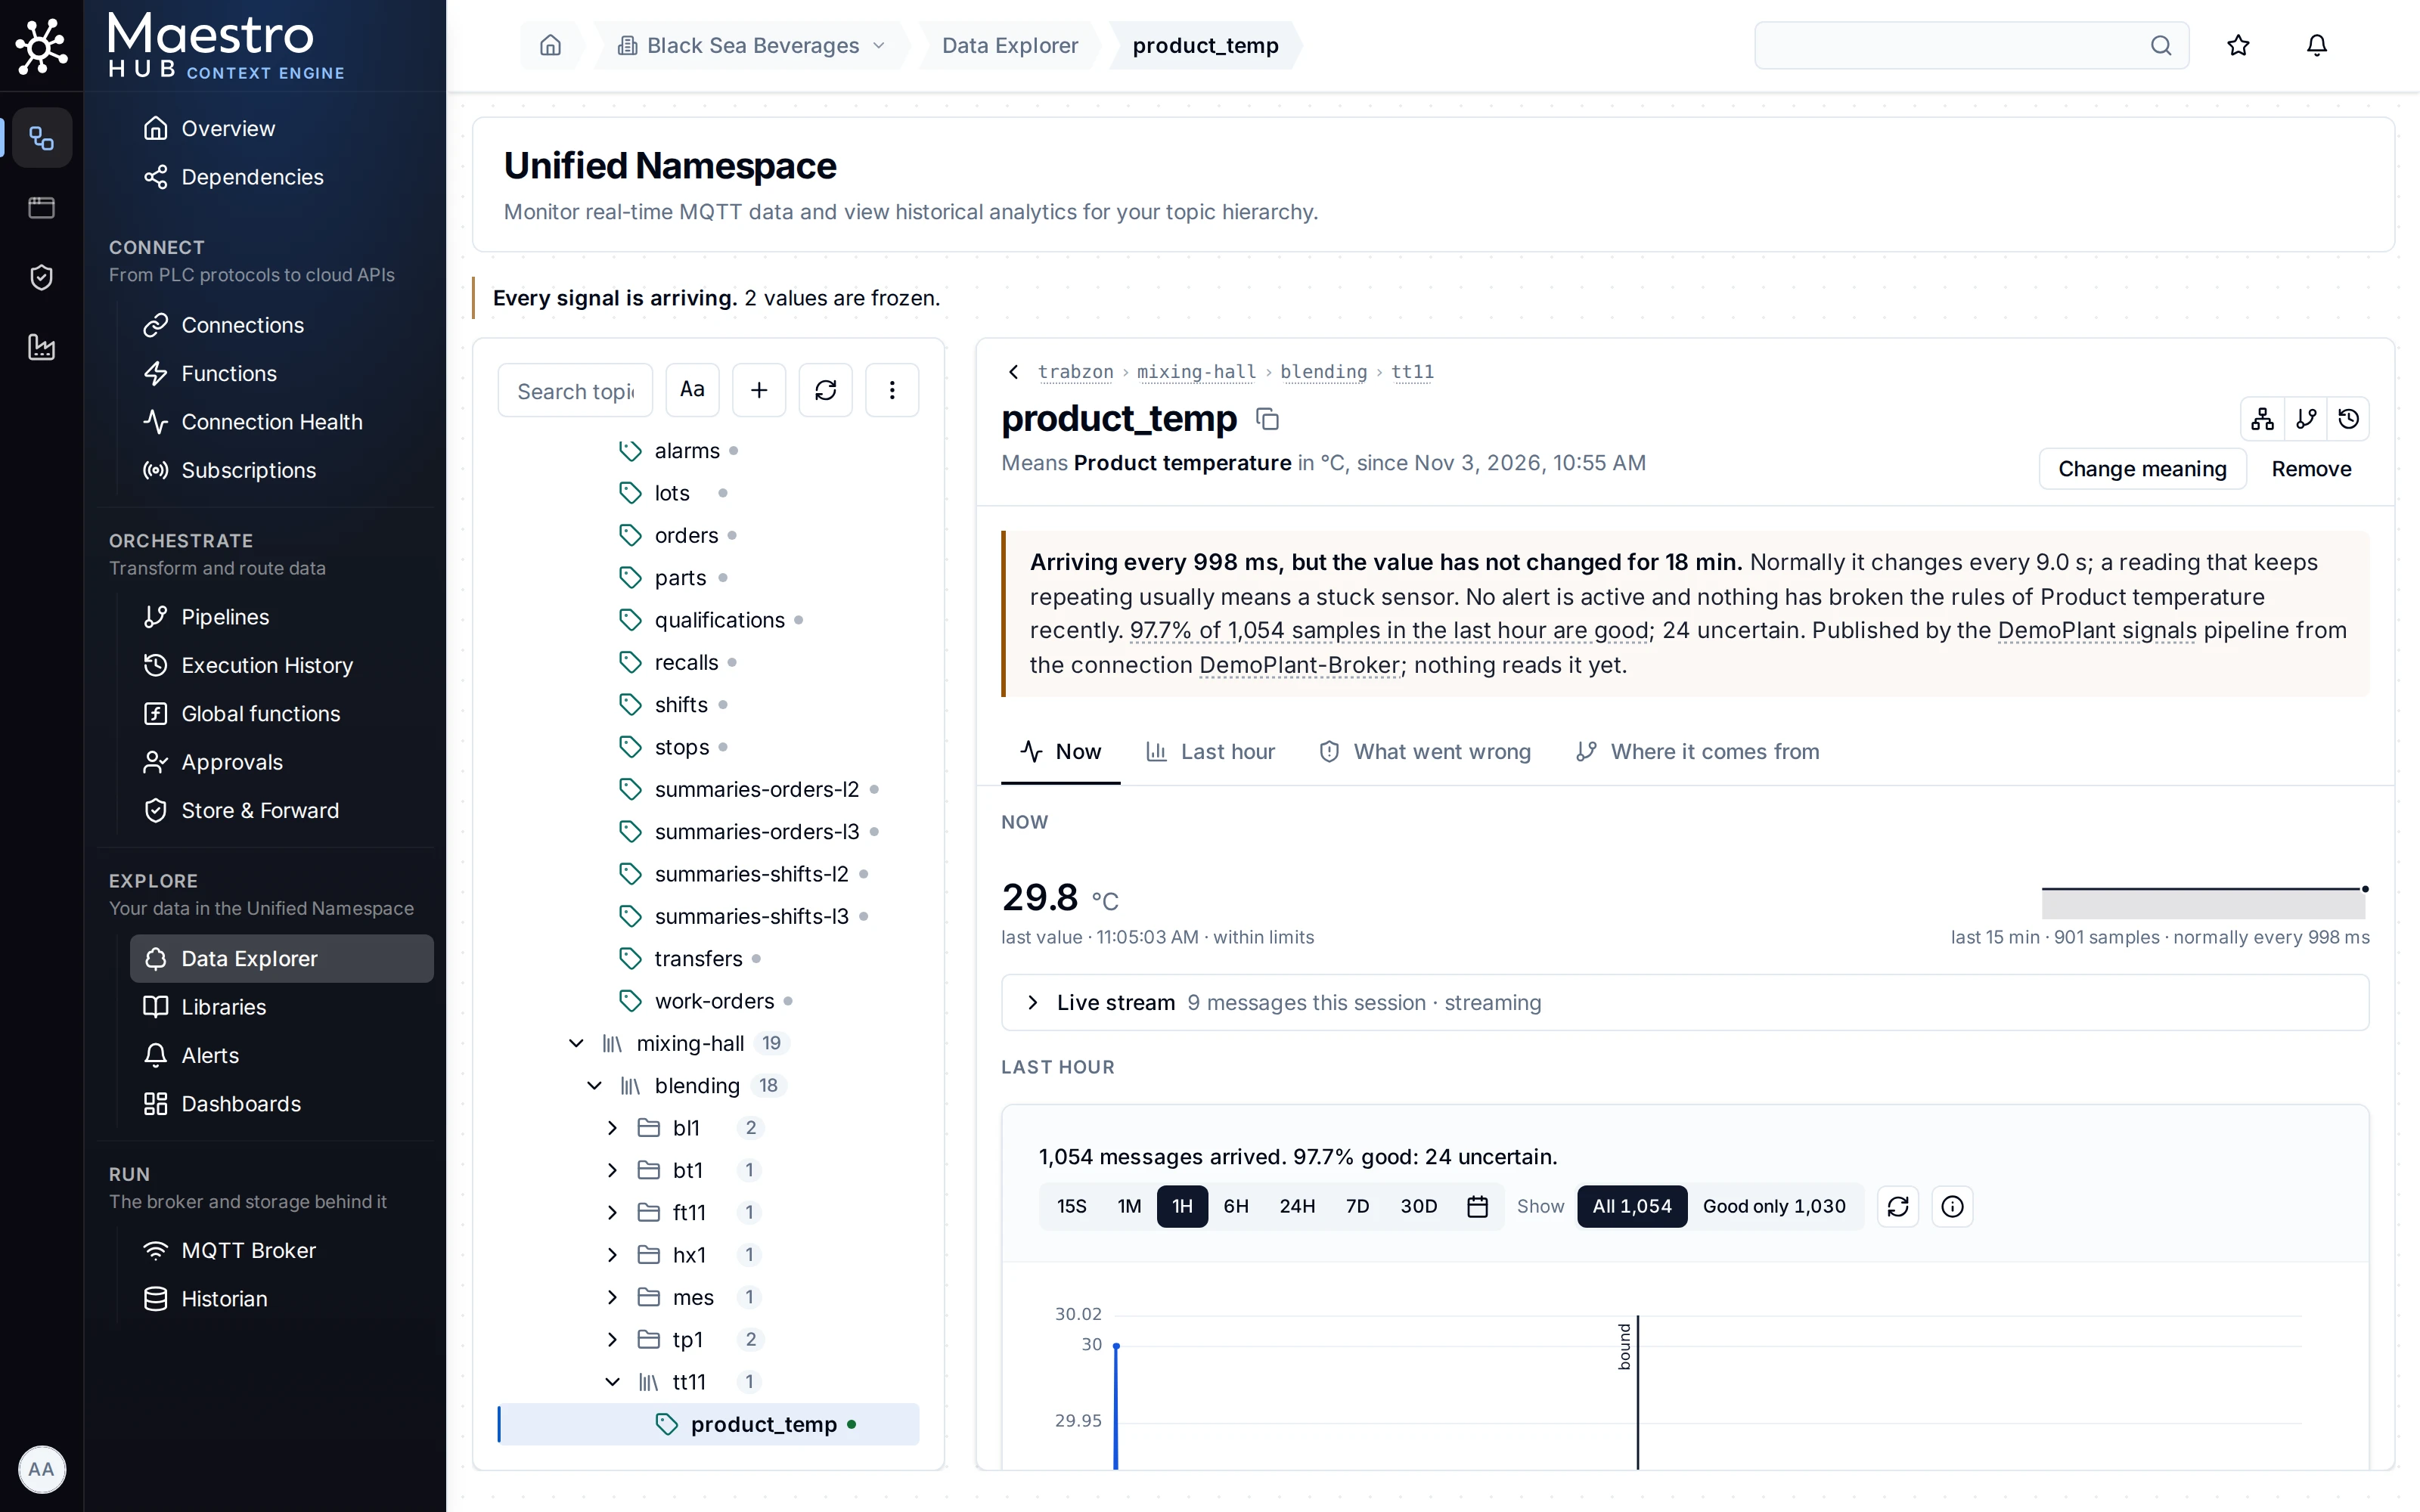
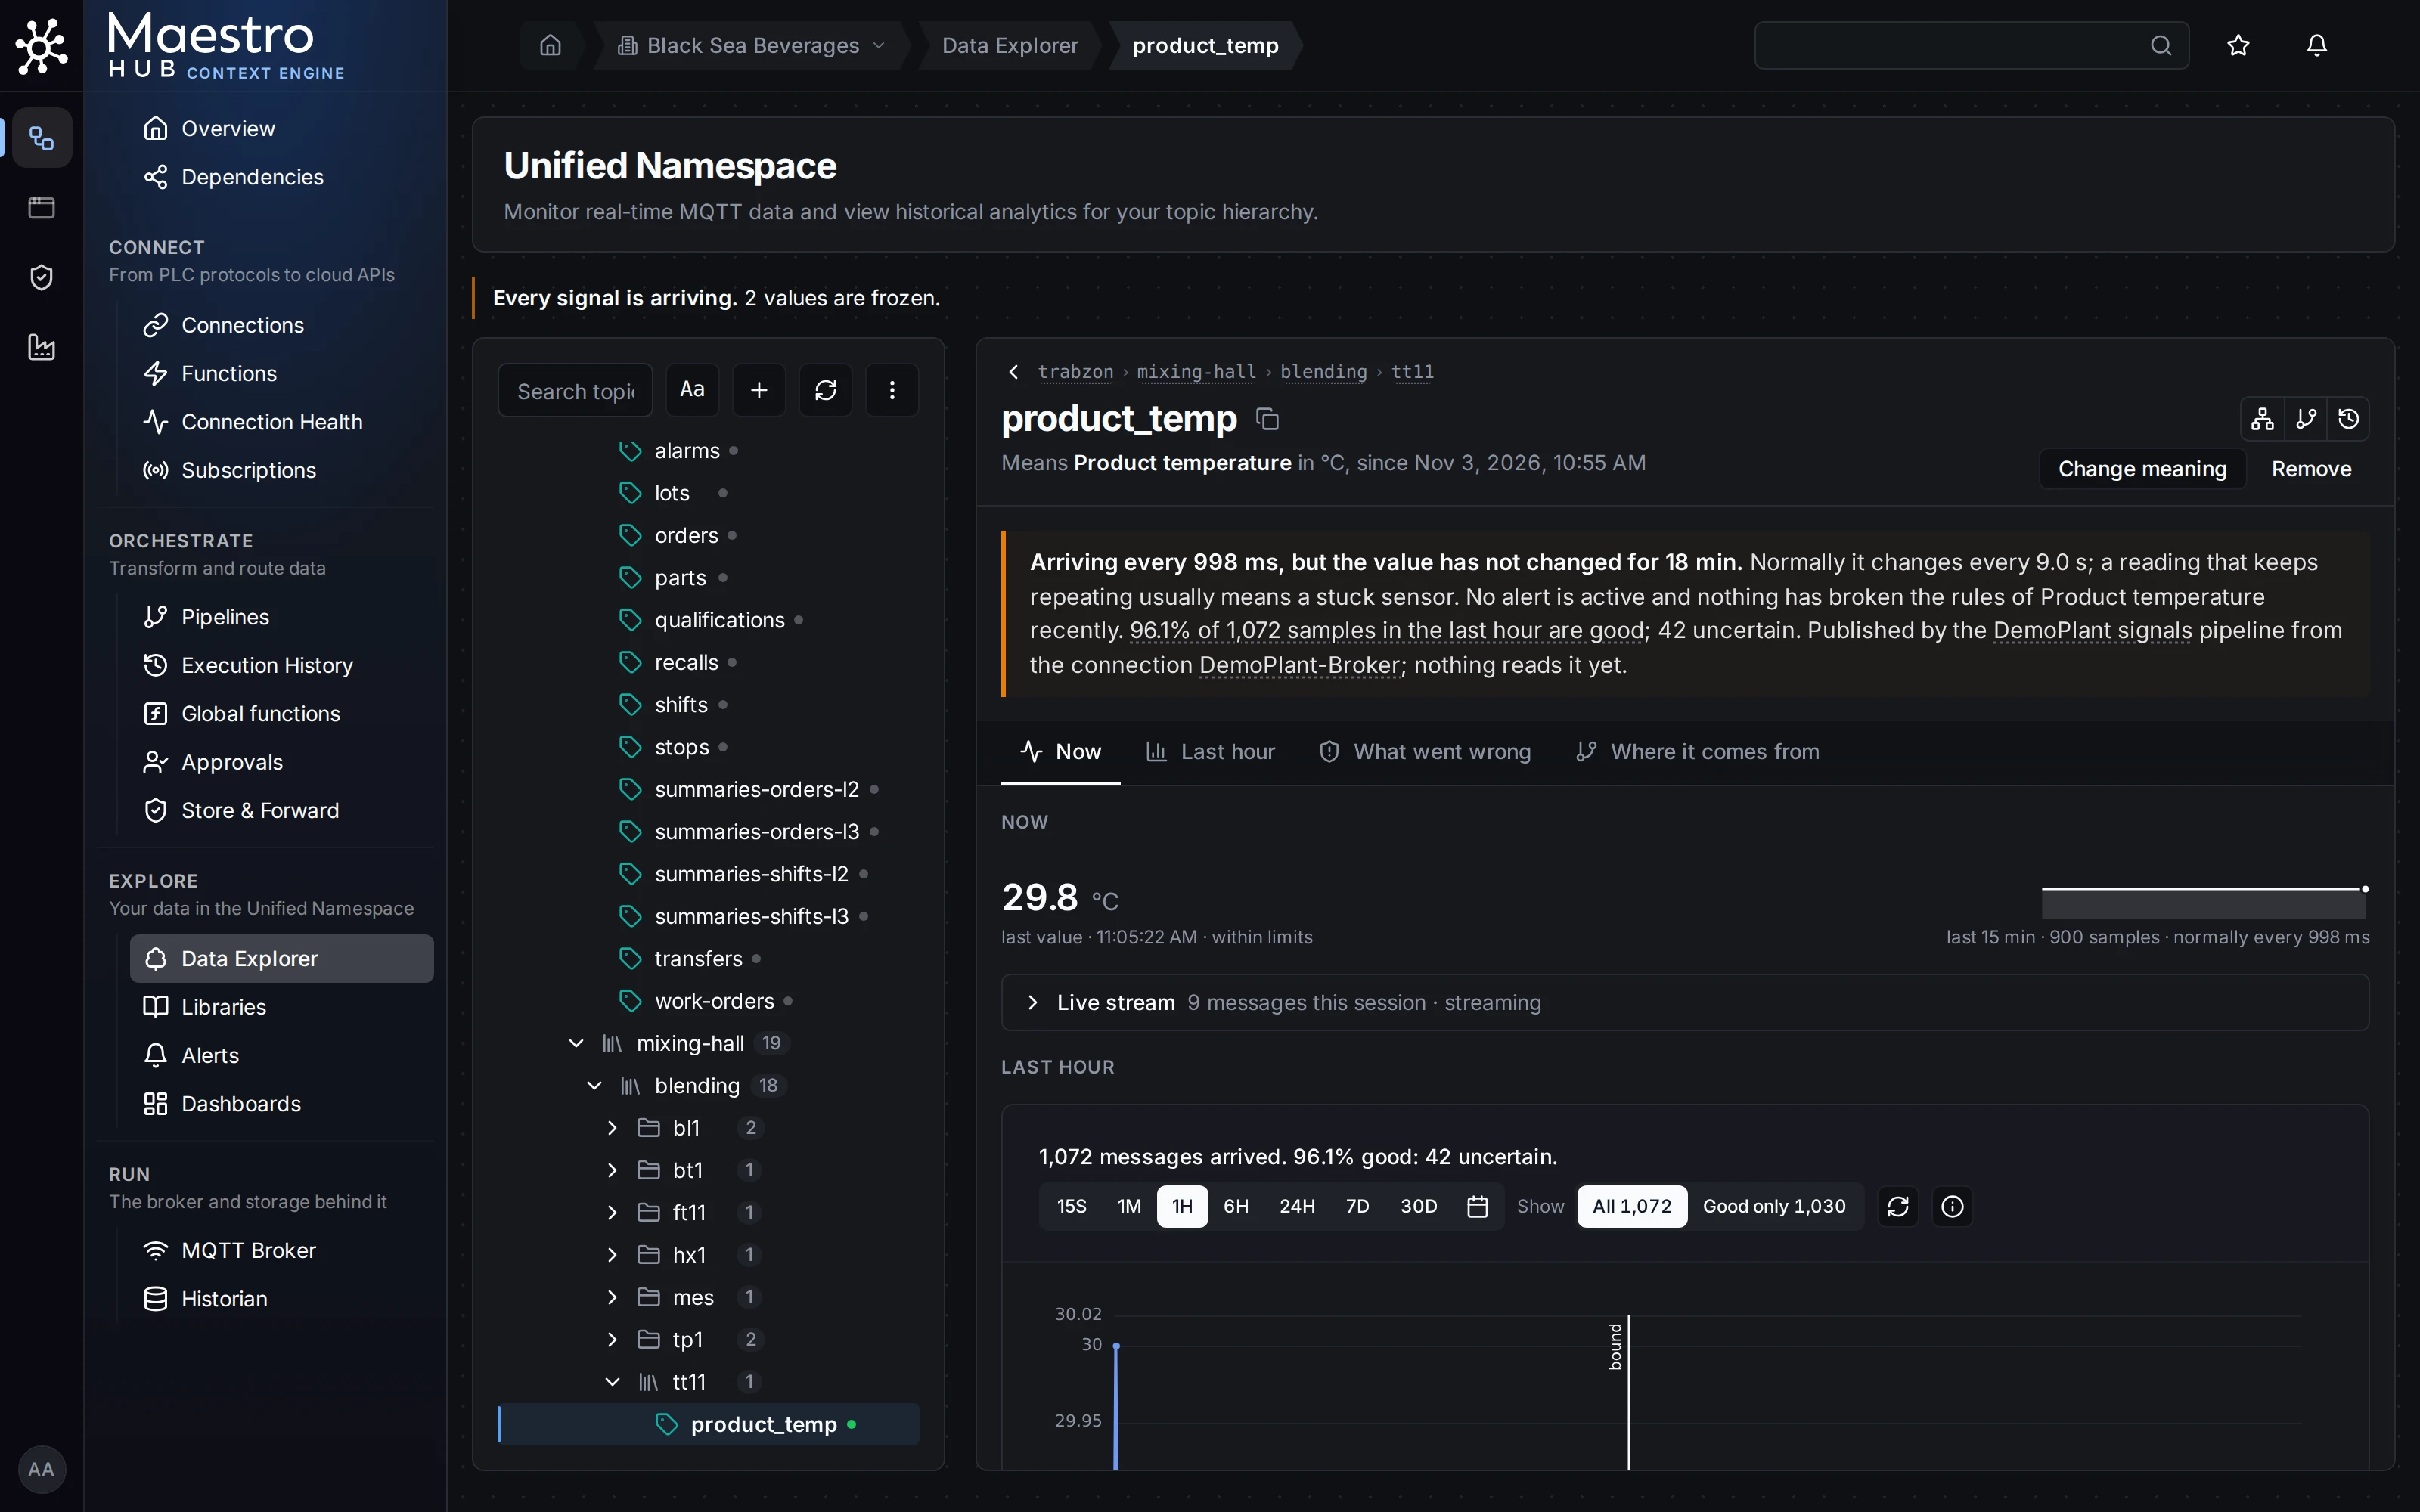
A stuck transmitter. The PLC still marks its values good; MaestroHub stores them as uncertain, frozen.
Try it: open any topic in Explore › Data Explorer. The Last hour section says how many samples were good, uncertain or bad, and Show filters them. To flag frozen values, set Frozen after on a meaning: Catch stuck and silent sensors.
Siemens S7 and Mitsubishi MELSEC send no quality with each value. For them, quality comes from the connection and from MaestroHub's checks on the topic. There is no duplicate detection: two identical values are stored twice.
Can we trace a value back to the machine it came from?
Available
Yes. Any stored value walks back through the pipeline run and its inputs to the machine address it was read from, and records who wrote it: a person, an API client, a pipeline or an AI agent.
The topic page's Where it comes from section answers "why is this number?" as a sentence and a map, up to ten hops back. It reads what was stored with the value when it was written, so it shows the wiring as it was at that moment, not as it is configured today. The REST API returns the same record.
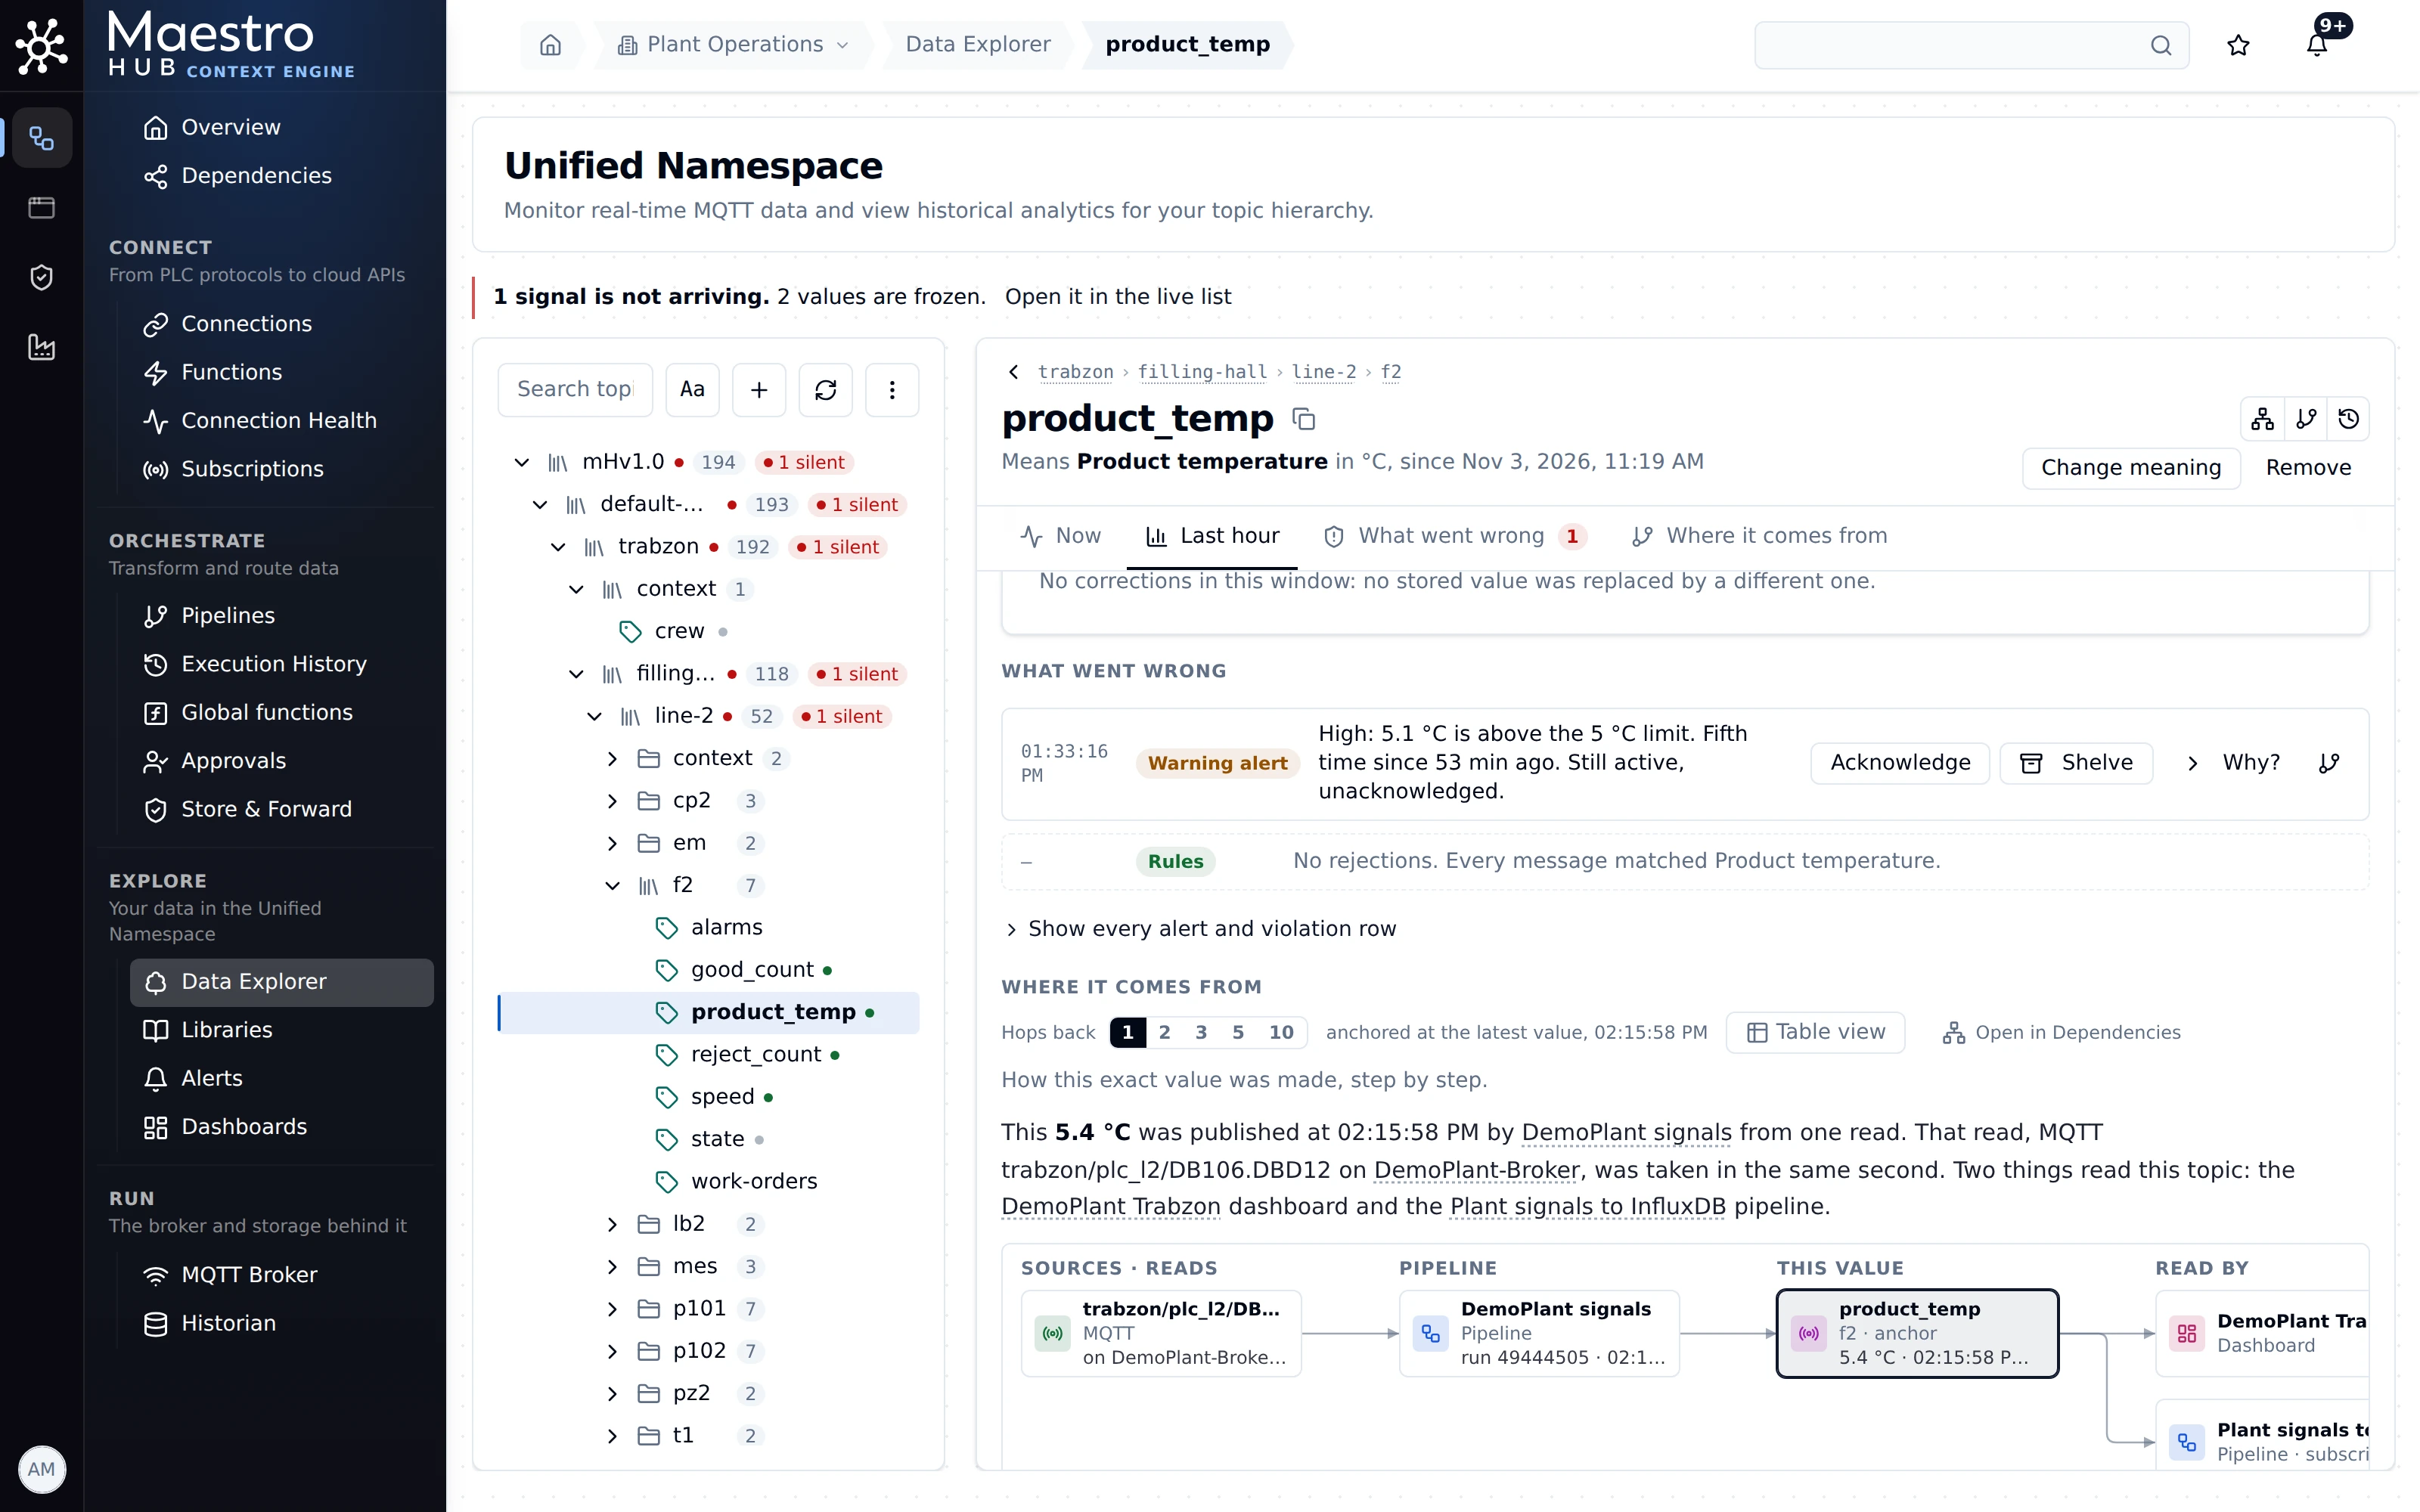
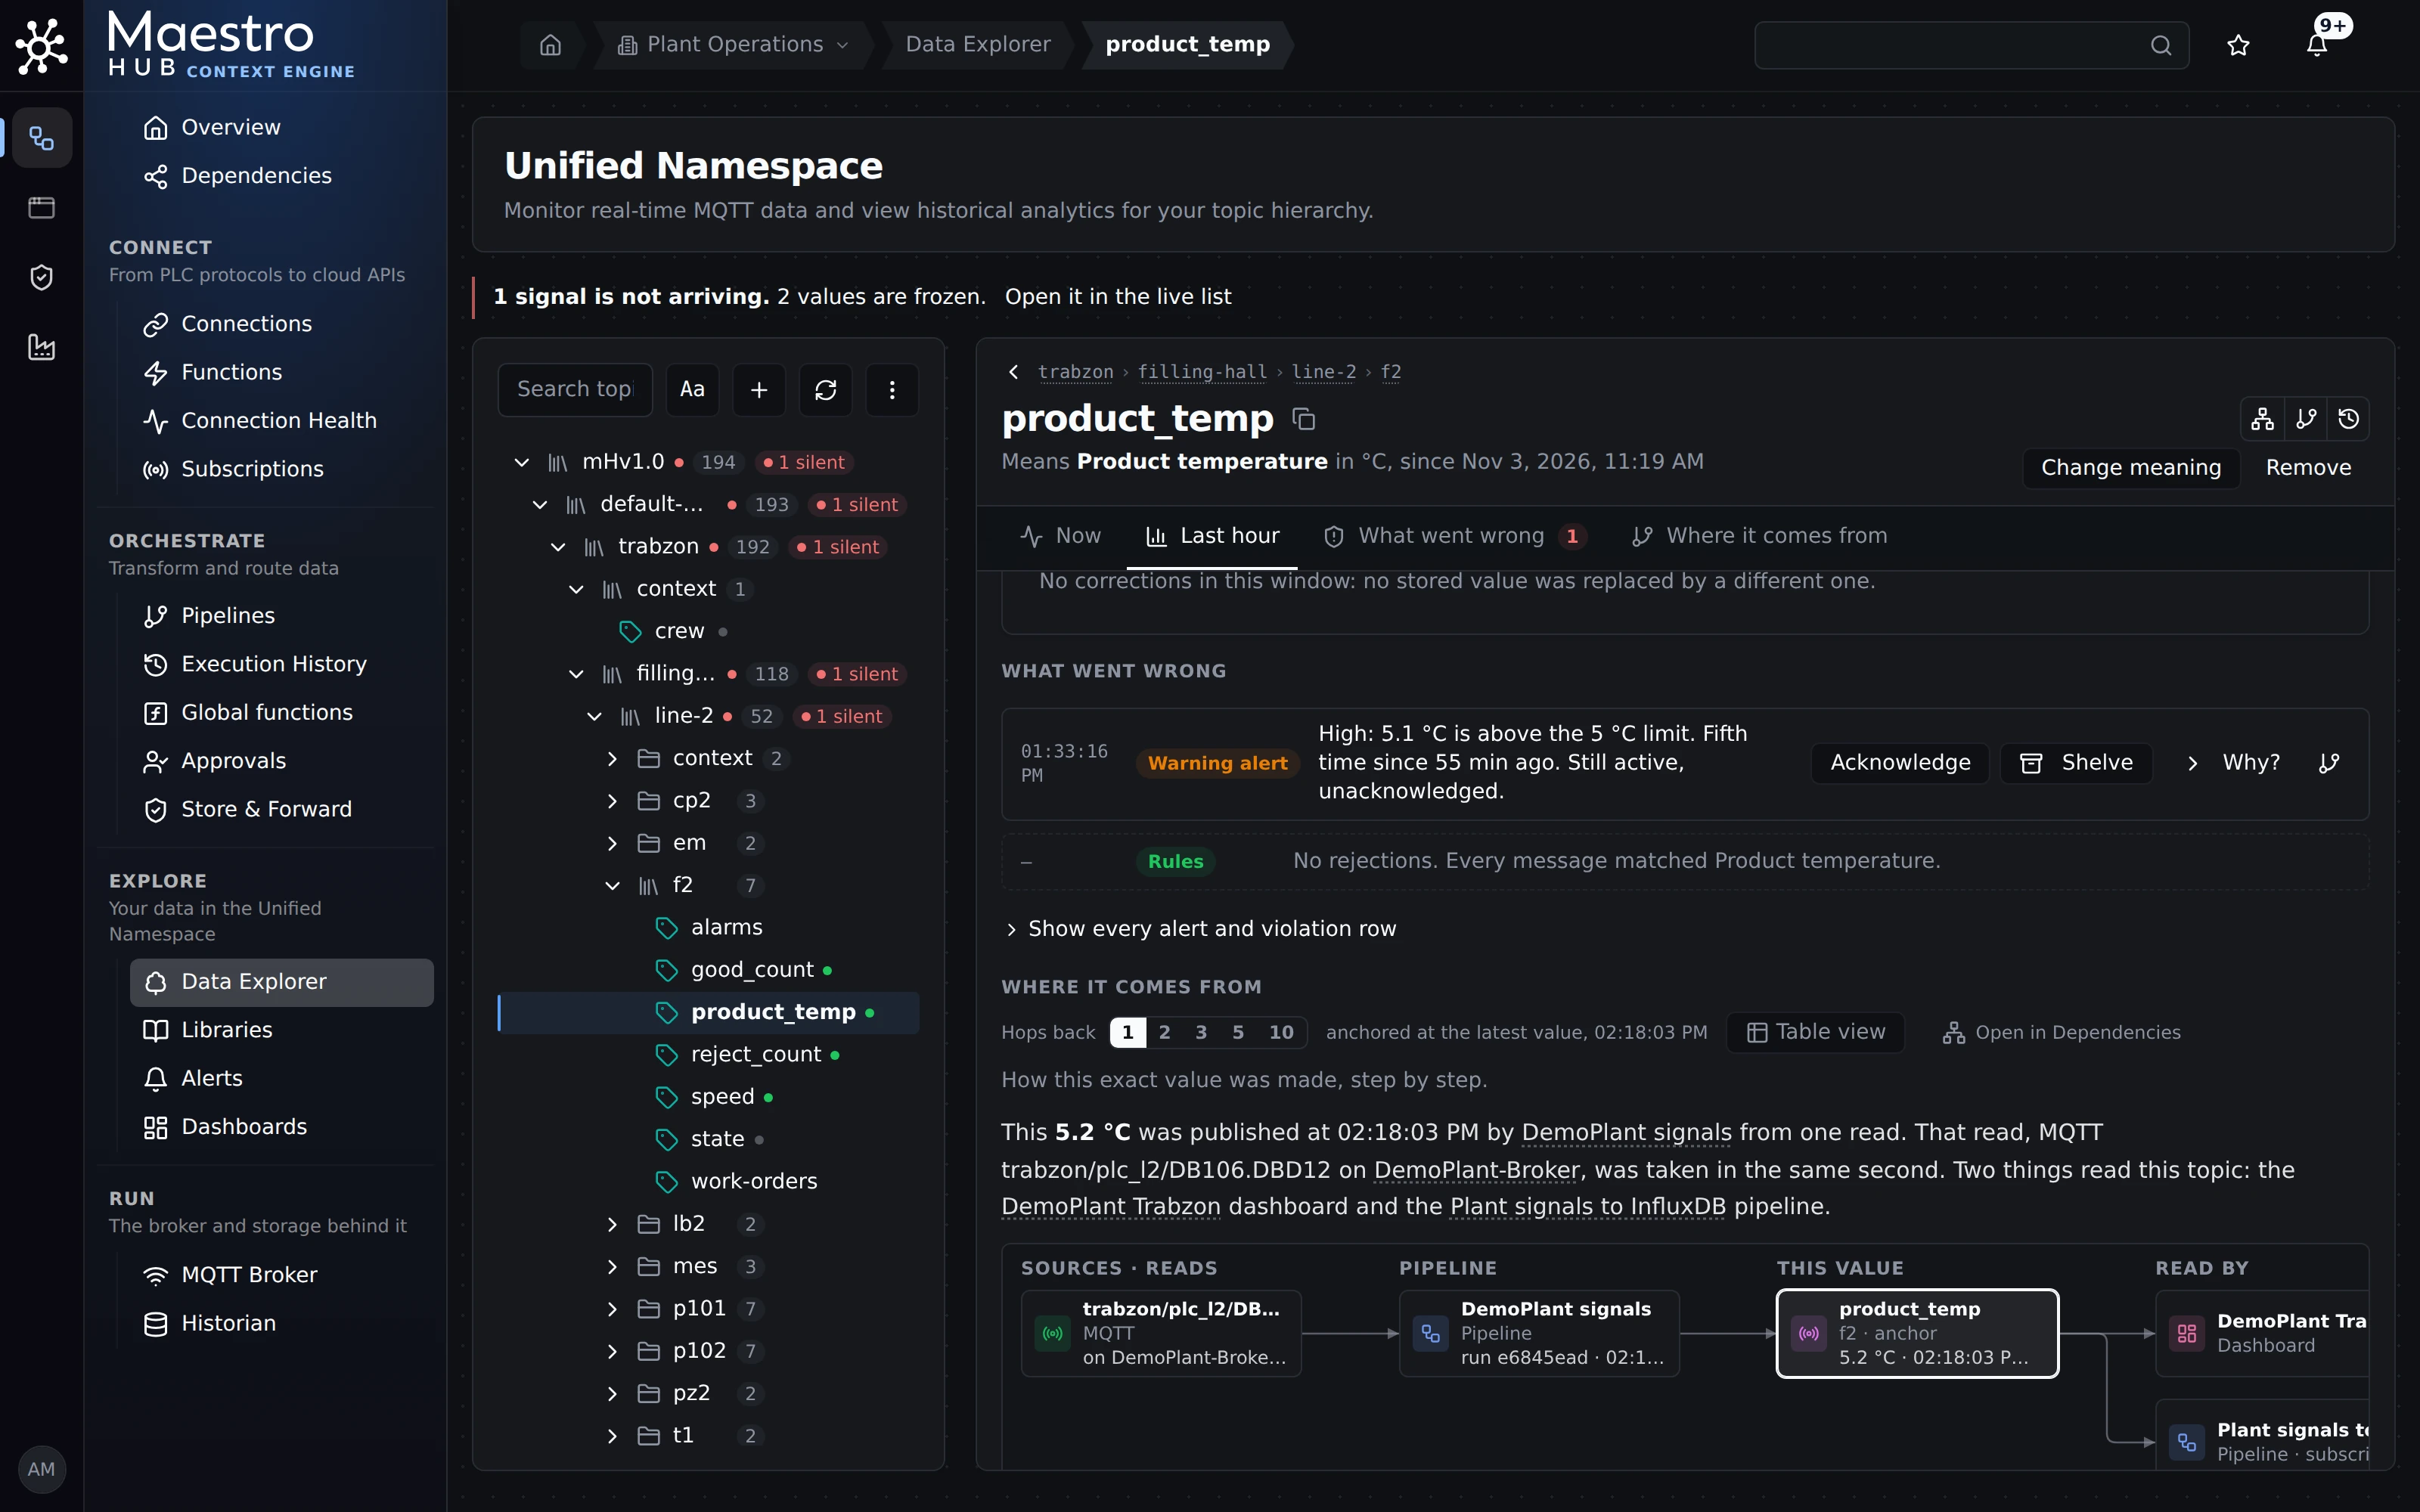
Line 2's product temperature, walked back to the PLC address it was read from, and forward to who reads it.
Try it: Data Explorer: Where it comes from.
For Modbus, S7 and OPC UA reads, the record names the connection and the function, and the register or node address is resolved through the function's version used at the time.
How do we know a data stream has stopped, or a machine has gone quiet?
Available
Each connection has a health state and its own history. One notification per outage goes to Teams, Slack or a webhook. A topic that stops receiving shows as late, with the failing connection named. With meanings, silent sensors are listed too.
- Connections. Connect › Connection Health shows each connection's state and history. A connection that keeps failing sends one
connection.failednotification per outage, andconnection.recoveredwhen it has been back for a minute. See Notifications and Troubleshooting: connection health. - Topics. A topic whose values stop arriving reads Late, names the failing connection, and lists the other signals on it that stopped too. A device subscription that fails stores its last value as bad, with the reason communication error, once per outage, so a chart does not keep showing it as live.
- Silent sensors (Beta). Every topic with a meaning is watched against its own rhythm and reported as Not receiving data when it goes quiet. See Catch stuck and silent sensors.
Try it: stop a source you can afford to stop, for example the Digital Factory Simulator, and watch its topics and Connection Health.
Something stopped working. Can we see who changed what, and undo it?
Available
Changes to connections, functions, pipelines, users and roles, and every sign-in, are recorded in an audit trail that is on by default and hash-chained, so you can check that no record was altered. Pipelines keep every version, with a comparison and a revert.
The check is tamper-evident, and it has a boundary. It detects a changed record, a deleted record that has a newer one after it, and records put out of order. It cannot detect that the newest records were removed, or a rewrite of the chain from some point on by someone who can write to the database.
- The trail. Admin › Audit Trail filters by actor, action, module and time, exports for a SIEM, and Verify now checks the chain. See Audit trail and Send the audit trail to a SIEM.
- Undo. Every save of a pipeline is a version. Compare any two on the canvas and restore an earlier one as a new version. See Pipeline version history.
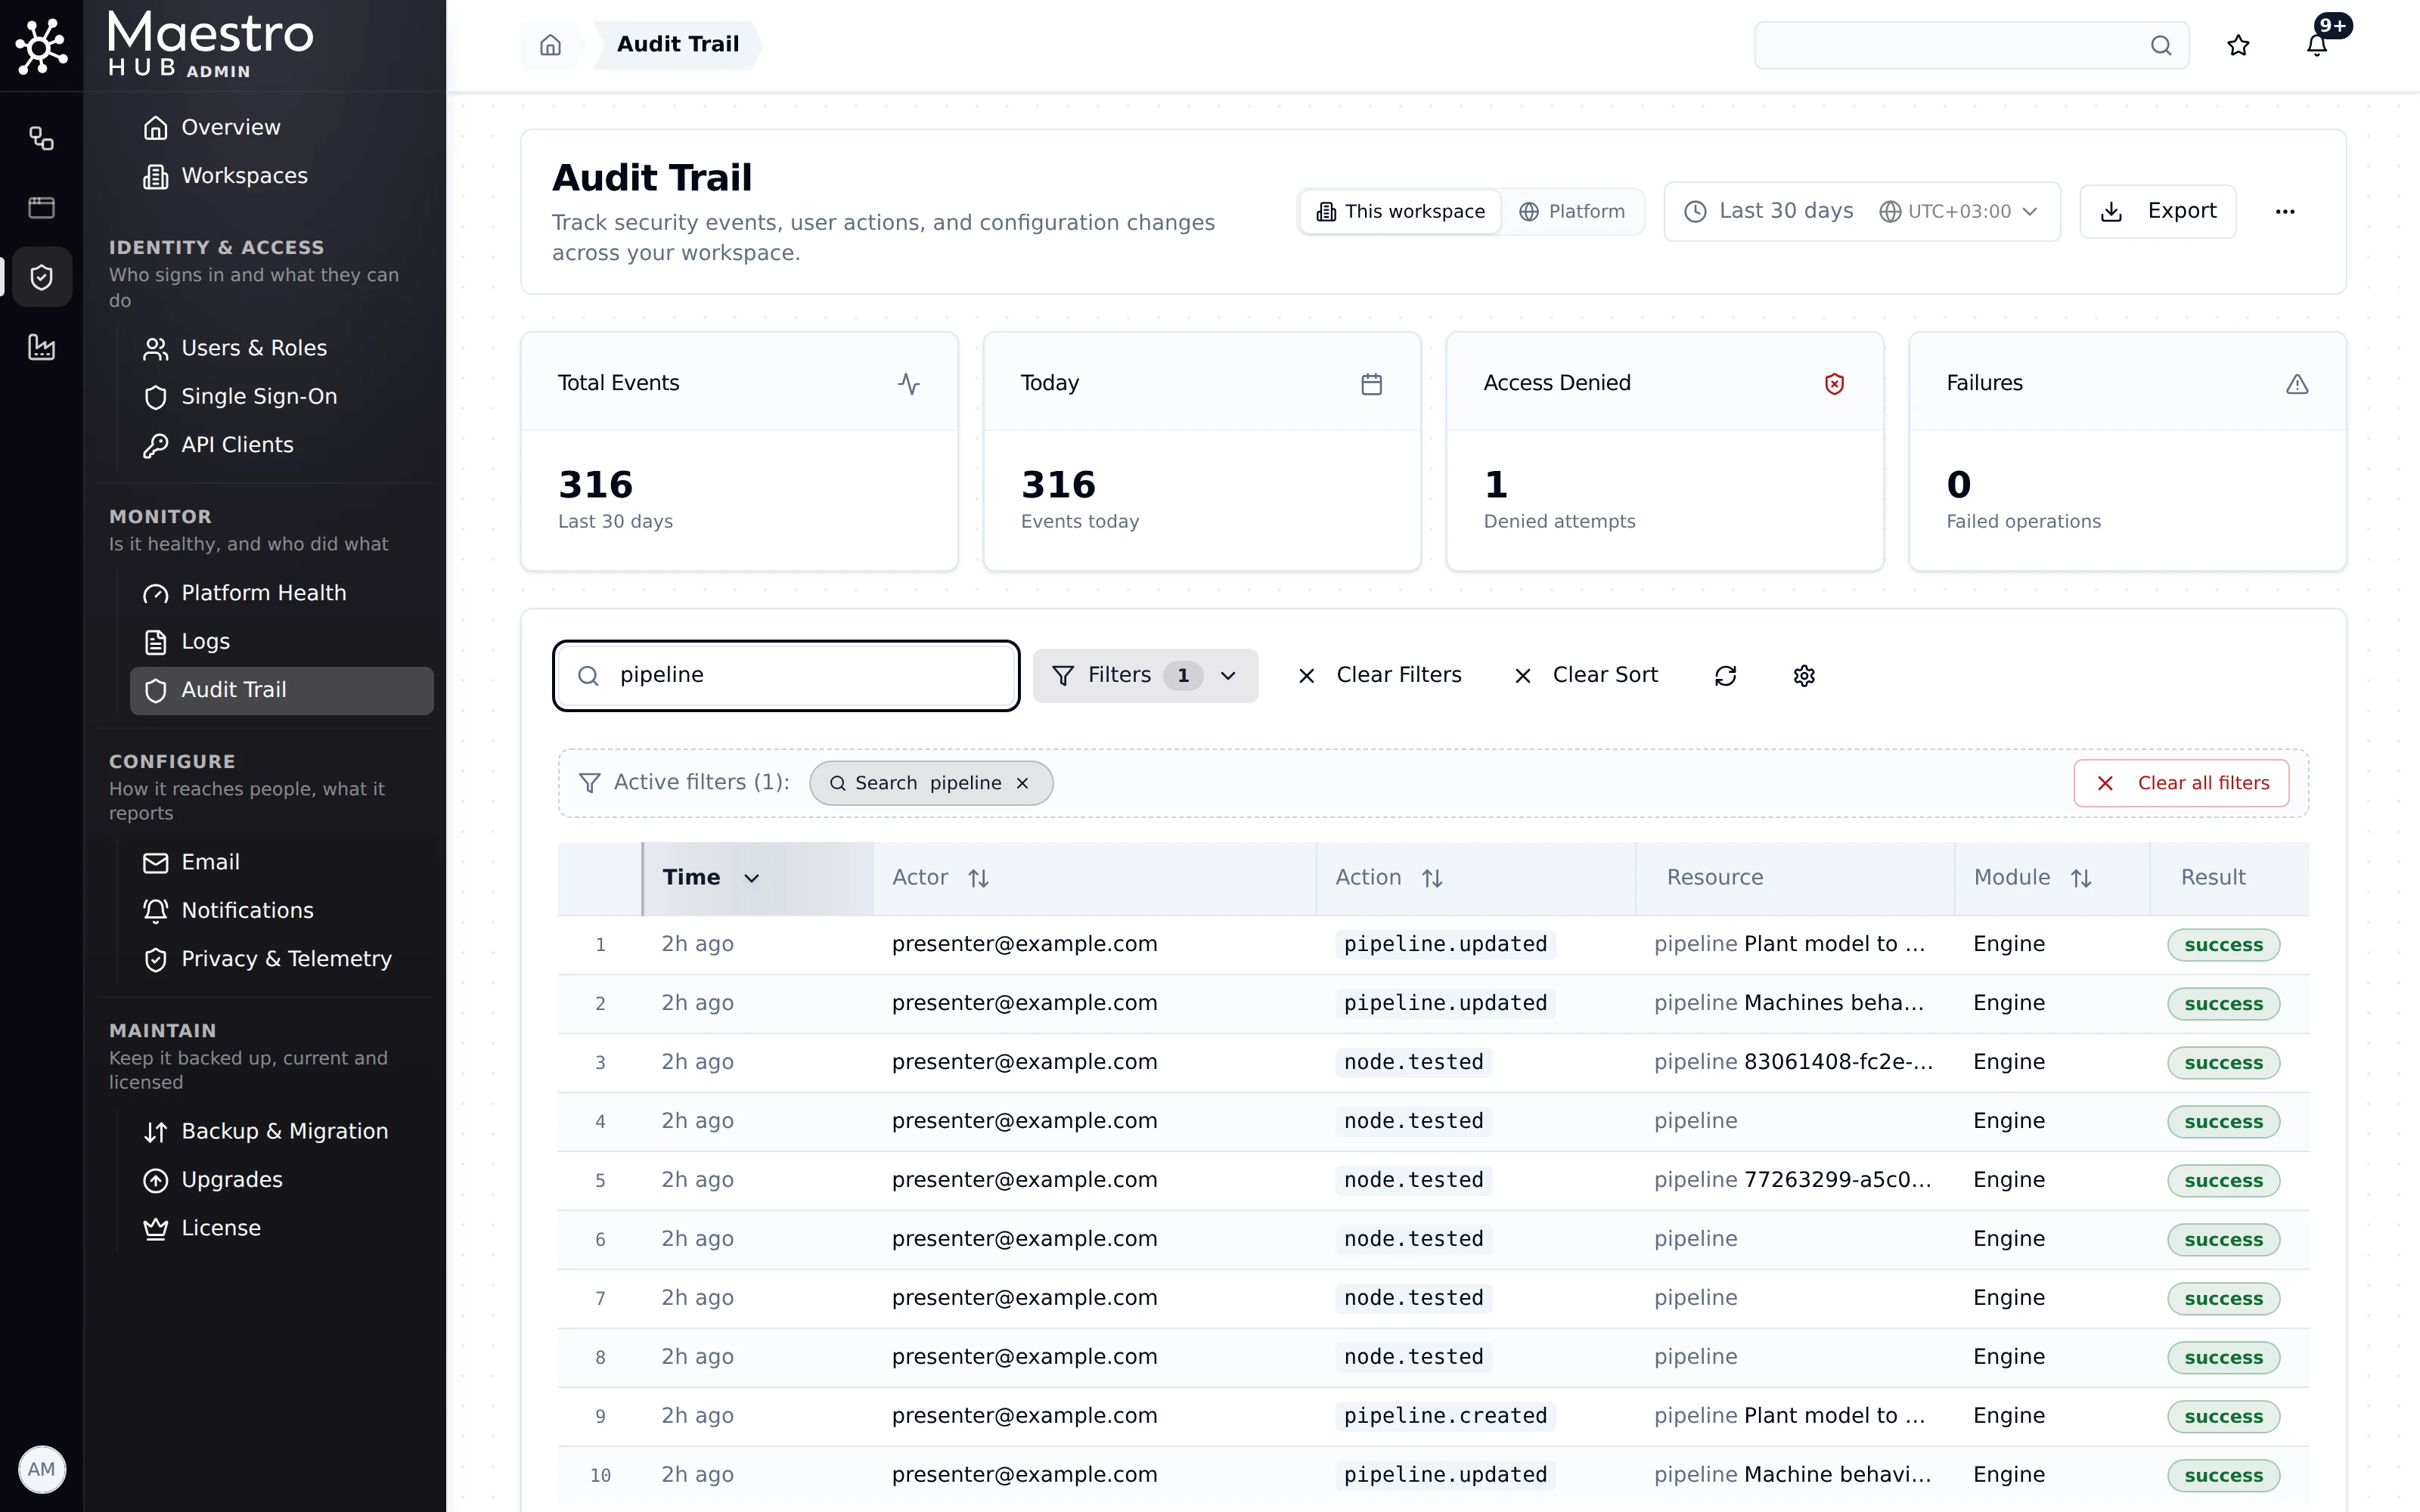
Admin › Audit Trail, searched for pipeline: who created, changed and tested which pipeline, and when.
Records are kept for 90 days by default; config.yaml sets a longer window. Send them to your SIEM to keep them longer and outside MaestroHub.