Platform Tour
Click through annotated screenshots of MaestroHub, from creating a connection and building pipelines to the Data Explorer, users and single sign-on.
- How to use
- Click a numbered pin · Expand for full screen
A guided tour of MaestroHub's five core modules. Click any numbered pin on a screenshot to see what that UI element does, hit ⤡ Expand on any image for a fullscreen view with the same hotspots, or jump straight to a section from the table of contents on the right.
Platform Overview
The five modules at a glance. Each card jumps to its own deeper reference.
Connect: Data Collection
Define a connection profile once, build reusable functions, then use them across any pipeline. TLS, authentication, and credential management are built in. Test before saving, and follow uptime and failures on the Connection Health page.
Learn moreUnified Namespace: Single Source of Truth
Topics are usually organized along the ISA-95 model: Enterprise → Site → Area → Line → Cell → Equipment. MaestroHub adds schema validation, time-series storage, live MQTT streaming and real-time dashboards on top.
Learn moreObserve: Monitoring and Alerting
Visibility across connections, pipelines and the platform itself. Every connection state change is logged, and every pipeline run can be traced node by node.
Learn moreOrchestrate: Pipeline Automation
Visual drag-and-drop pipeline builder with a large, growing node library. Every pipeline is version-controlled: every create, update and revert records a full snapshot you can roll back to. The Dependencies map shows how pipelines, connections, functions, topics and dashboards depend on each other.
Learn moreAdmin: Administer & Maintain
Platform-wide administration lives under Admin in the sidebar: workspaces, users and roles, single sign-on and API clients; Platform Health, logs and the audit trail; email, notifications and telemetry; Backup & Migration to export configuration and promote it between environments; upgrades and the license. Maintenance mode pauses one workspace at a time, from its Overview.
Learn moreCreate Connection
How to wire MaestroHub to an external system. This walkthrough uses OPC UA. Other connectors follow the same flow, though their settings tabs differ; every connection also has Functions, Scaling and Health tabs.
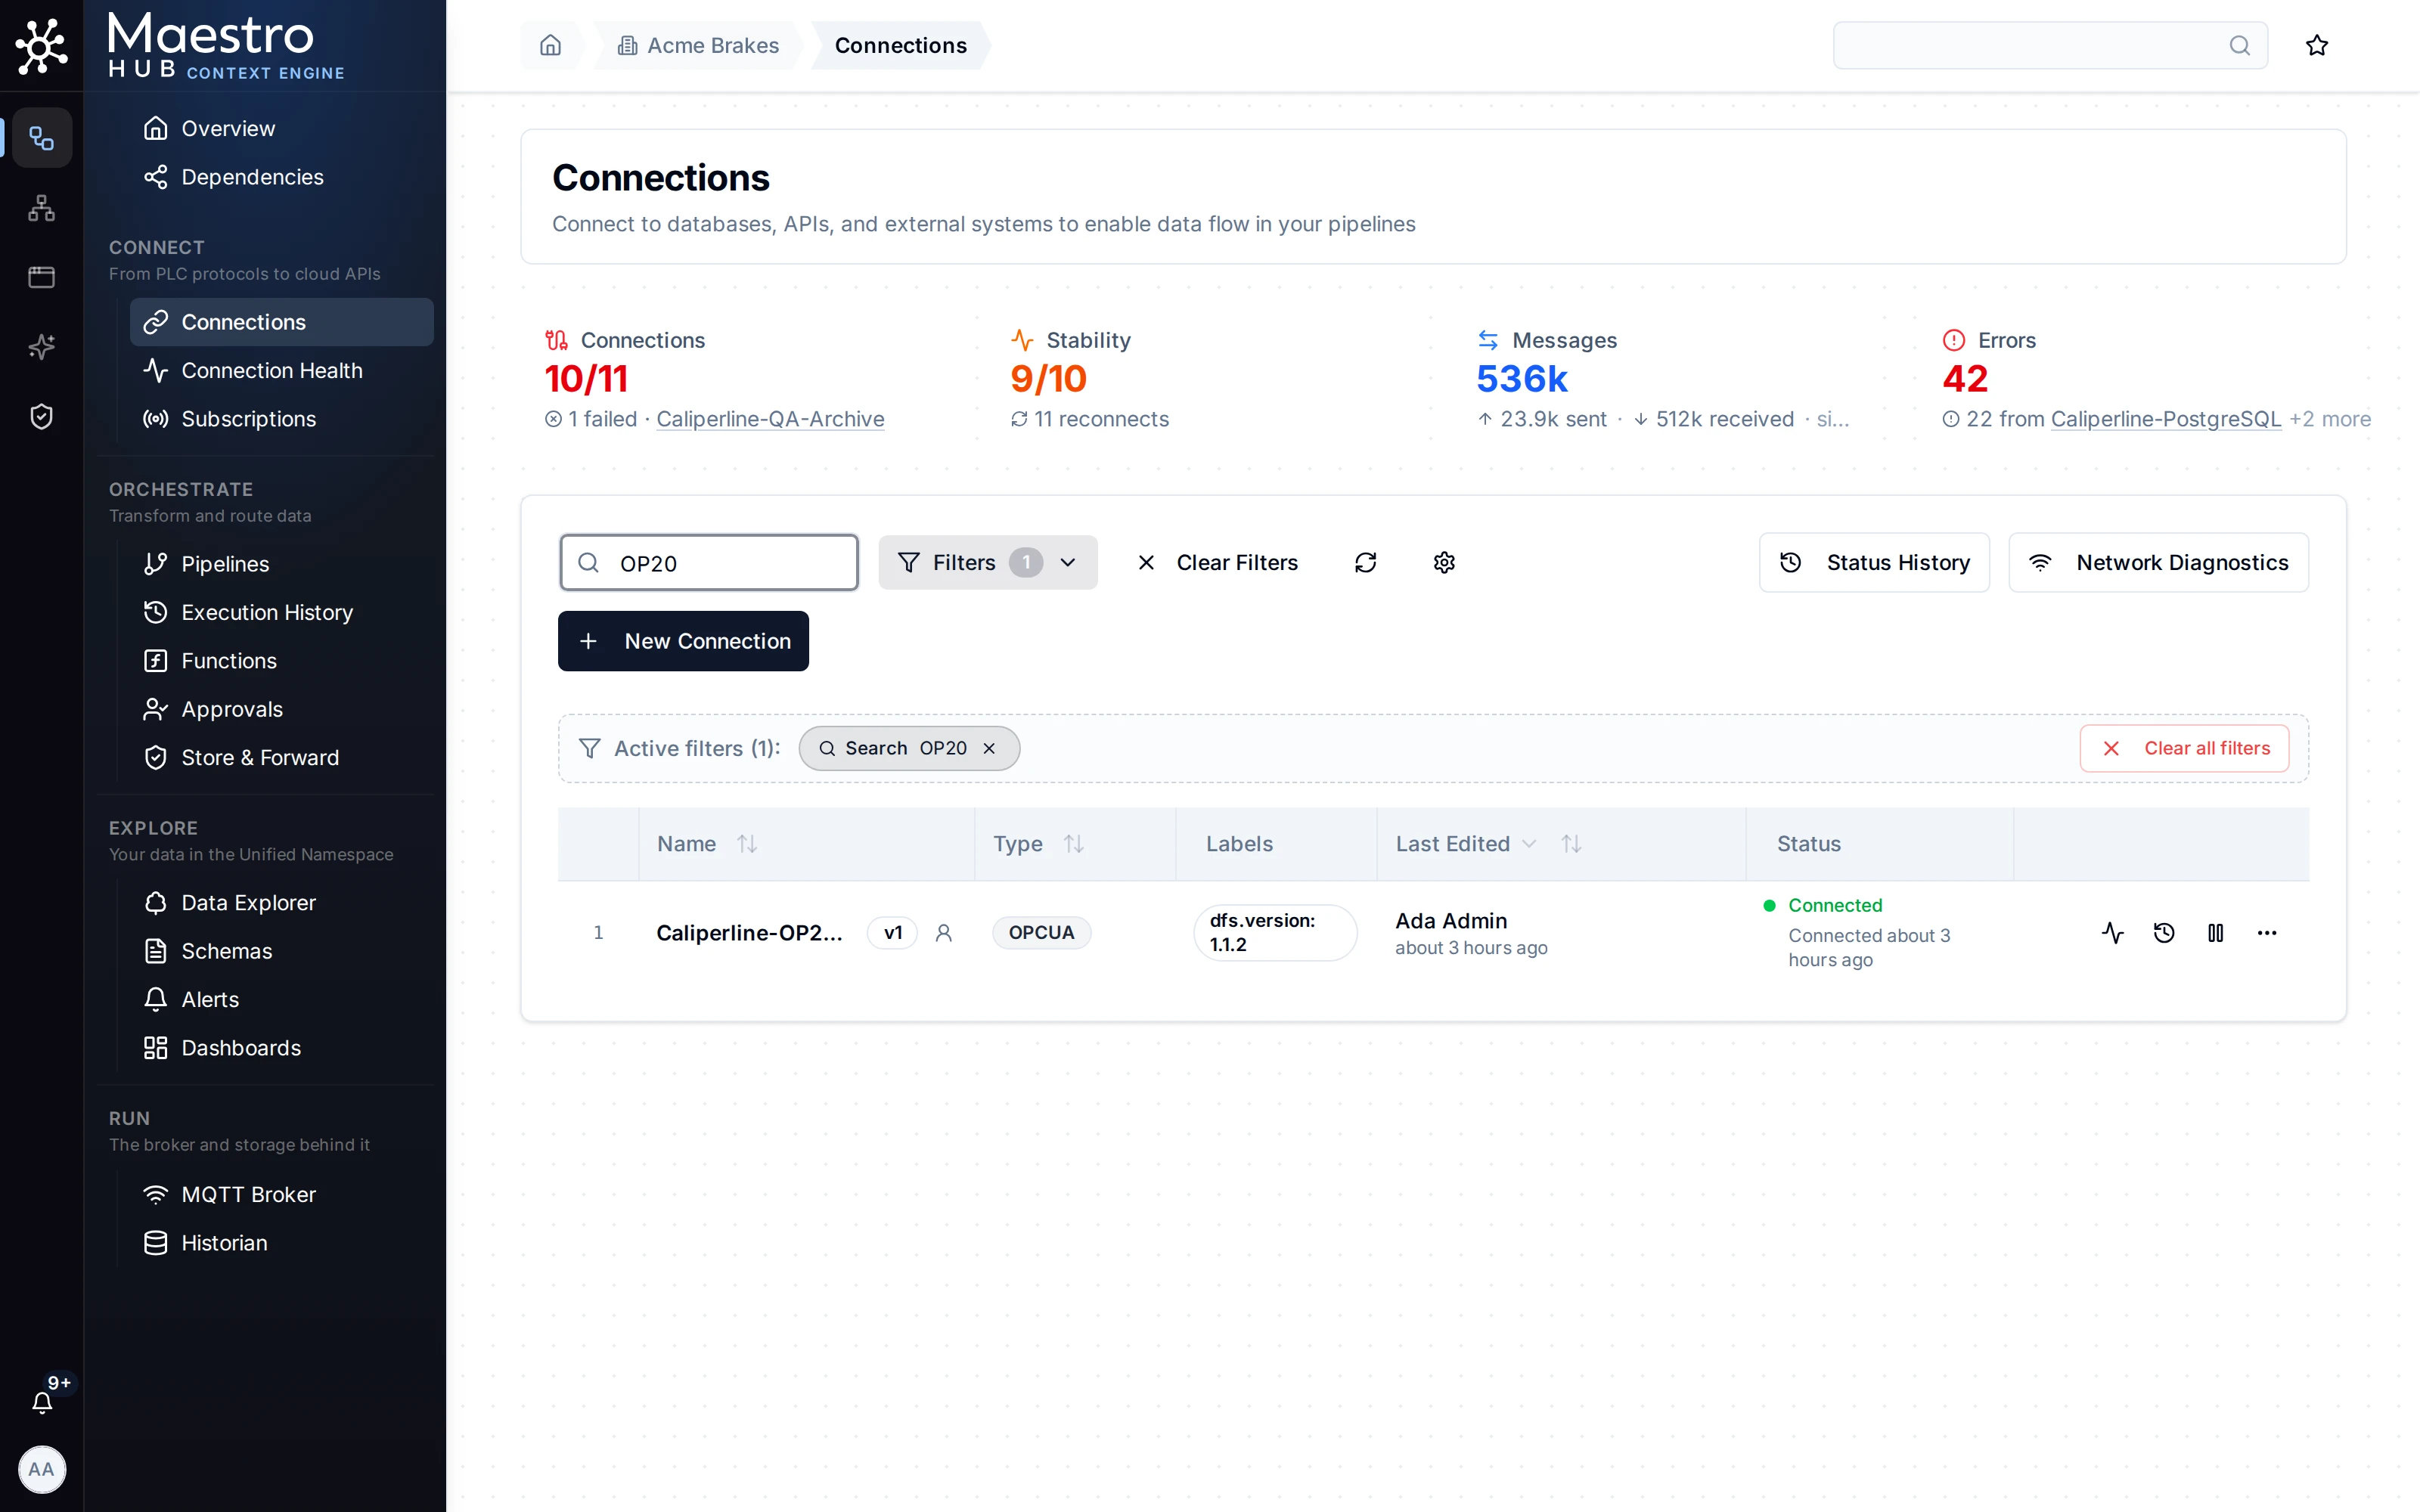
Connection Dashboard
Connect › Connections lists every connection in the workspace with its live status, and is where you create, test and troubleshoot them.
Quick Add Feature
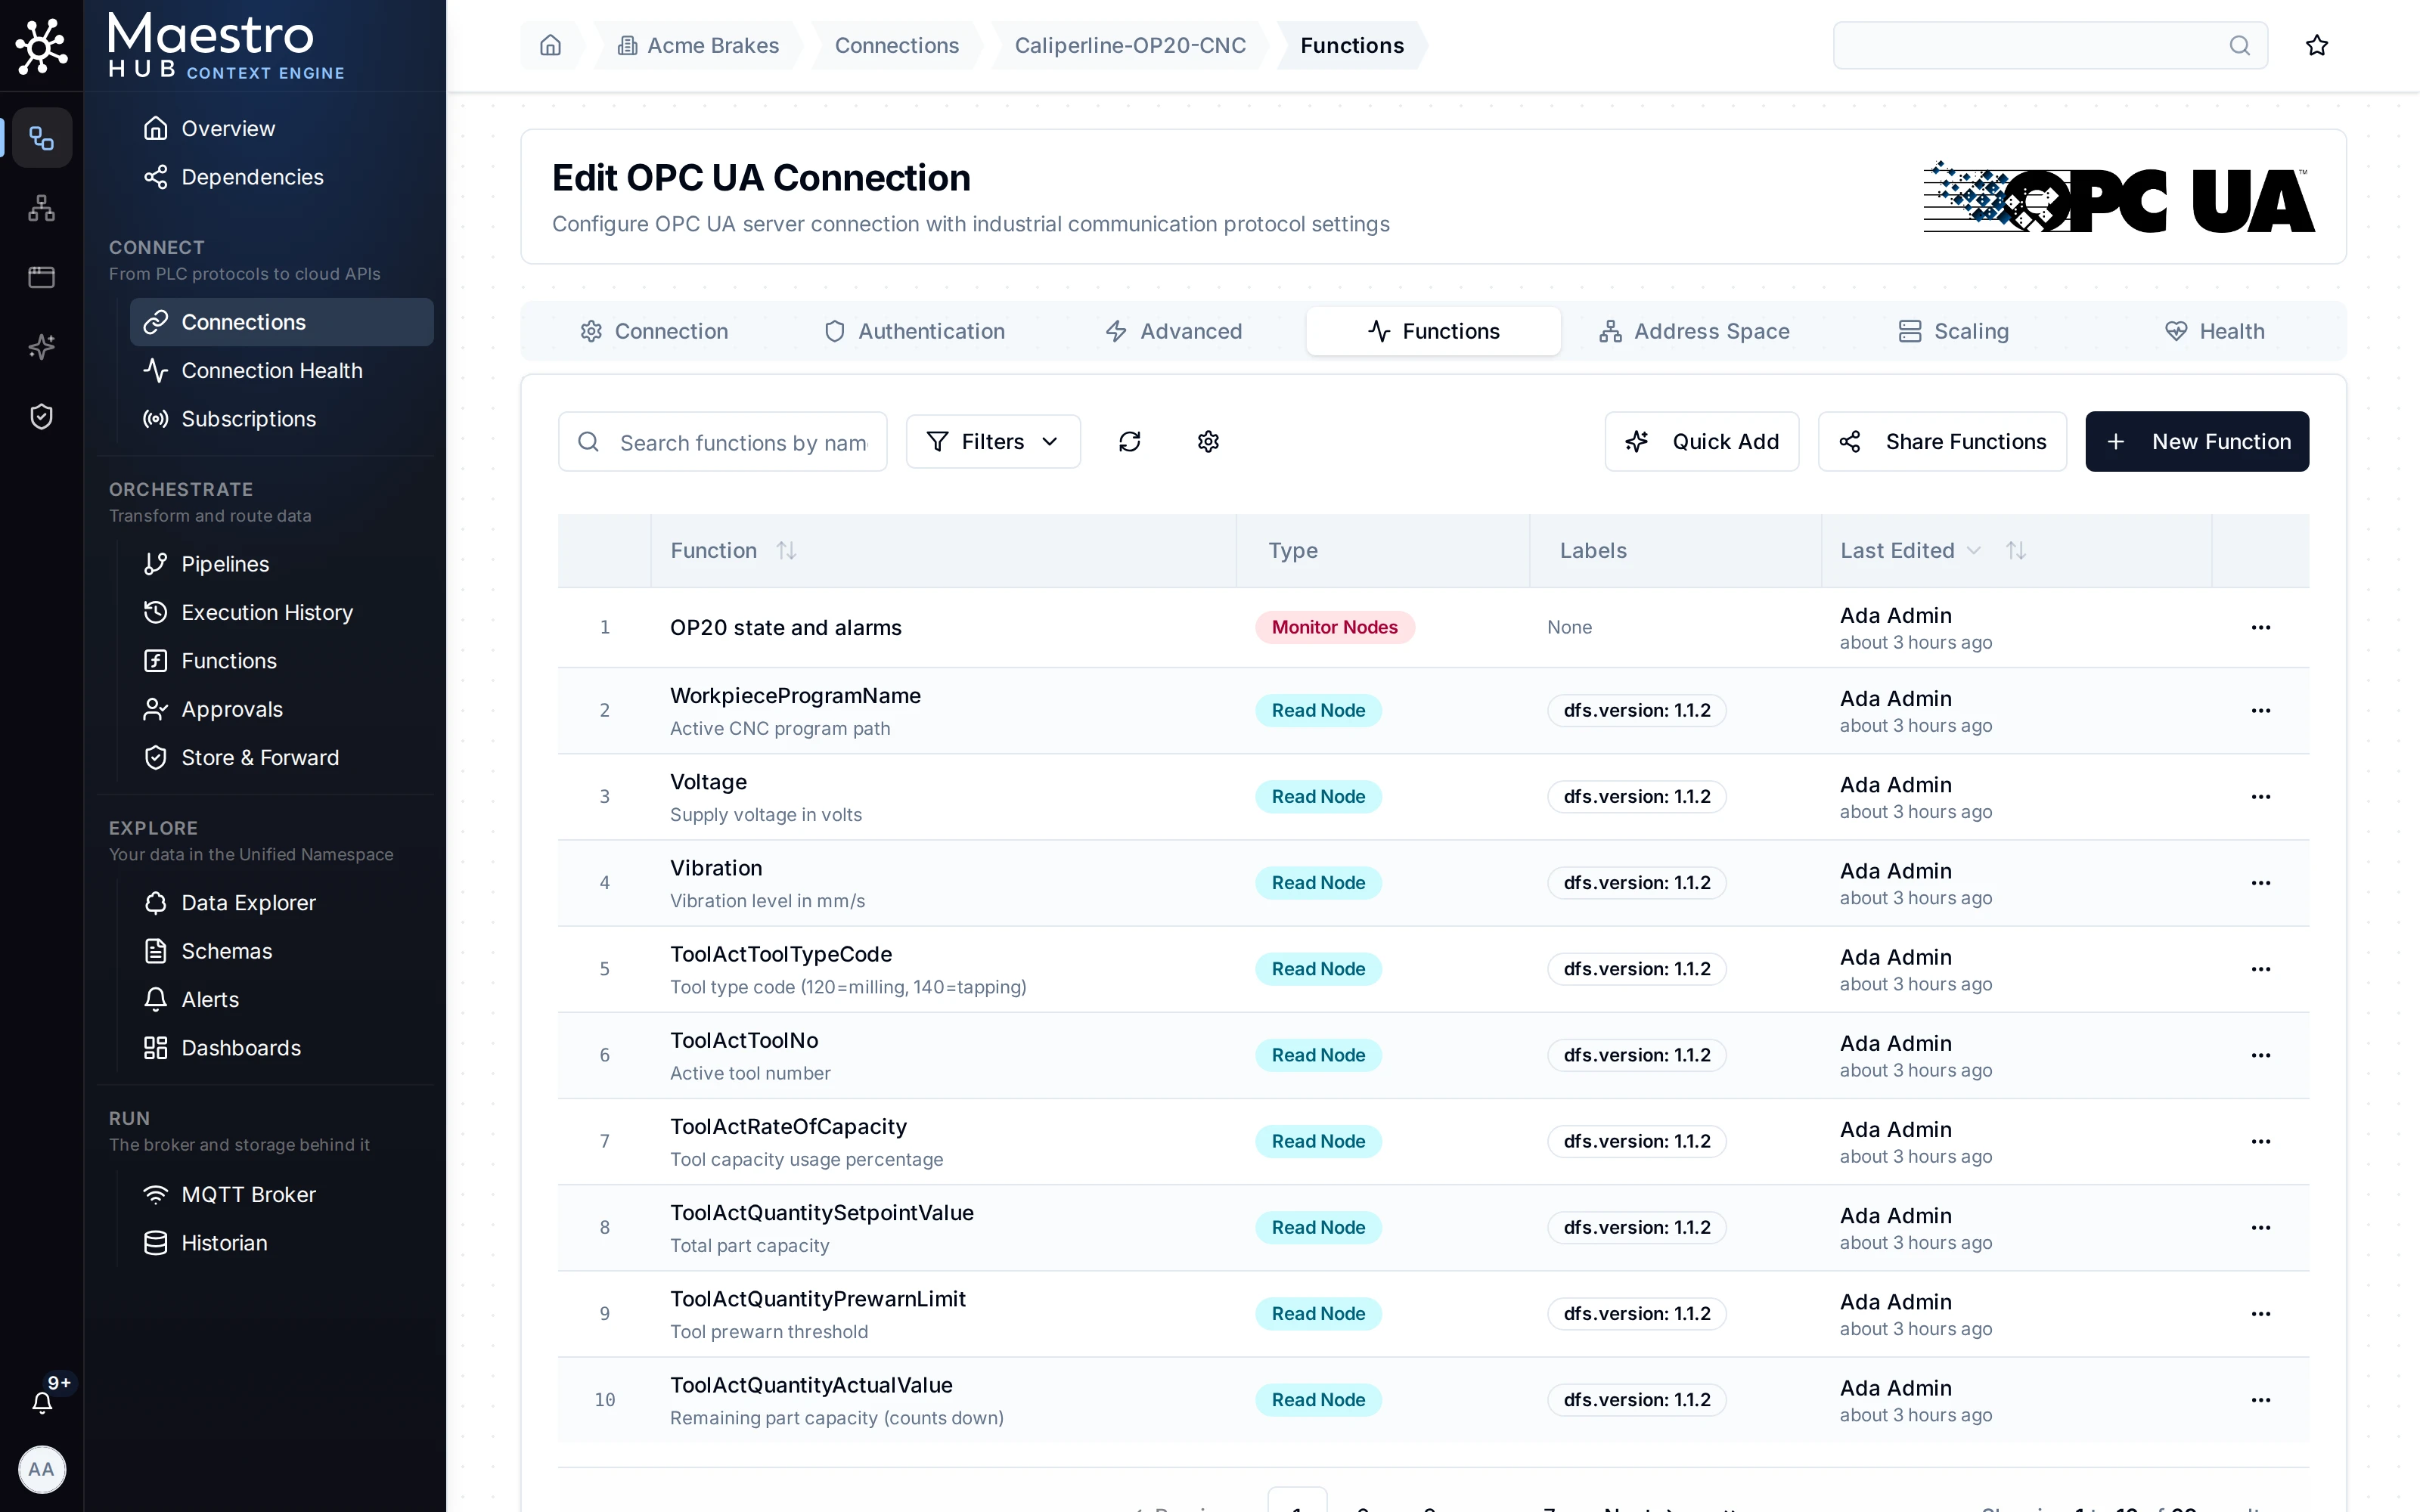
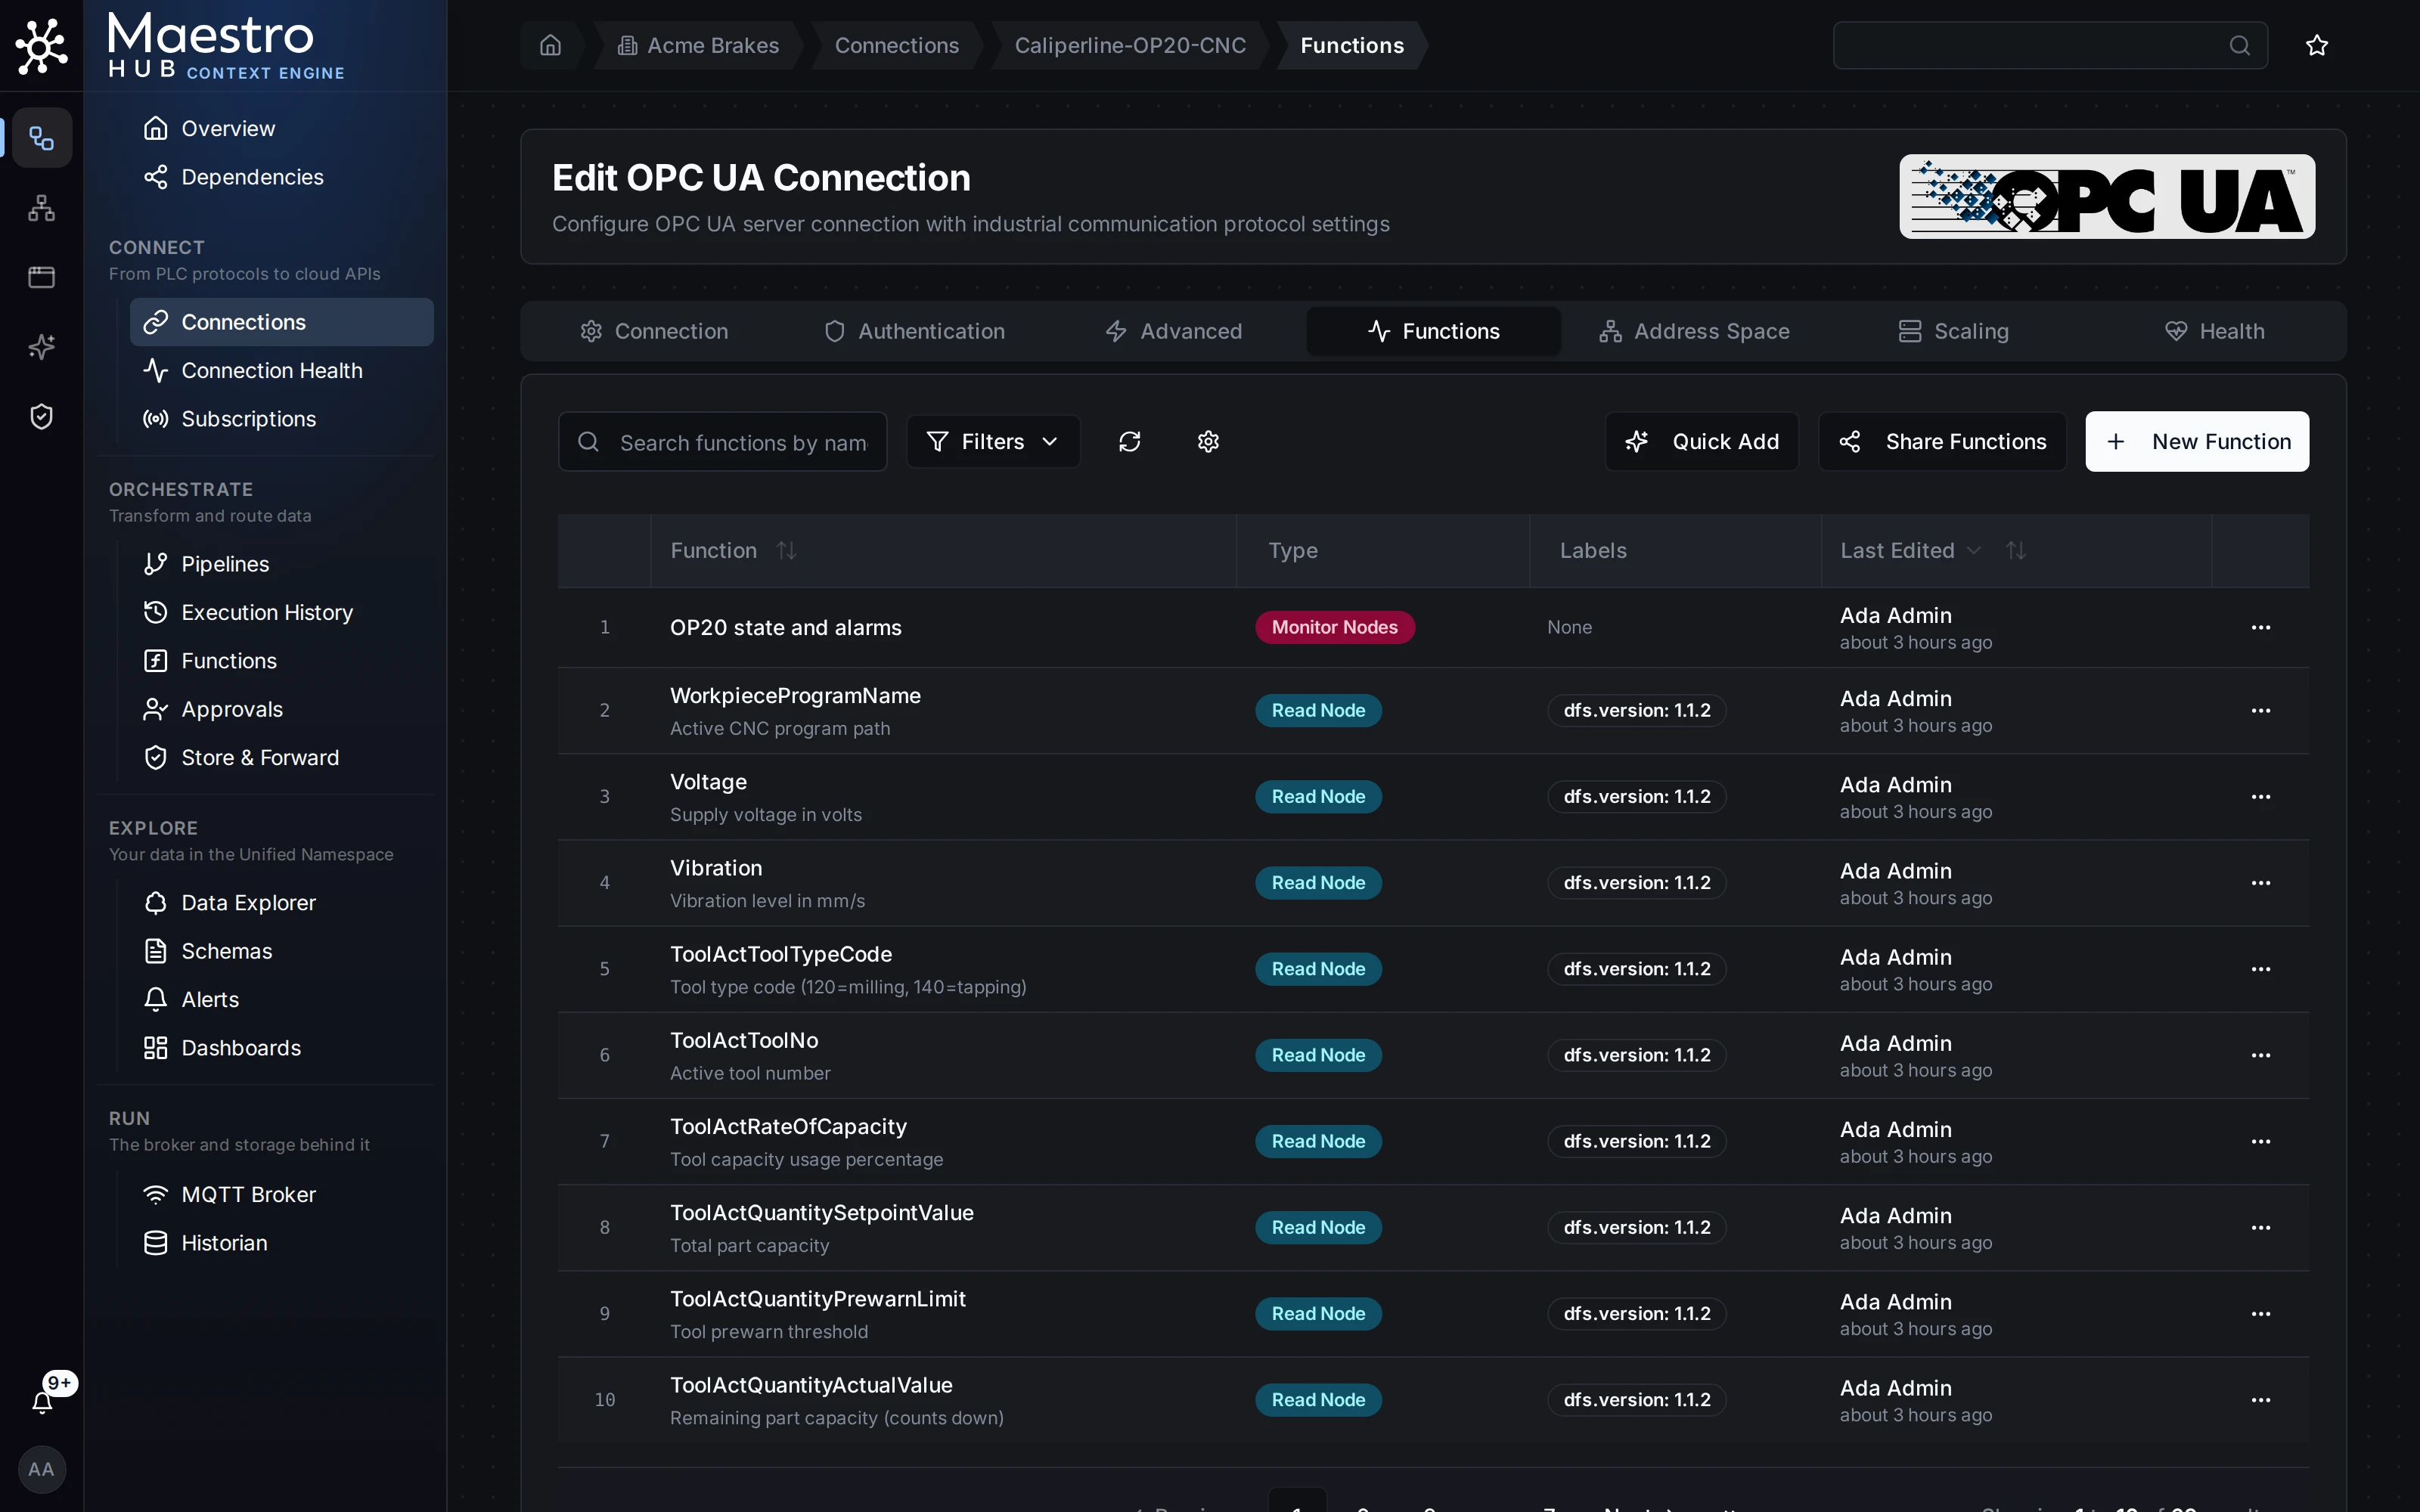
Bulk-define connector functions in seconds: pick the source, select the tags or items, and MaestroHub creates them all at once.
Open Quick Add
Quick Add lives on the connection's Functions tab. It is offered for OPC UA, Modbus, Siemens S7 and EtherNet/IP connections.
Pipeline Settings
Every pipeline starts here: name, description, step execution (parallel or sequential), priority, and run order (parallel, or one at a time in arrival order).
Open the Pipelines page
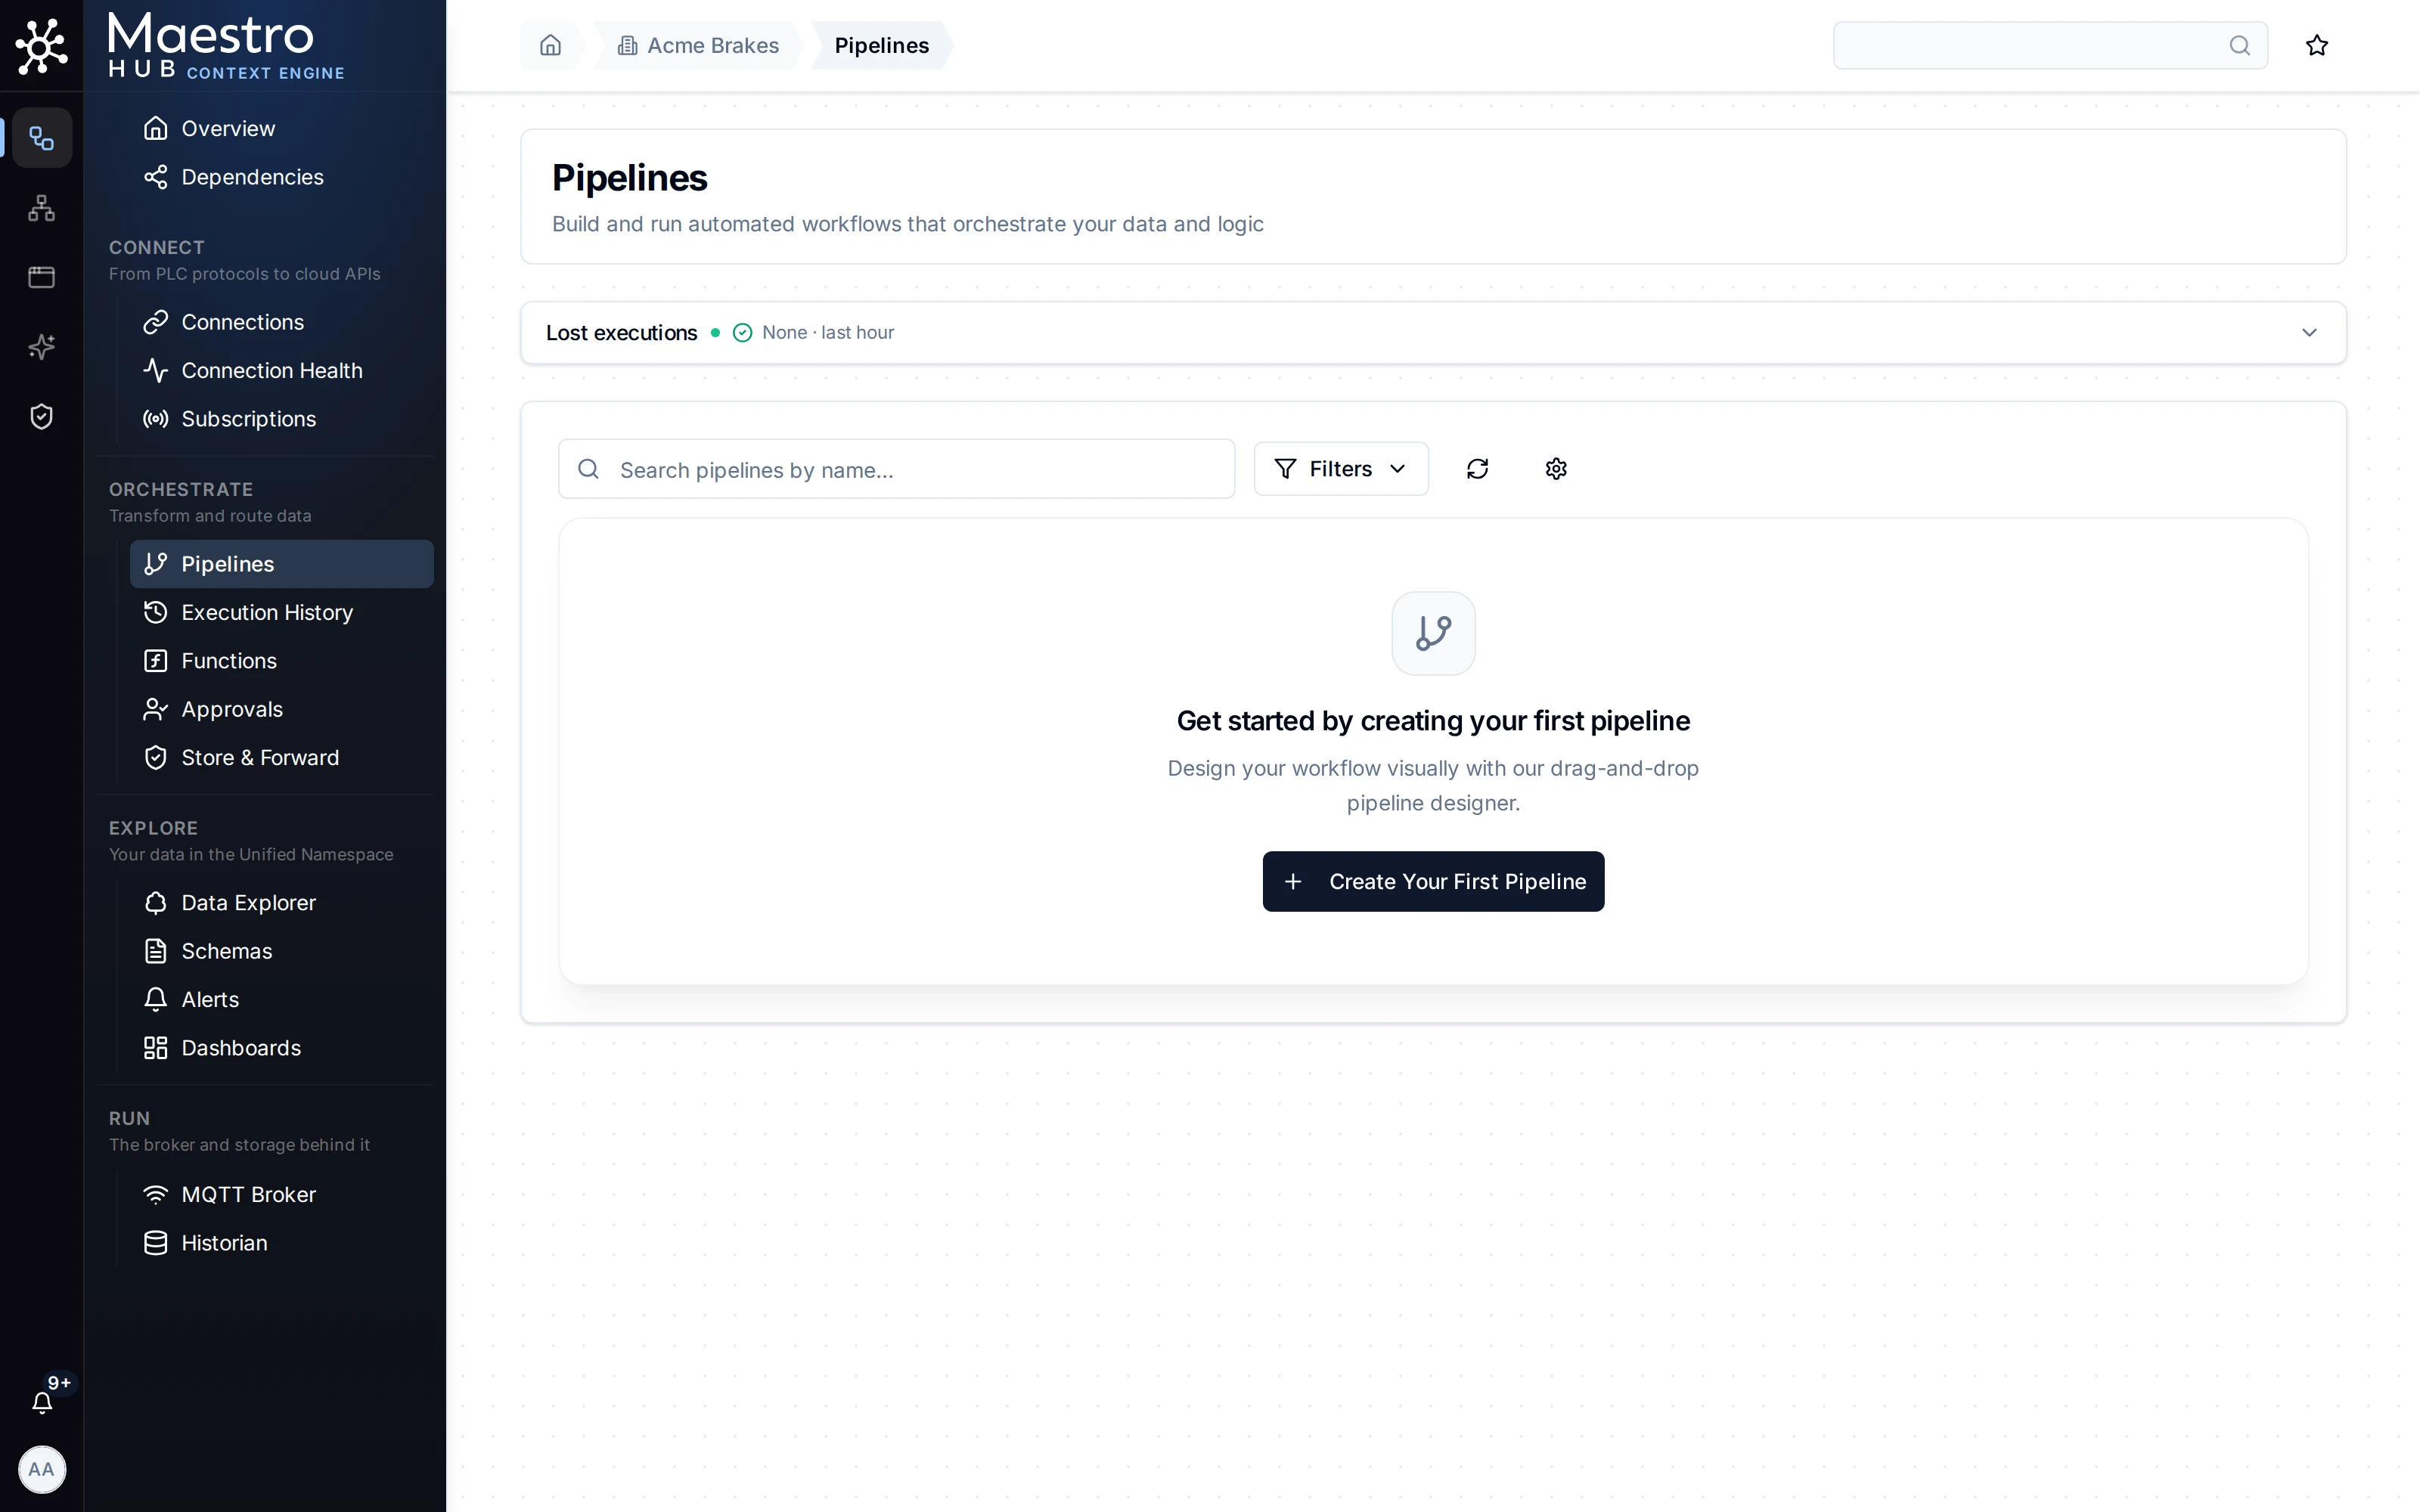
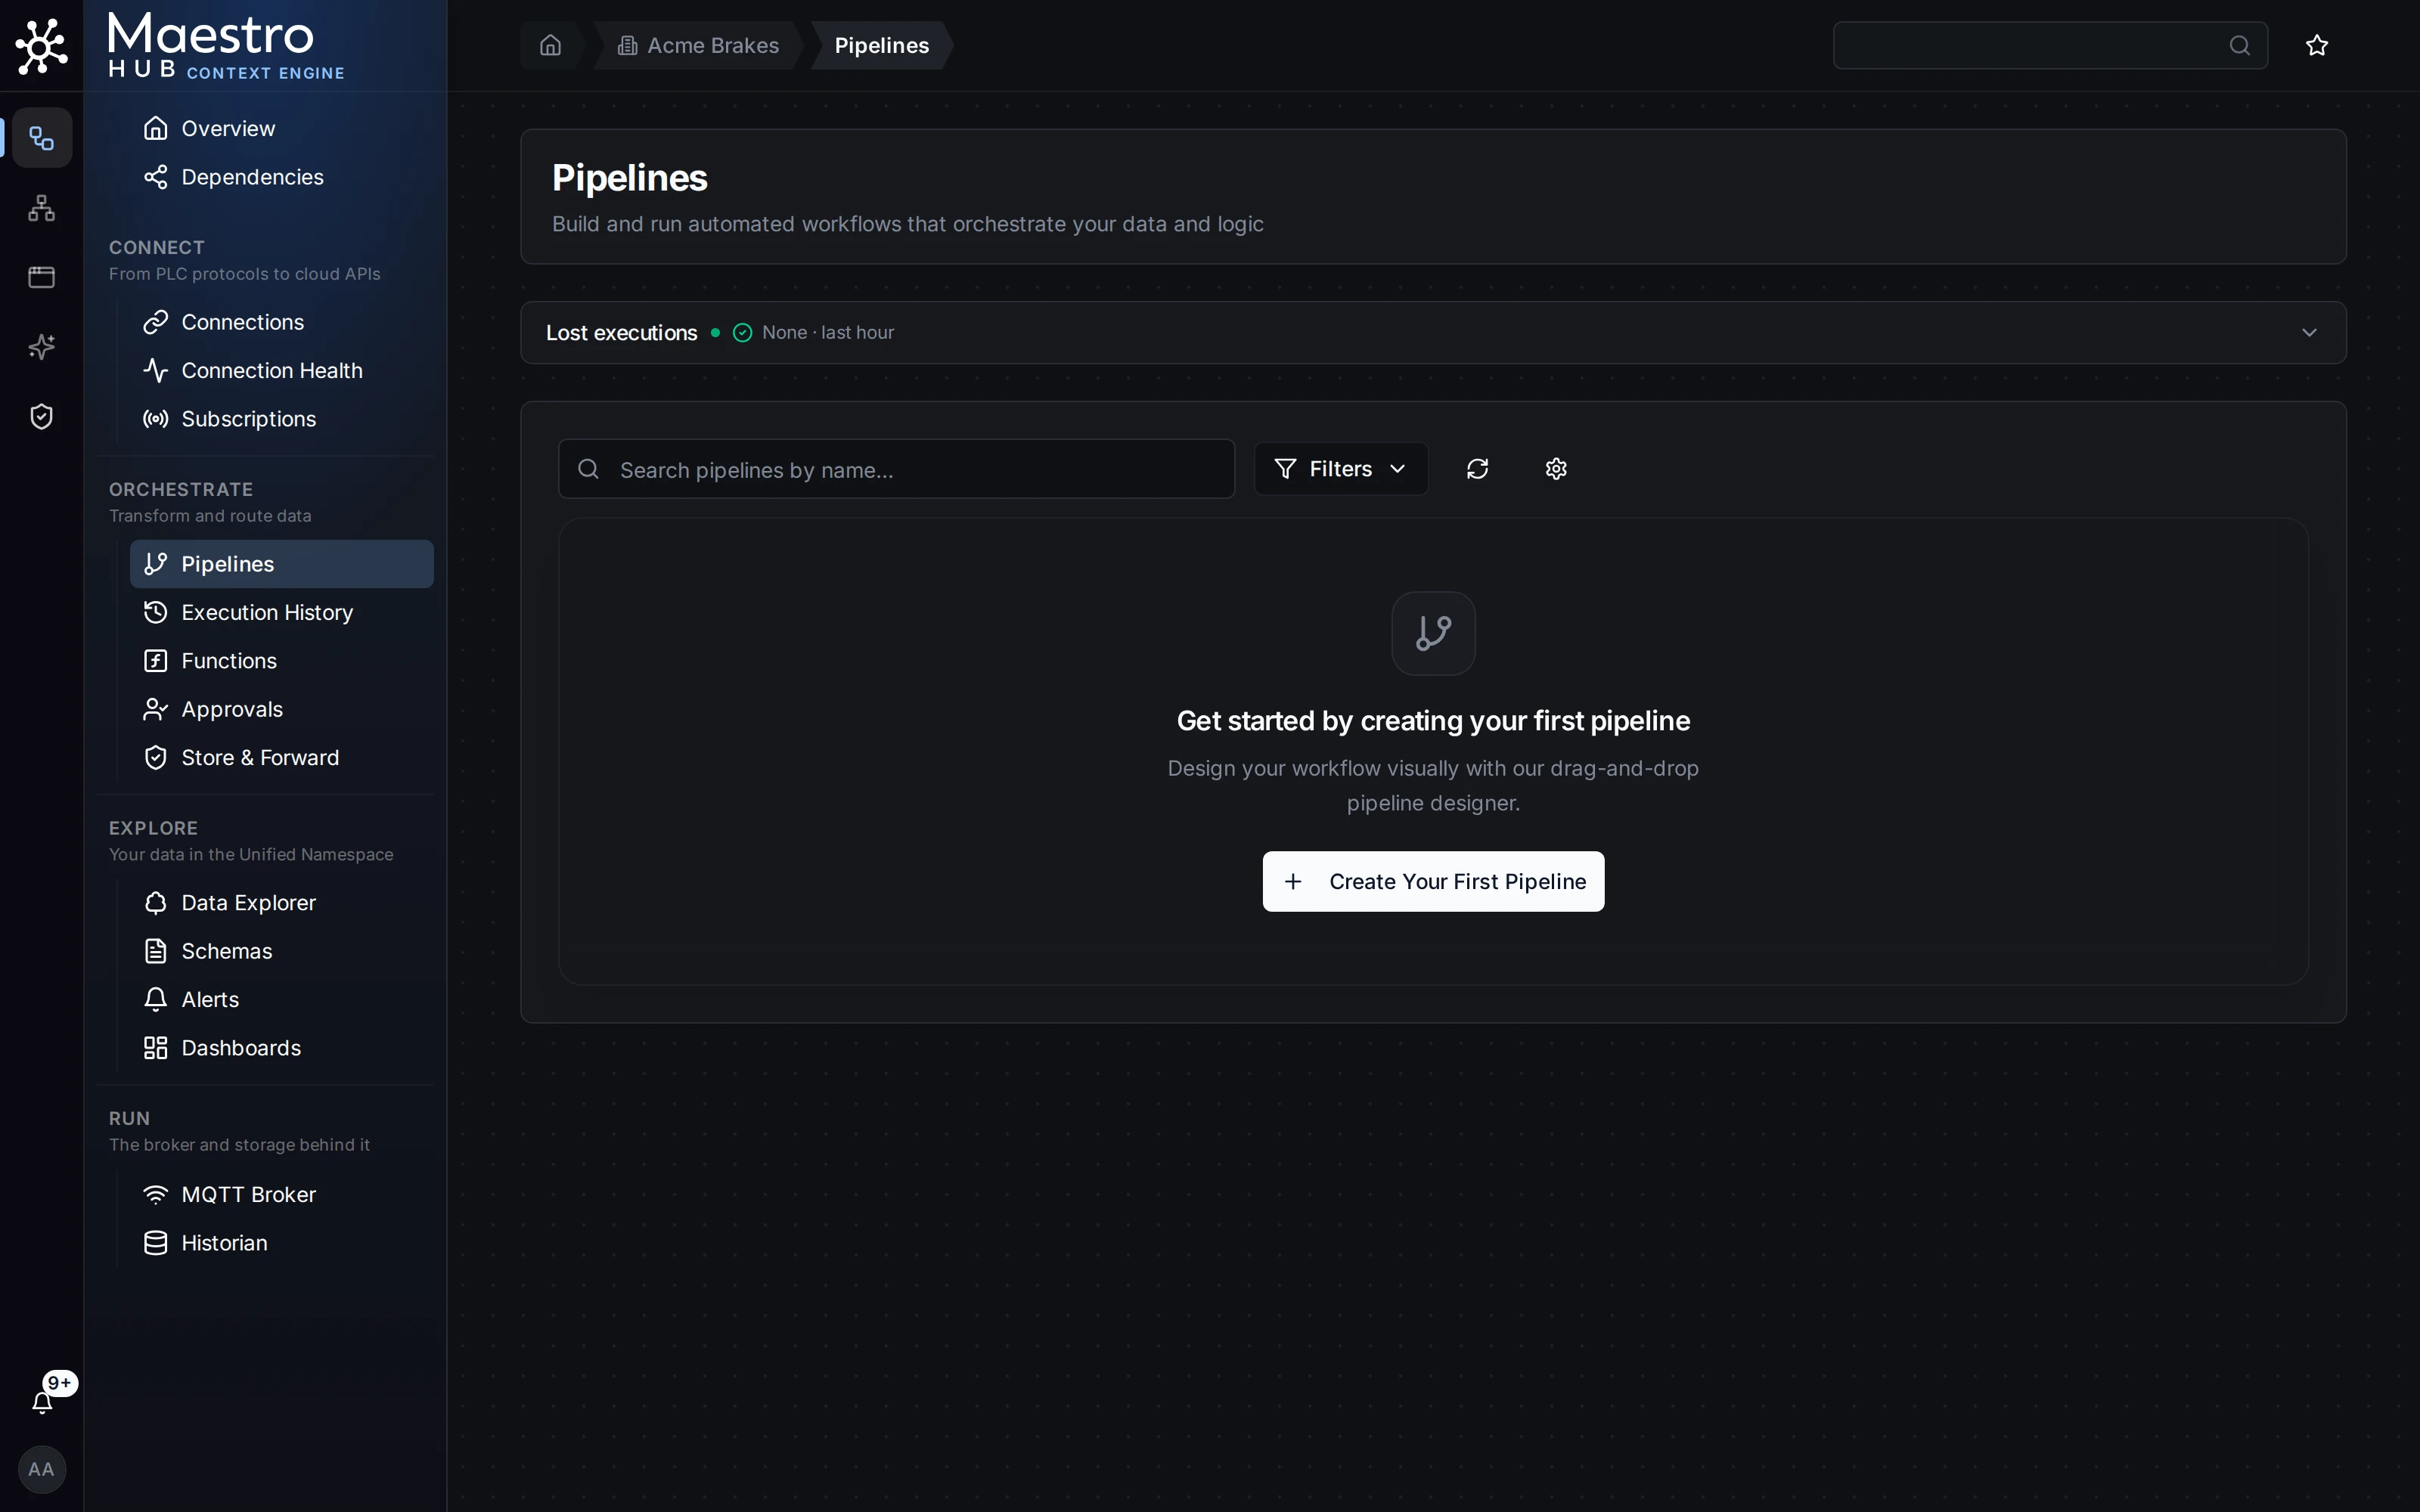
Orchestrate › Pipelines lists the pipelines in the workspace. In a workspace without any, the page offers to create the first one.
Pipeline Triggers
Triggers decide when a pipeline runs: schedule, webhook, UNS subscription, MQTT, OPC UA, manual, or chain off another pipeline's completion.
Node Library
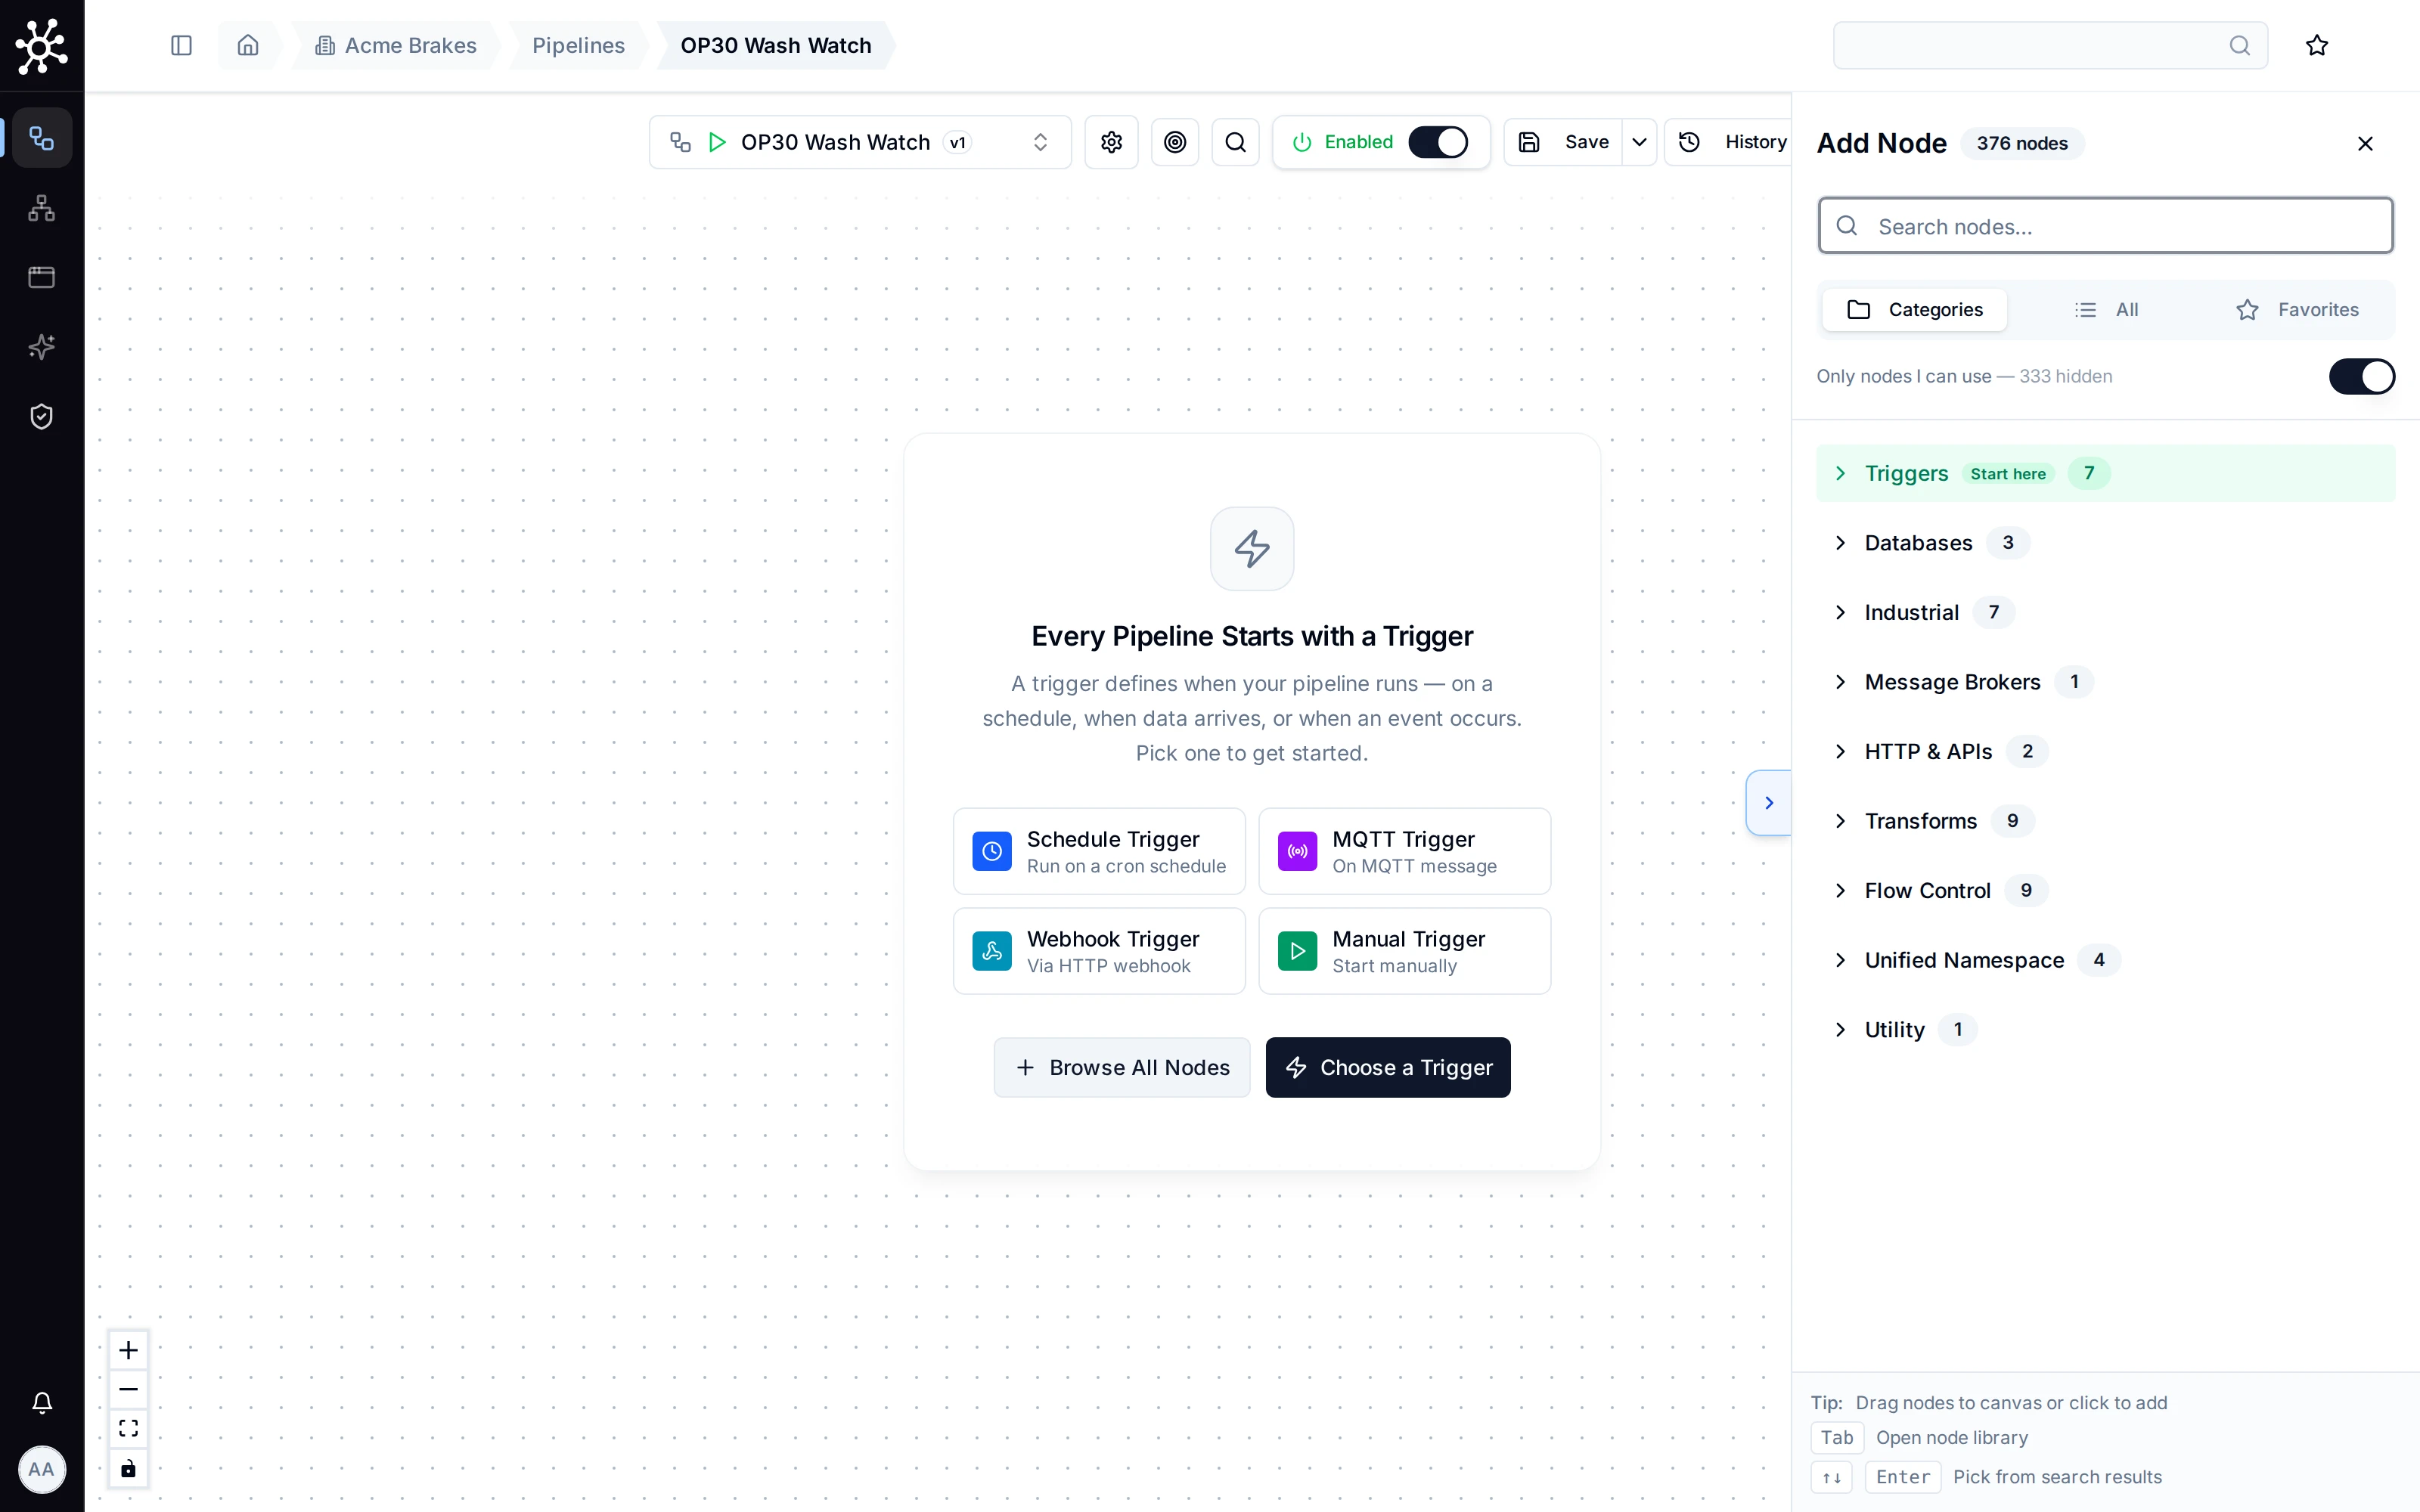
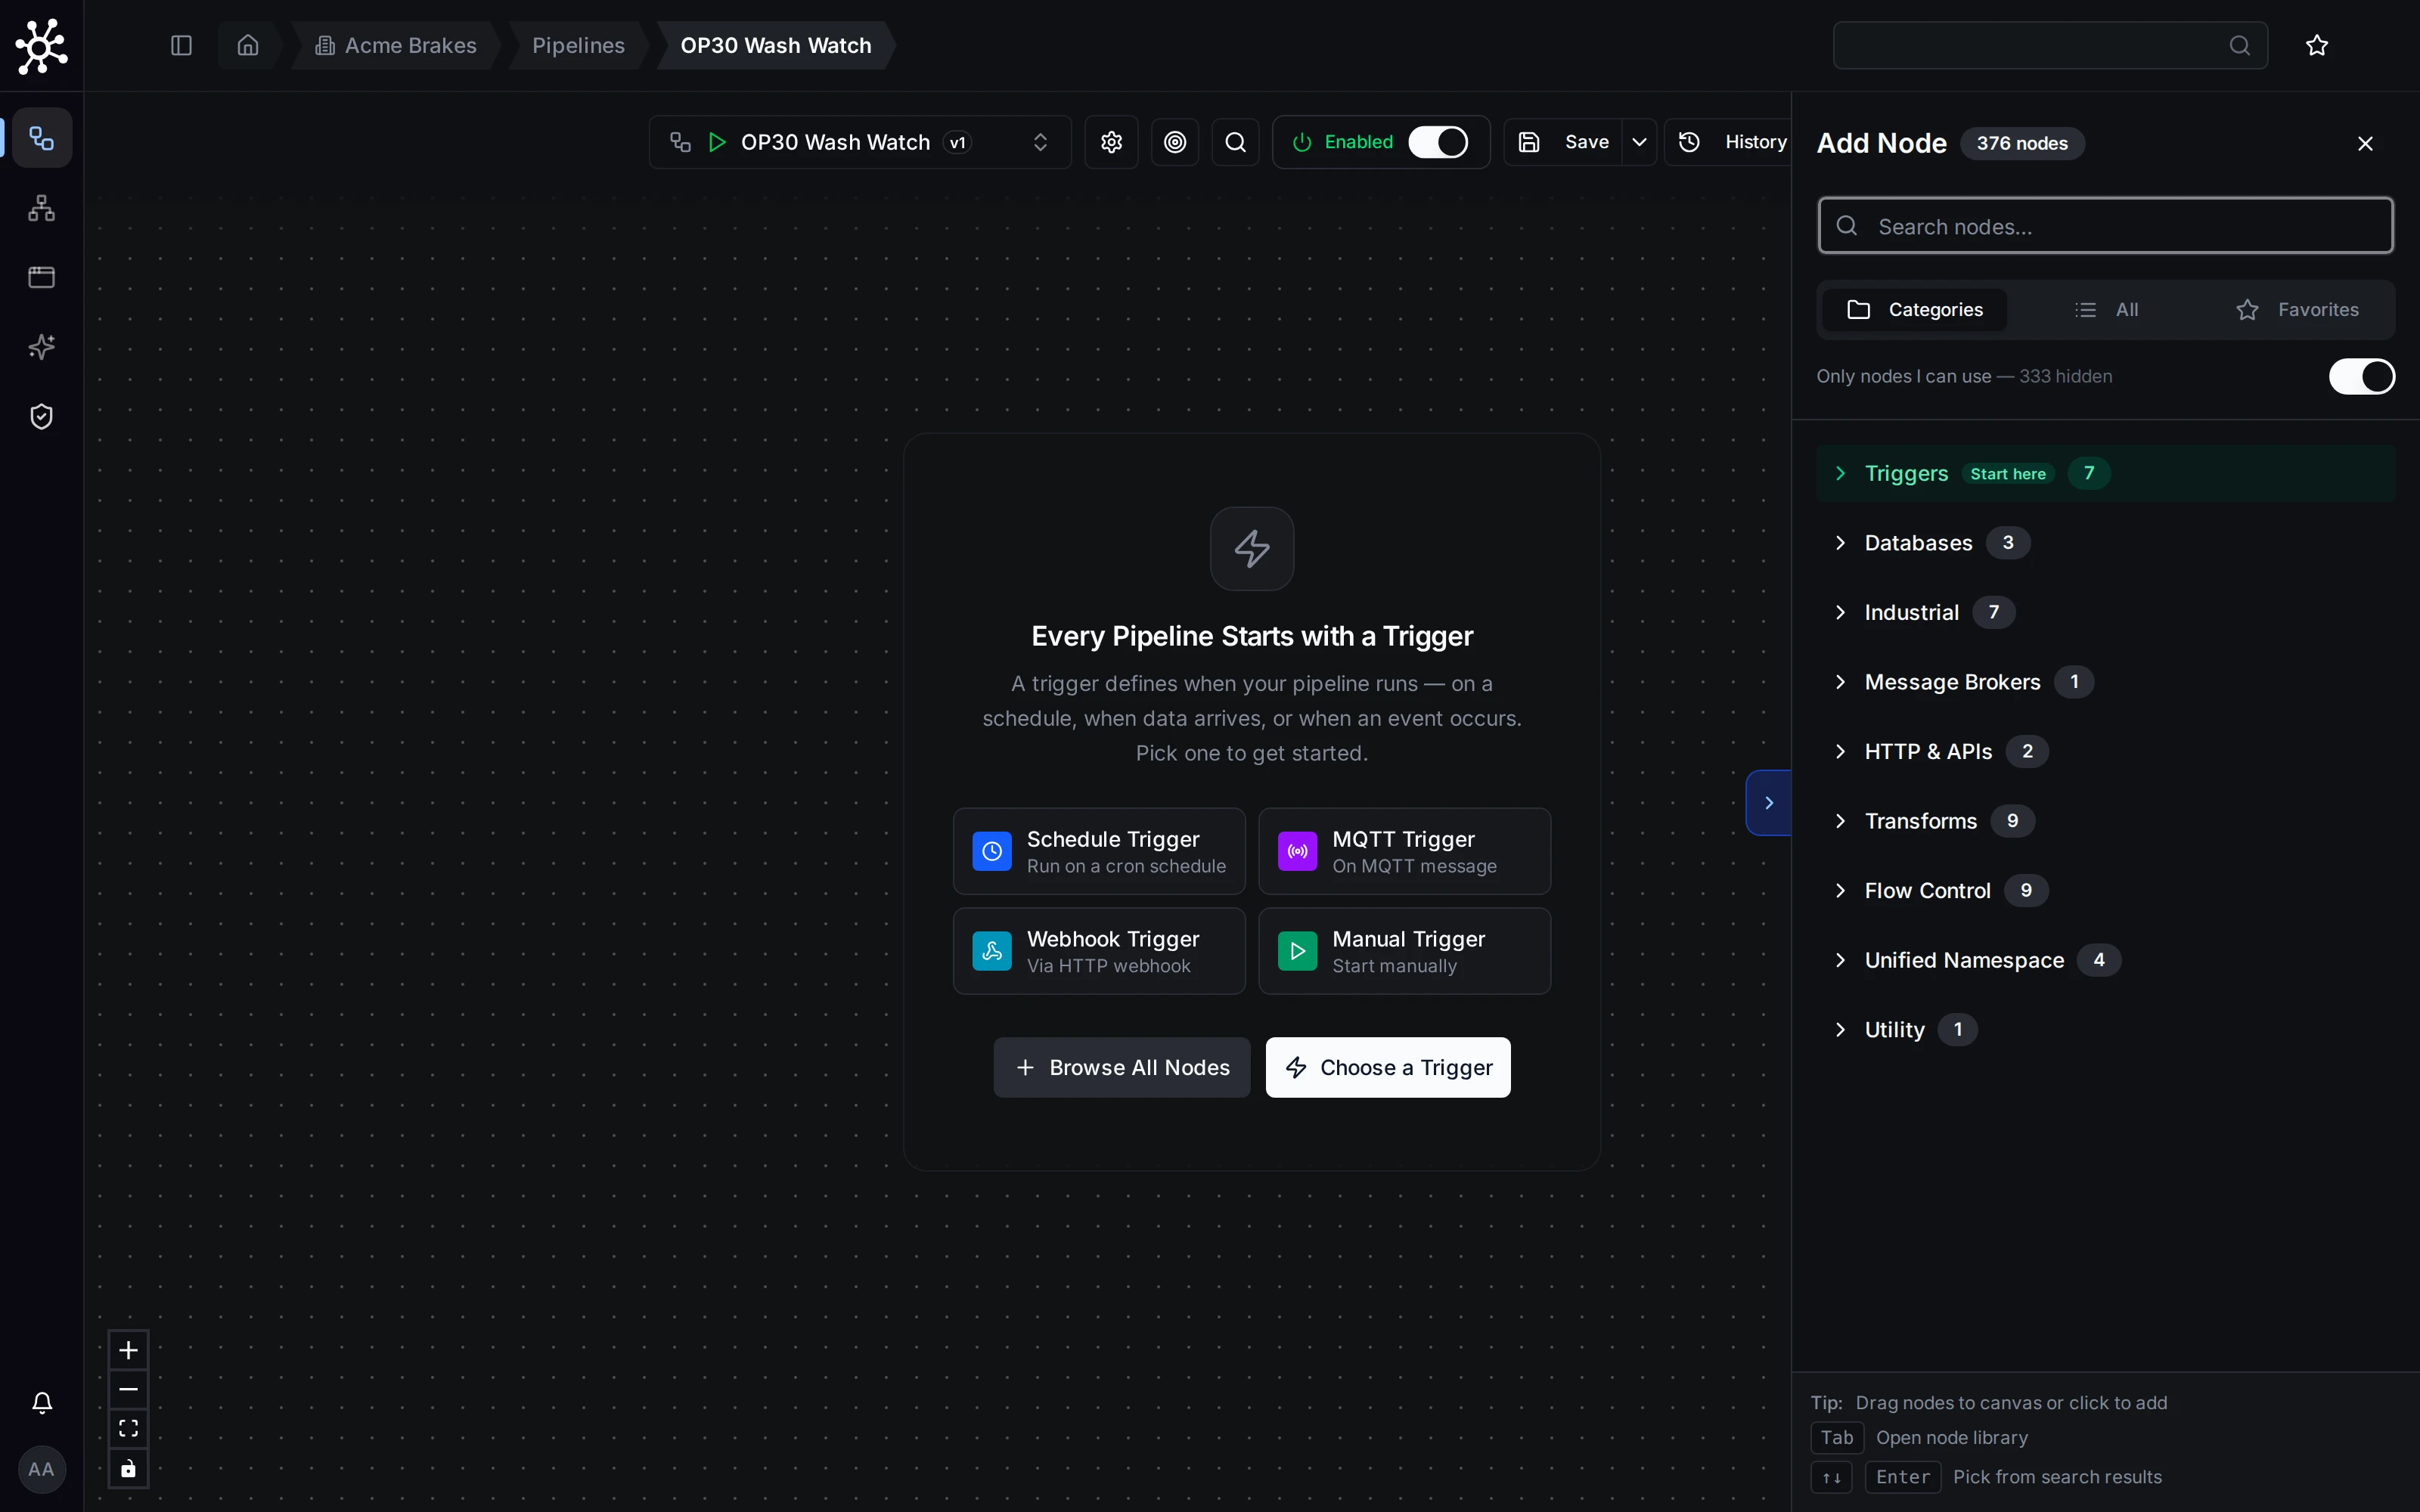
An empty pipeline asks for a trigger first. Browse All Nodes (or the Tab key) opens the Add Node panel, where you find every node, triggers included.
Pipeline Example I
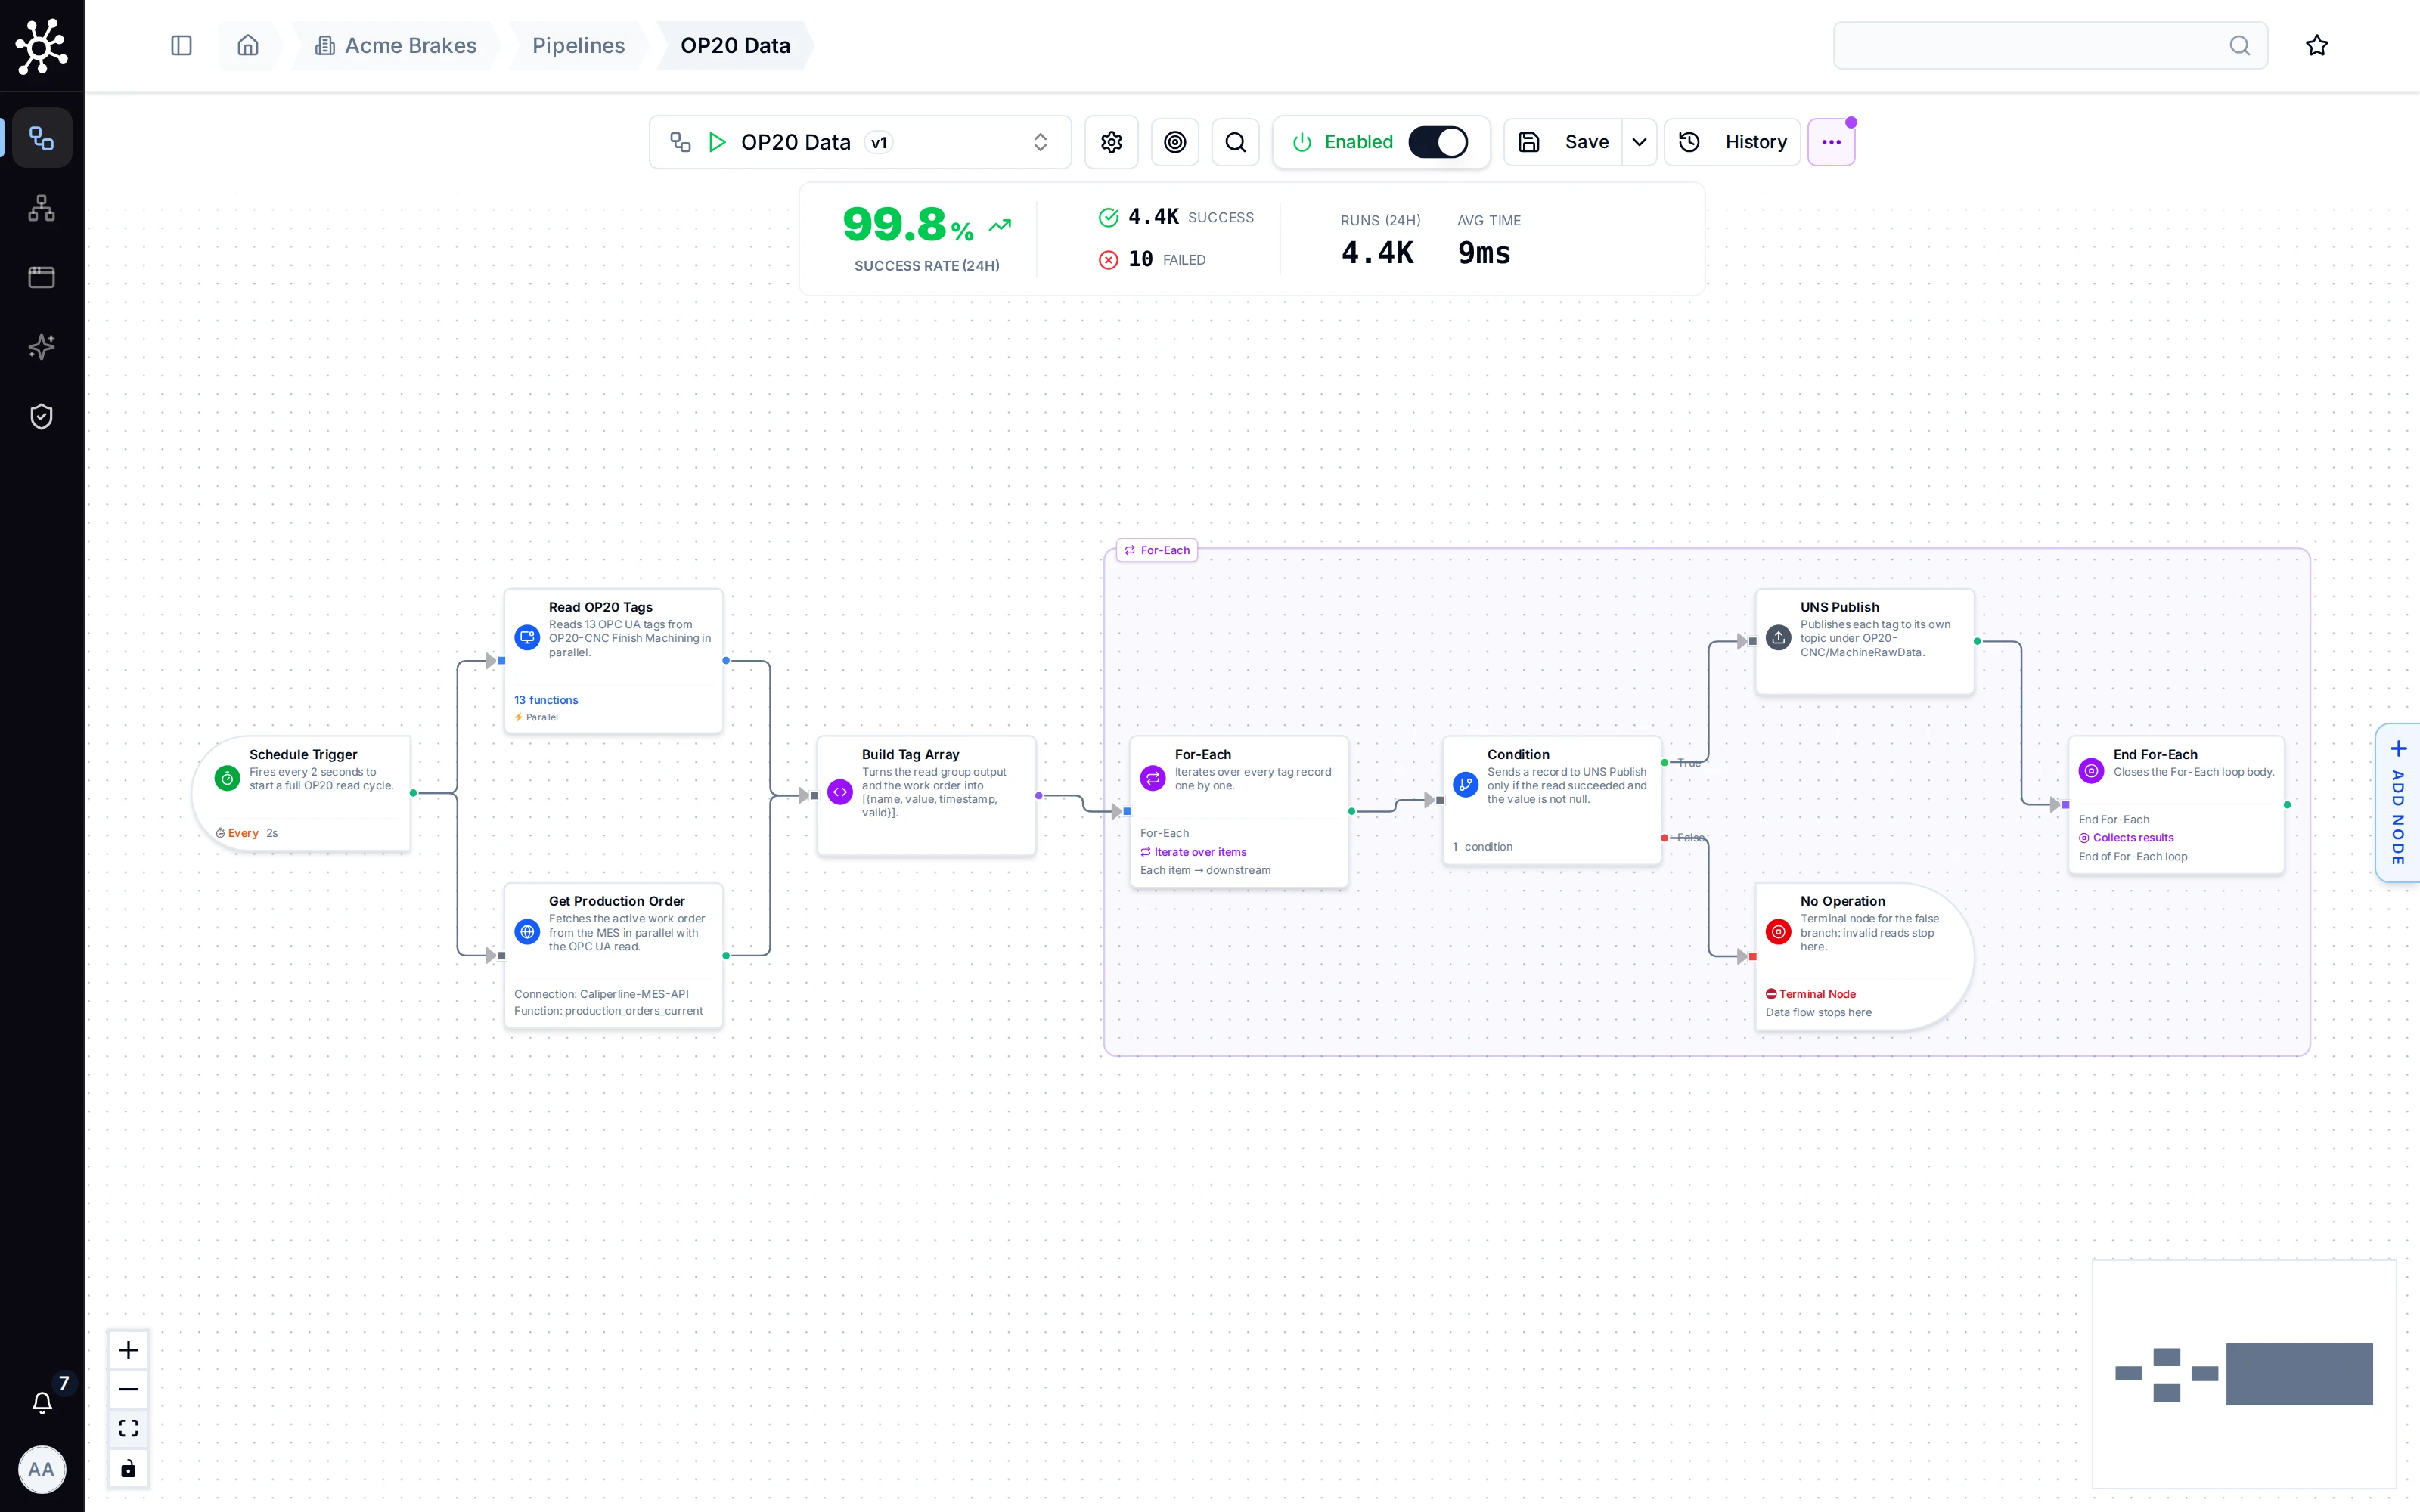
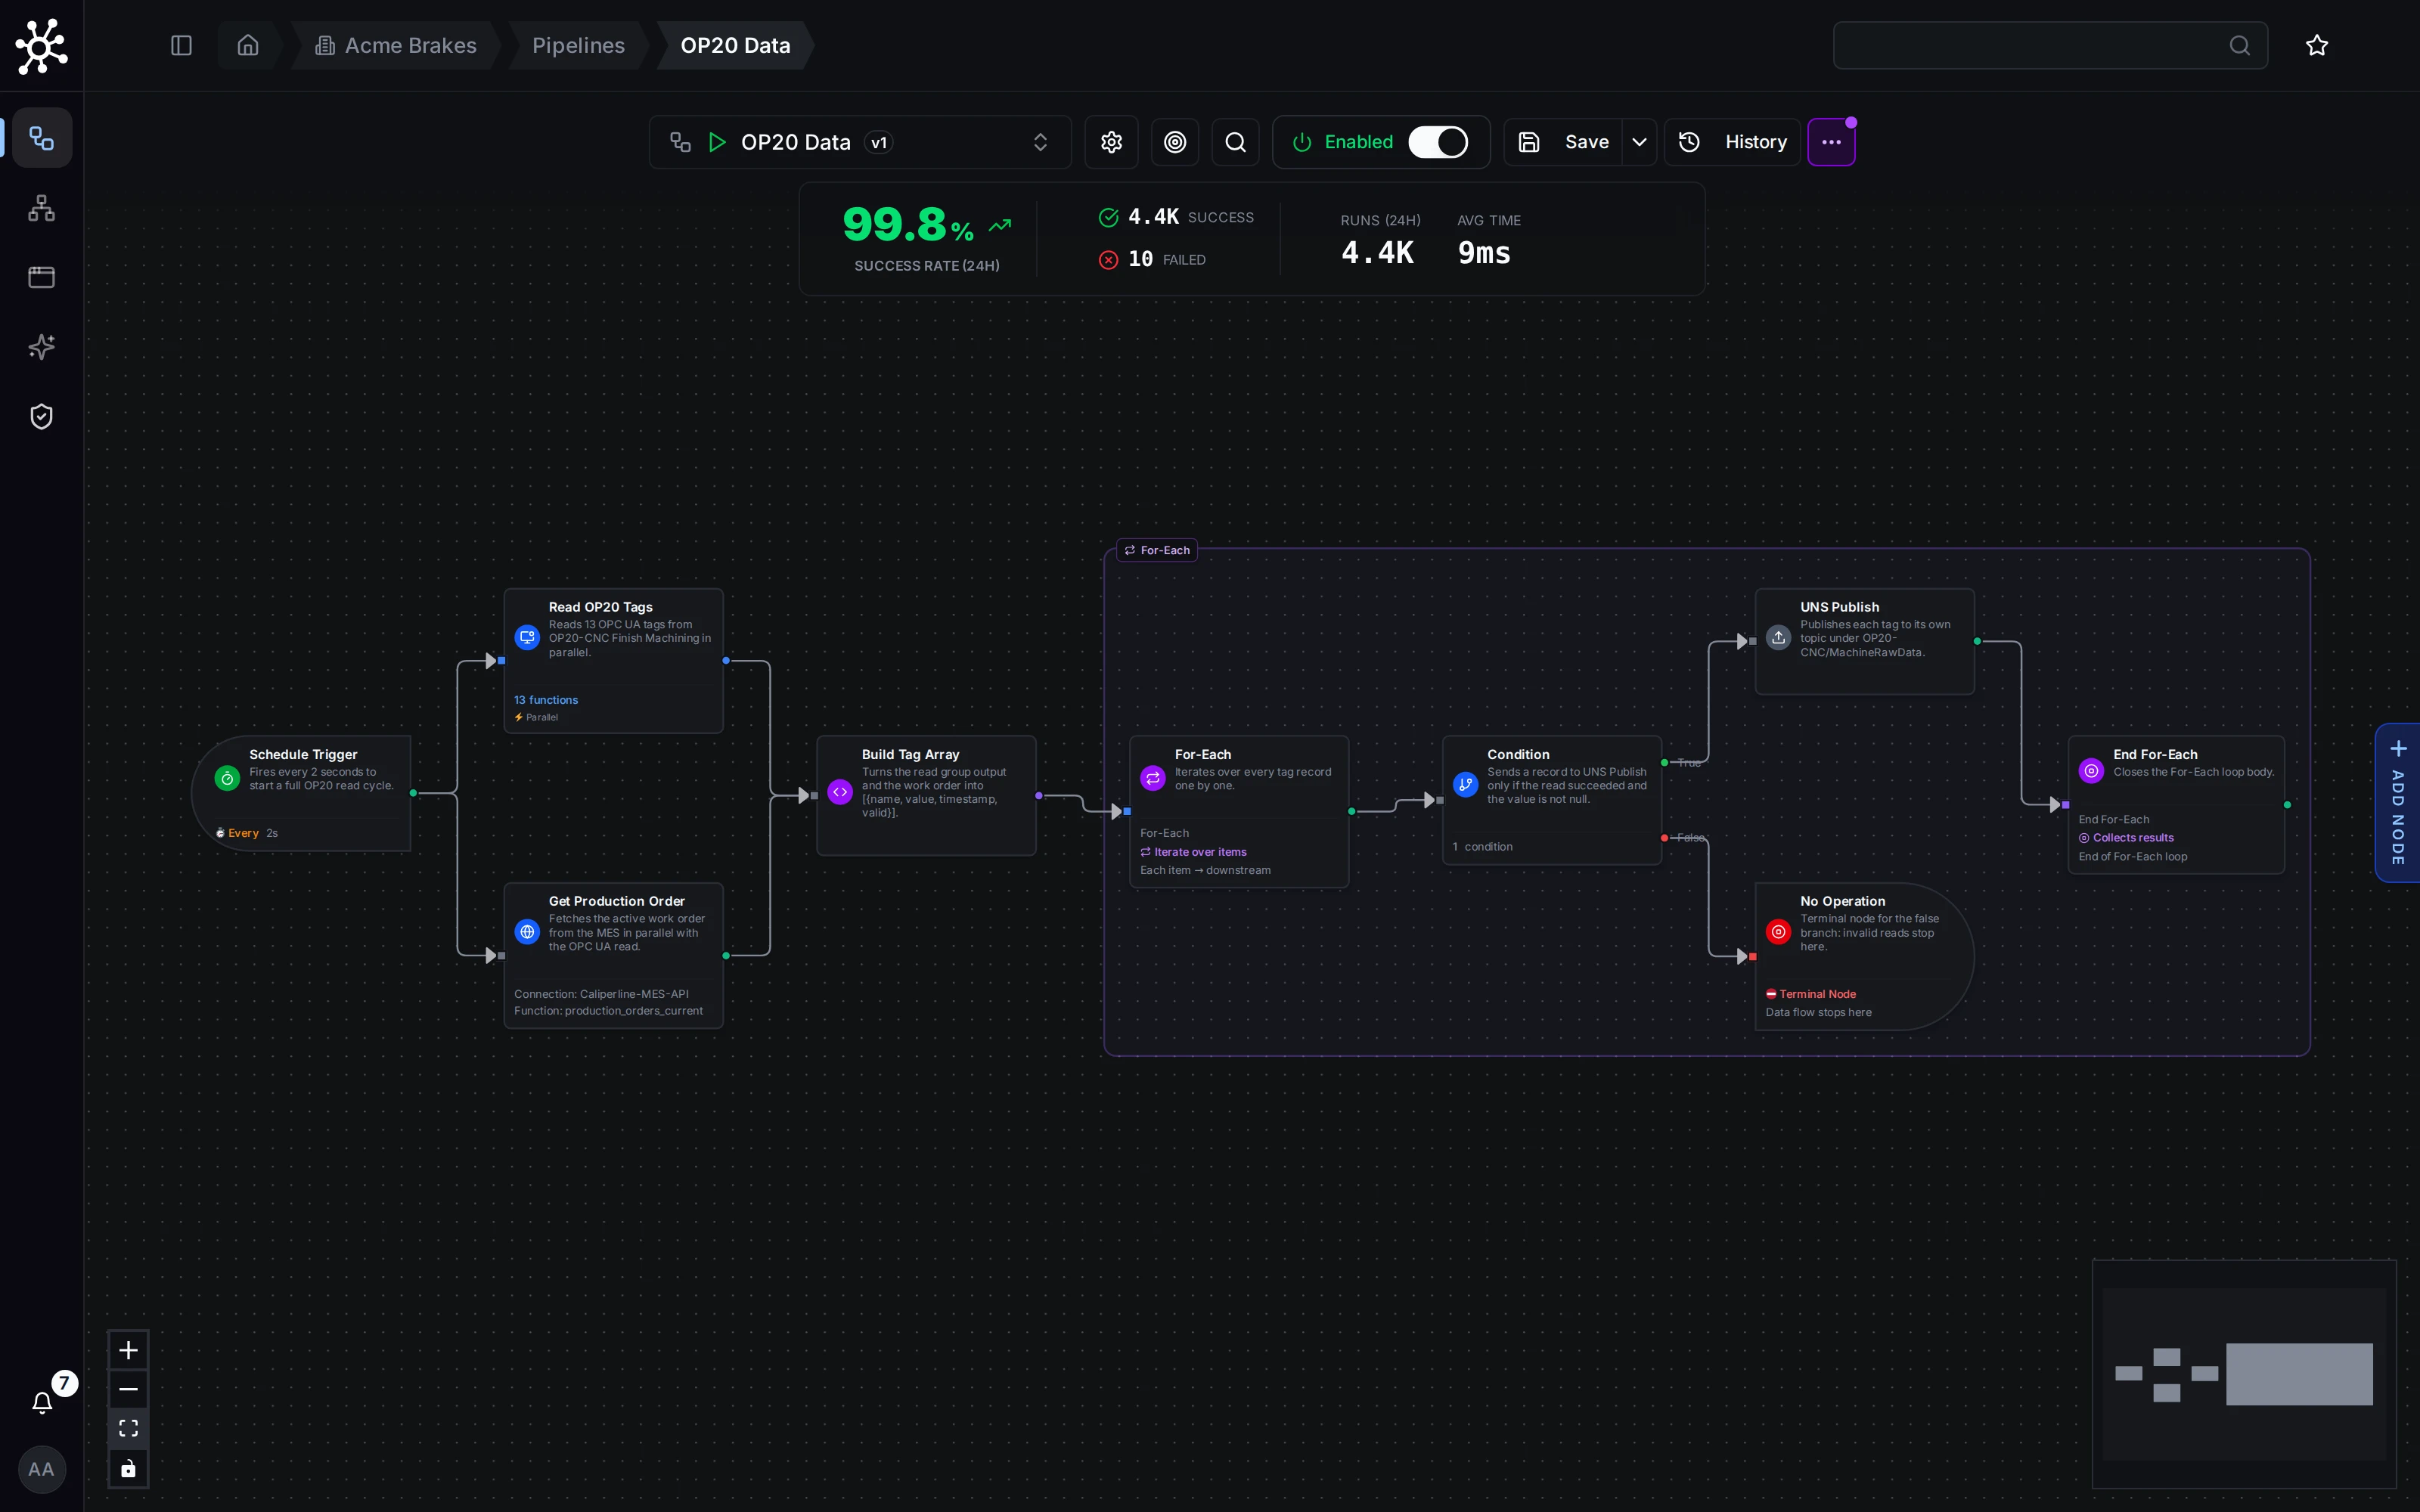
An end-to-end pipeline build, from blank canvas to a running flow: drag, connect, configure, test, enable.
Pipeline Designer: Overview
Every 2 seconds, this pipeline reads 13 OPC UA tags from OP20-CNC Finish Machining and the active work order from MES, then publishes each valid value to its own UNS topic, …/OP20-CNC/MachineRawData/{tagName}. The metrics panel above the canvas shows how the runs are going.
Pipeline Example 1: History
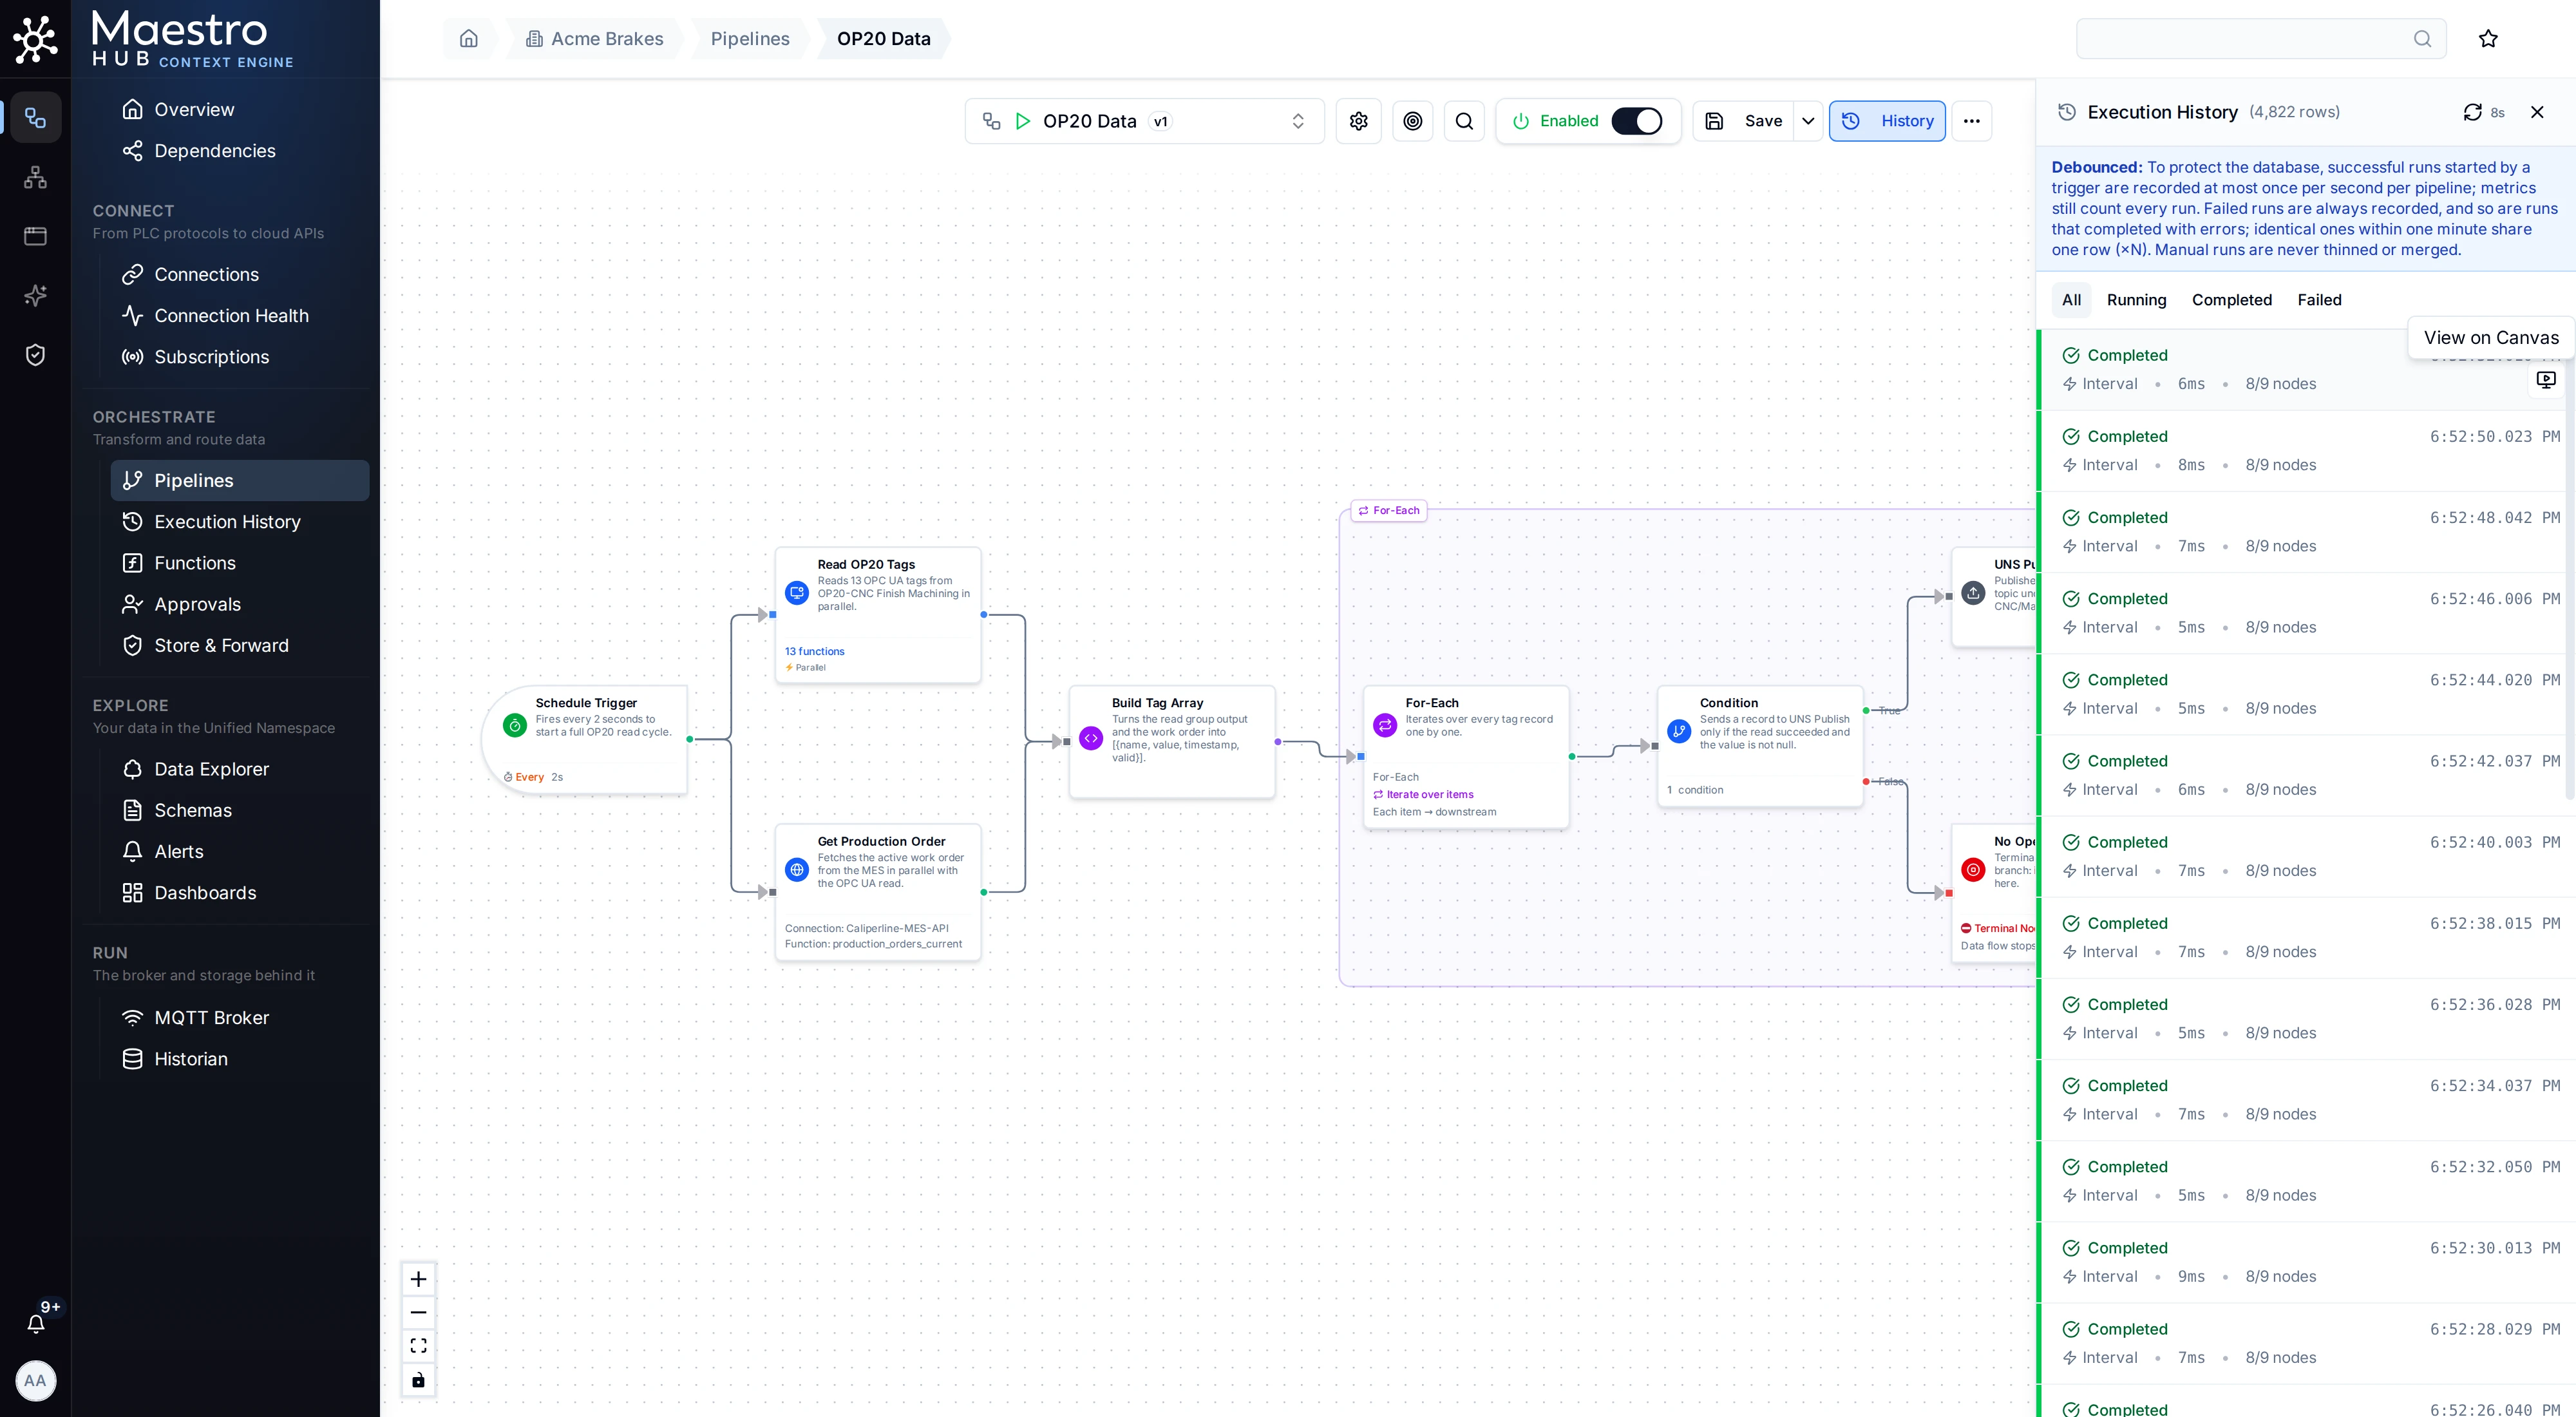
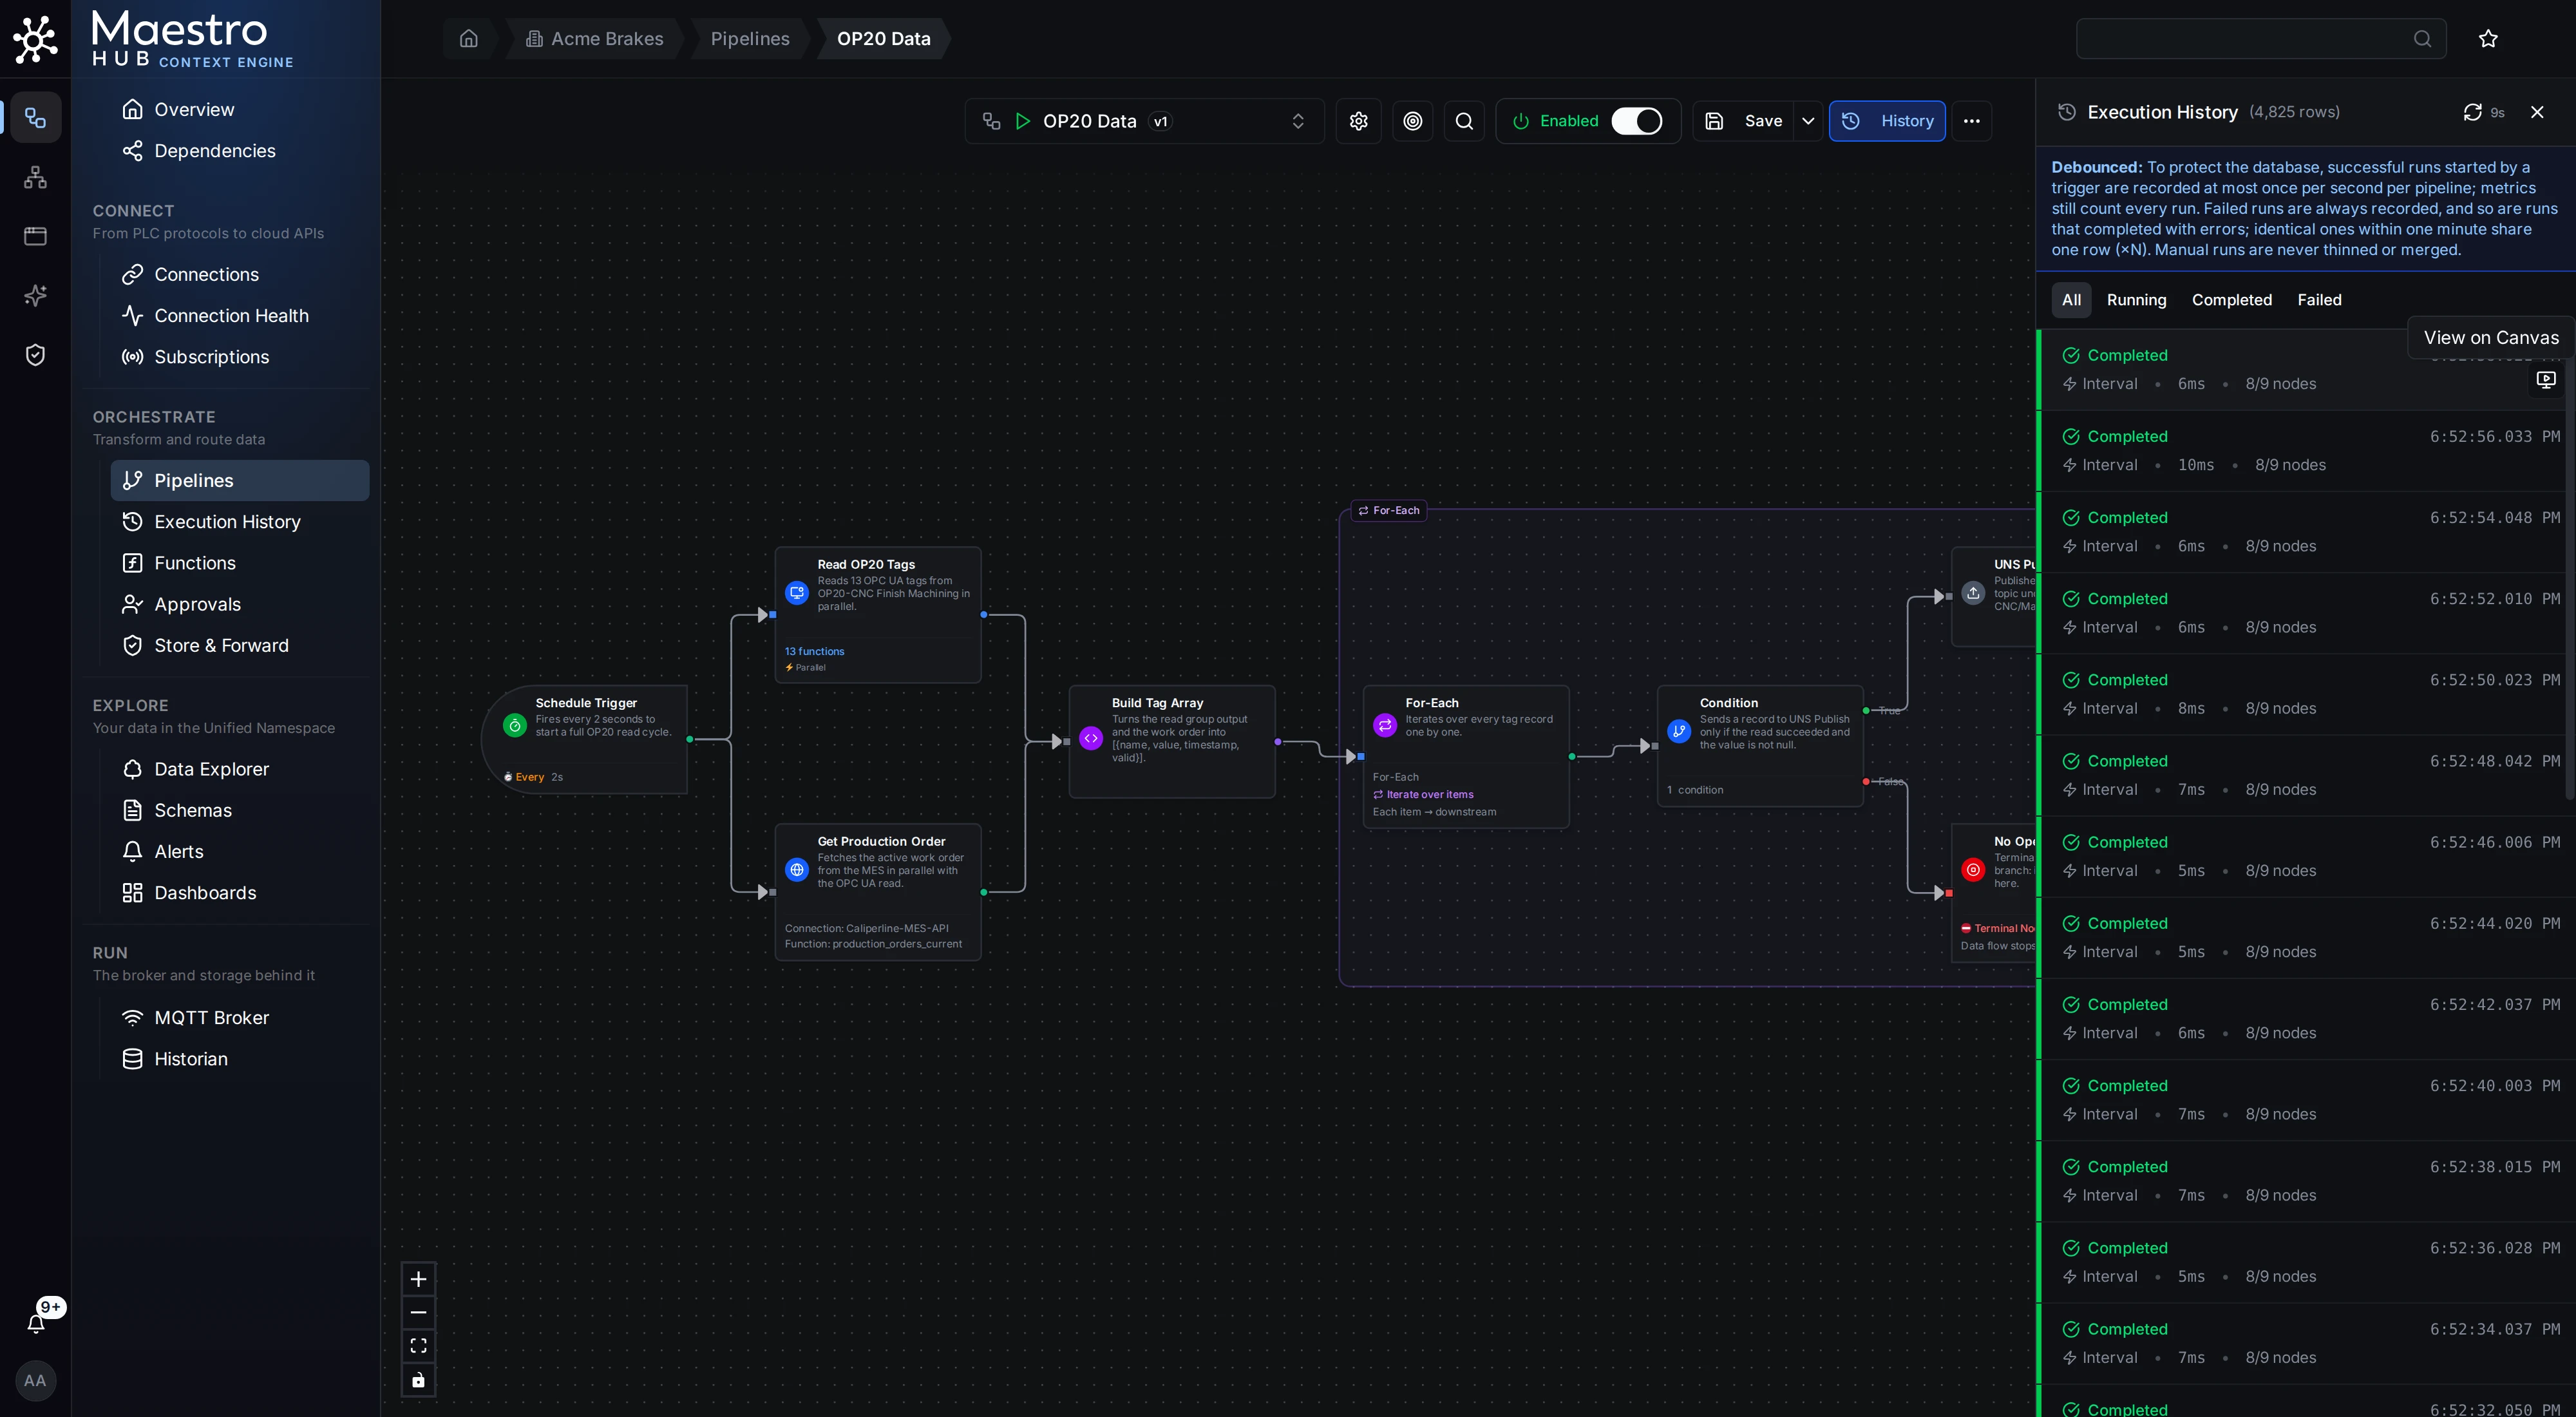
The same pipeline once it is running: its execution history and a replay of each run, node by node.
Replay: Execution History
History in the pipeline toolbar opens the Execution History sidebar for the OP20 Data pipeline from Pipeline Example I. Each row is one recorded run, and any run can be opened in Execution Replay.
Pipeline Example II
A second worked example with a different trigger and node mix, to show how the same primitives compose into very different pipelines.
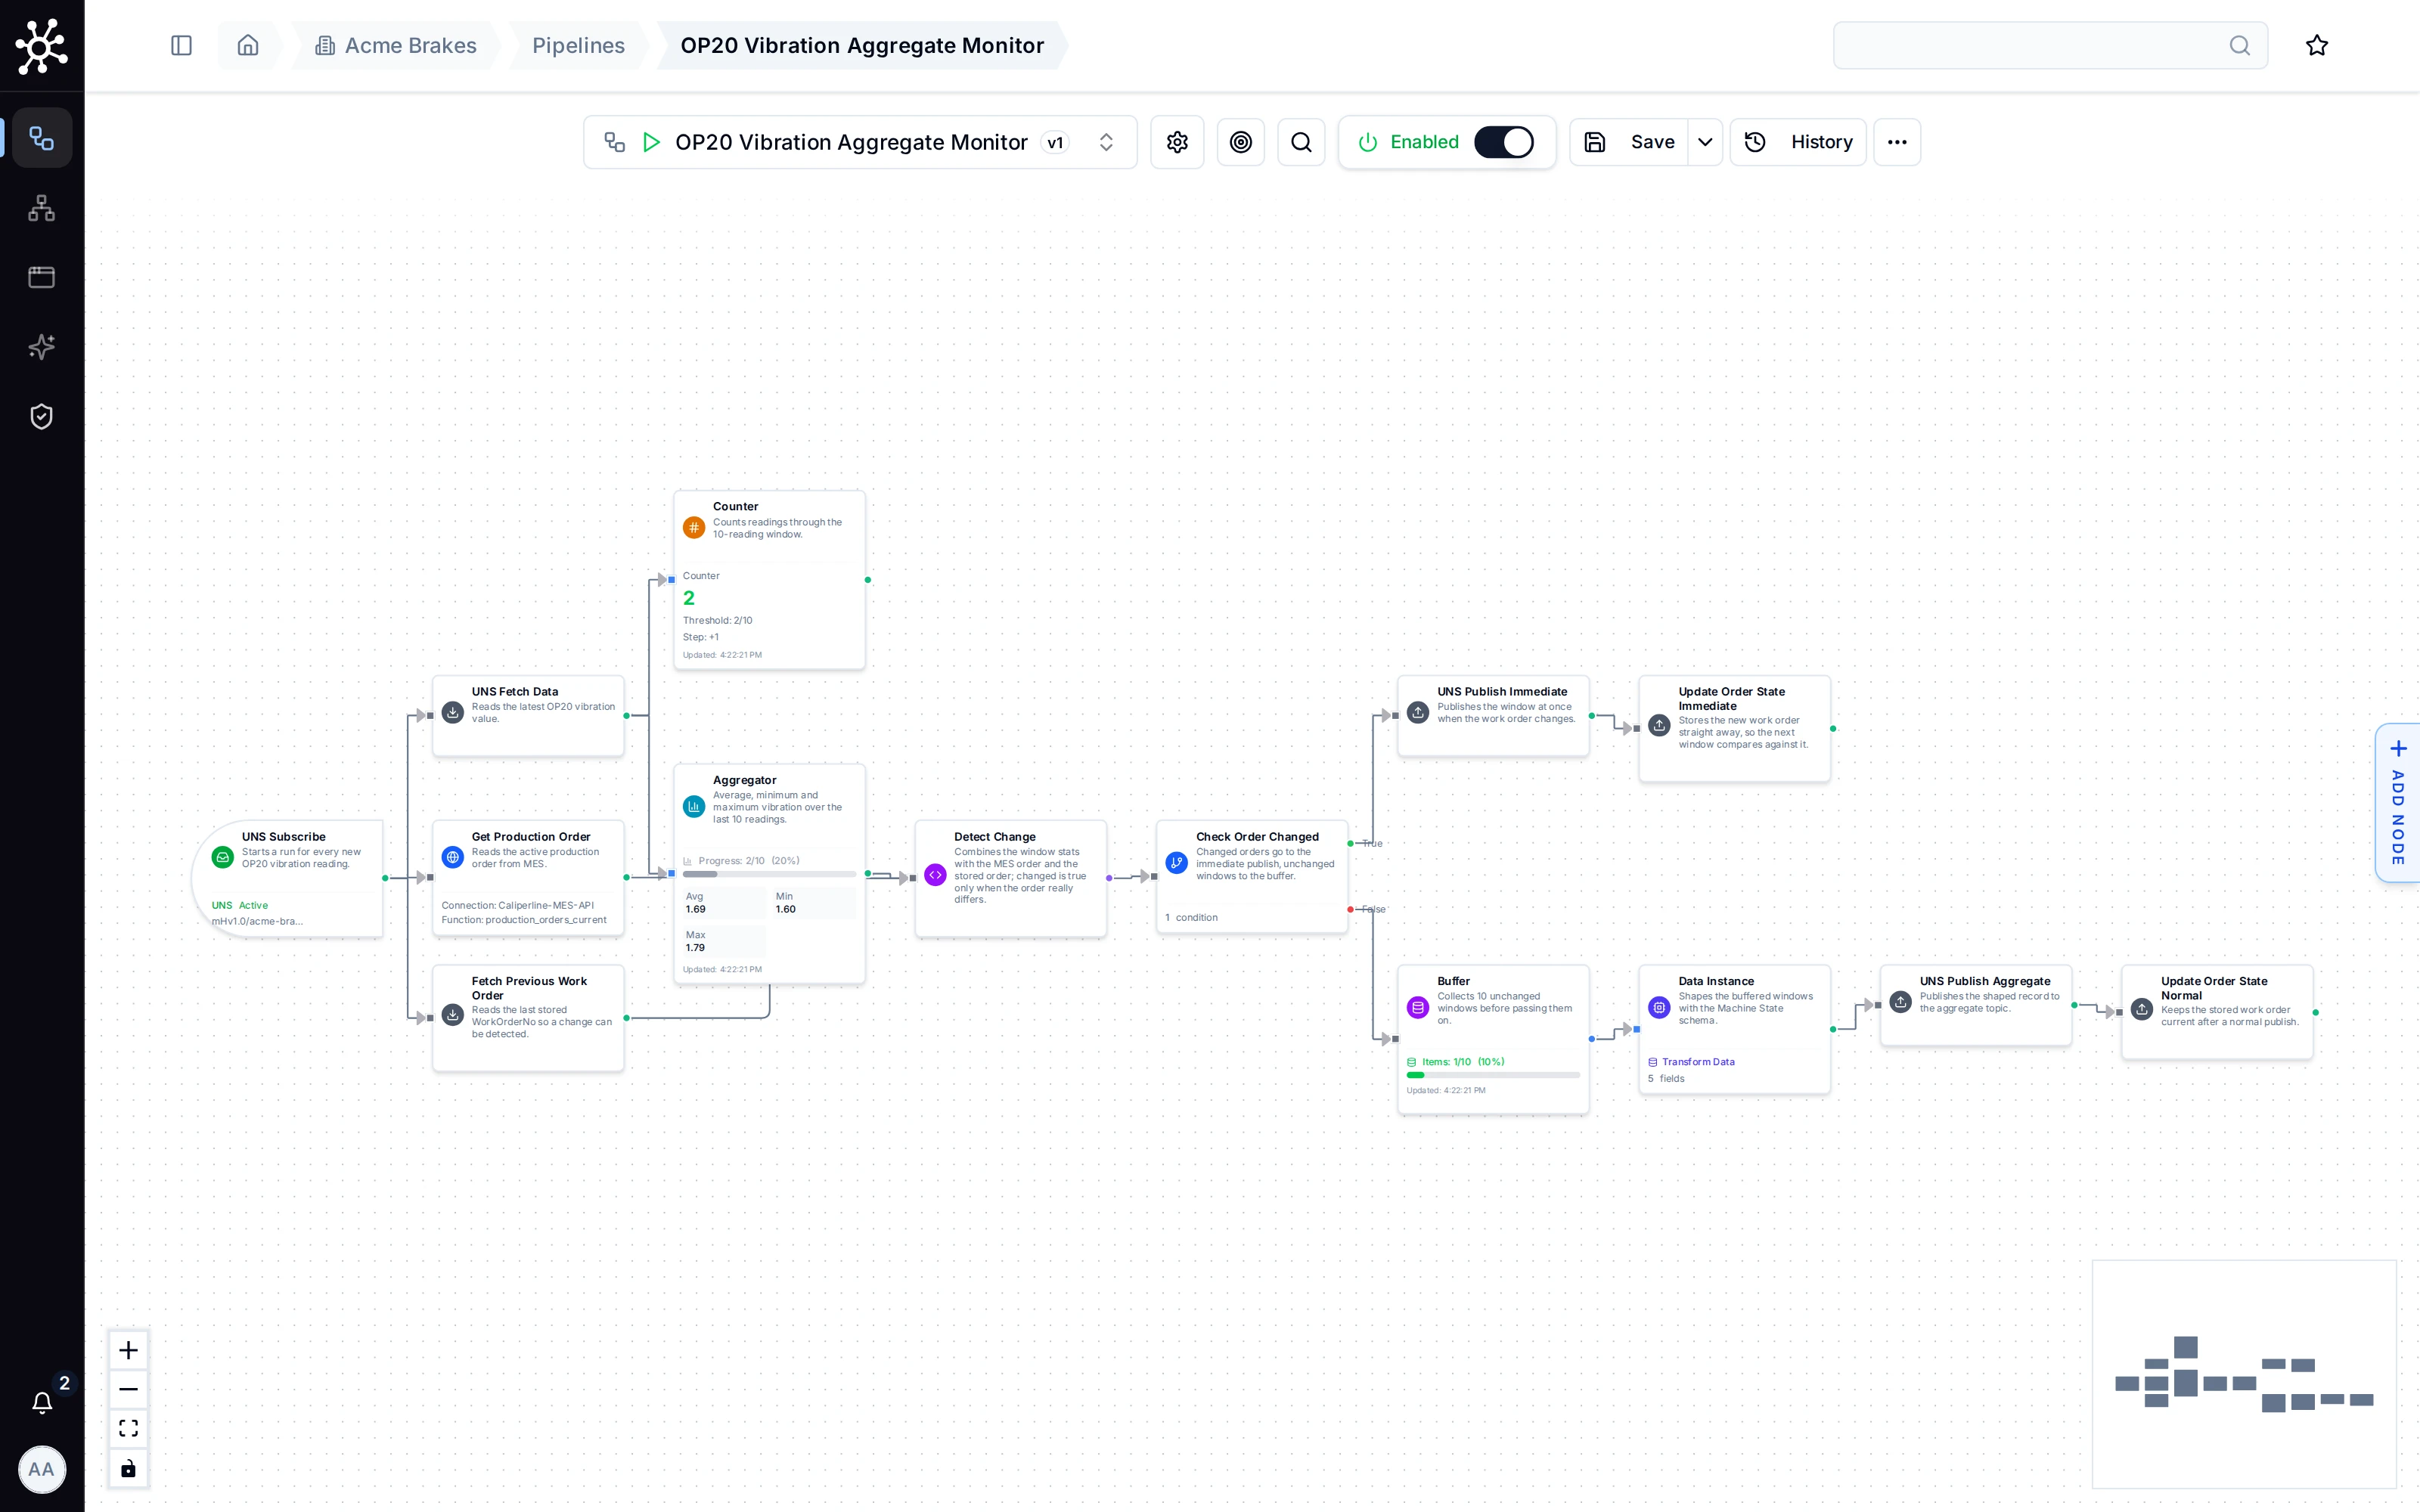
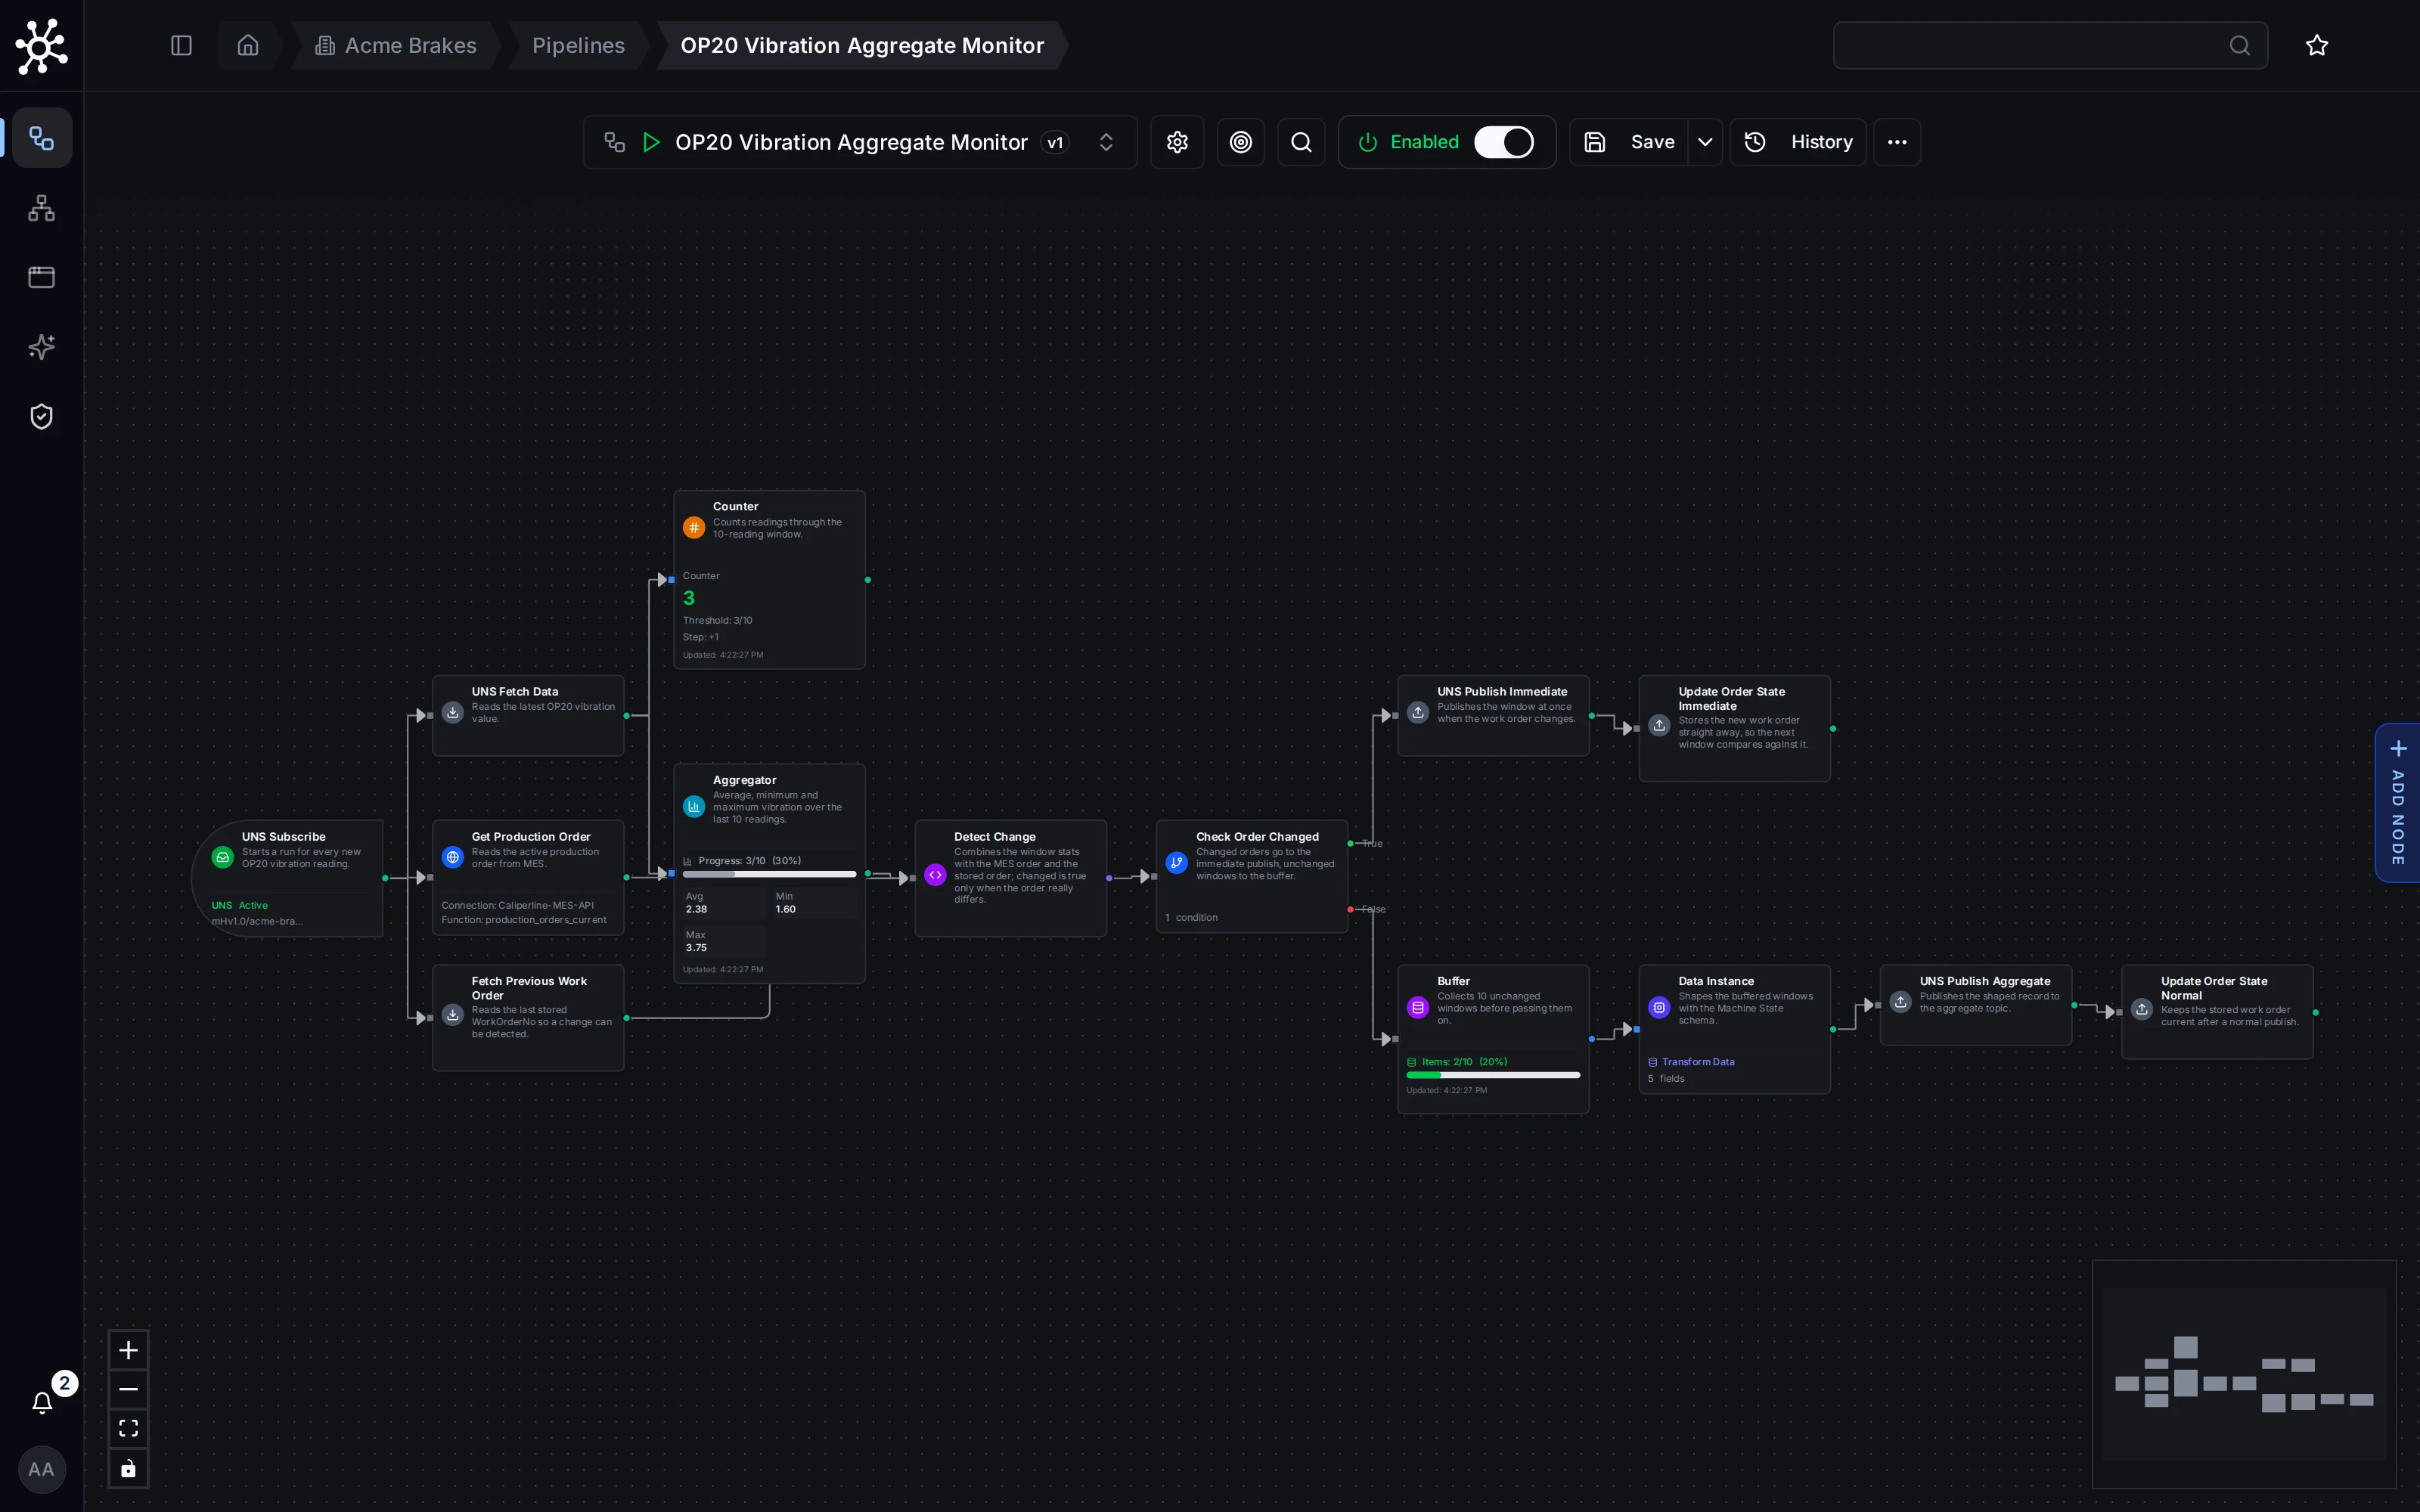
Complete OP20 Vibration Aggregate Monitor Canvas
The full canvas shows both branches together: an immediate publish when the work order changes, and a buffered publish of every 10 windows while it stays the same.
Execution History
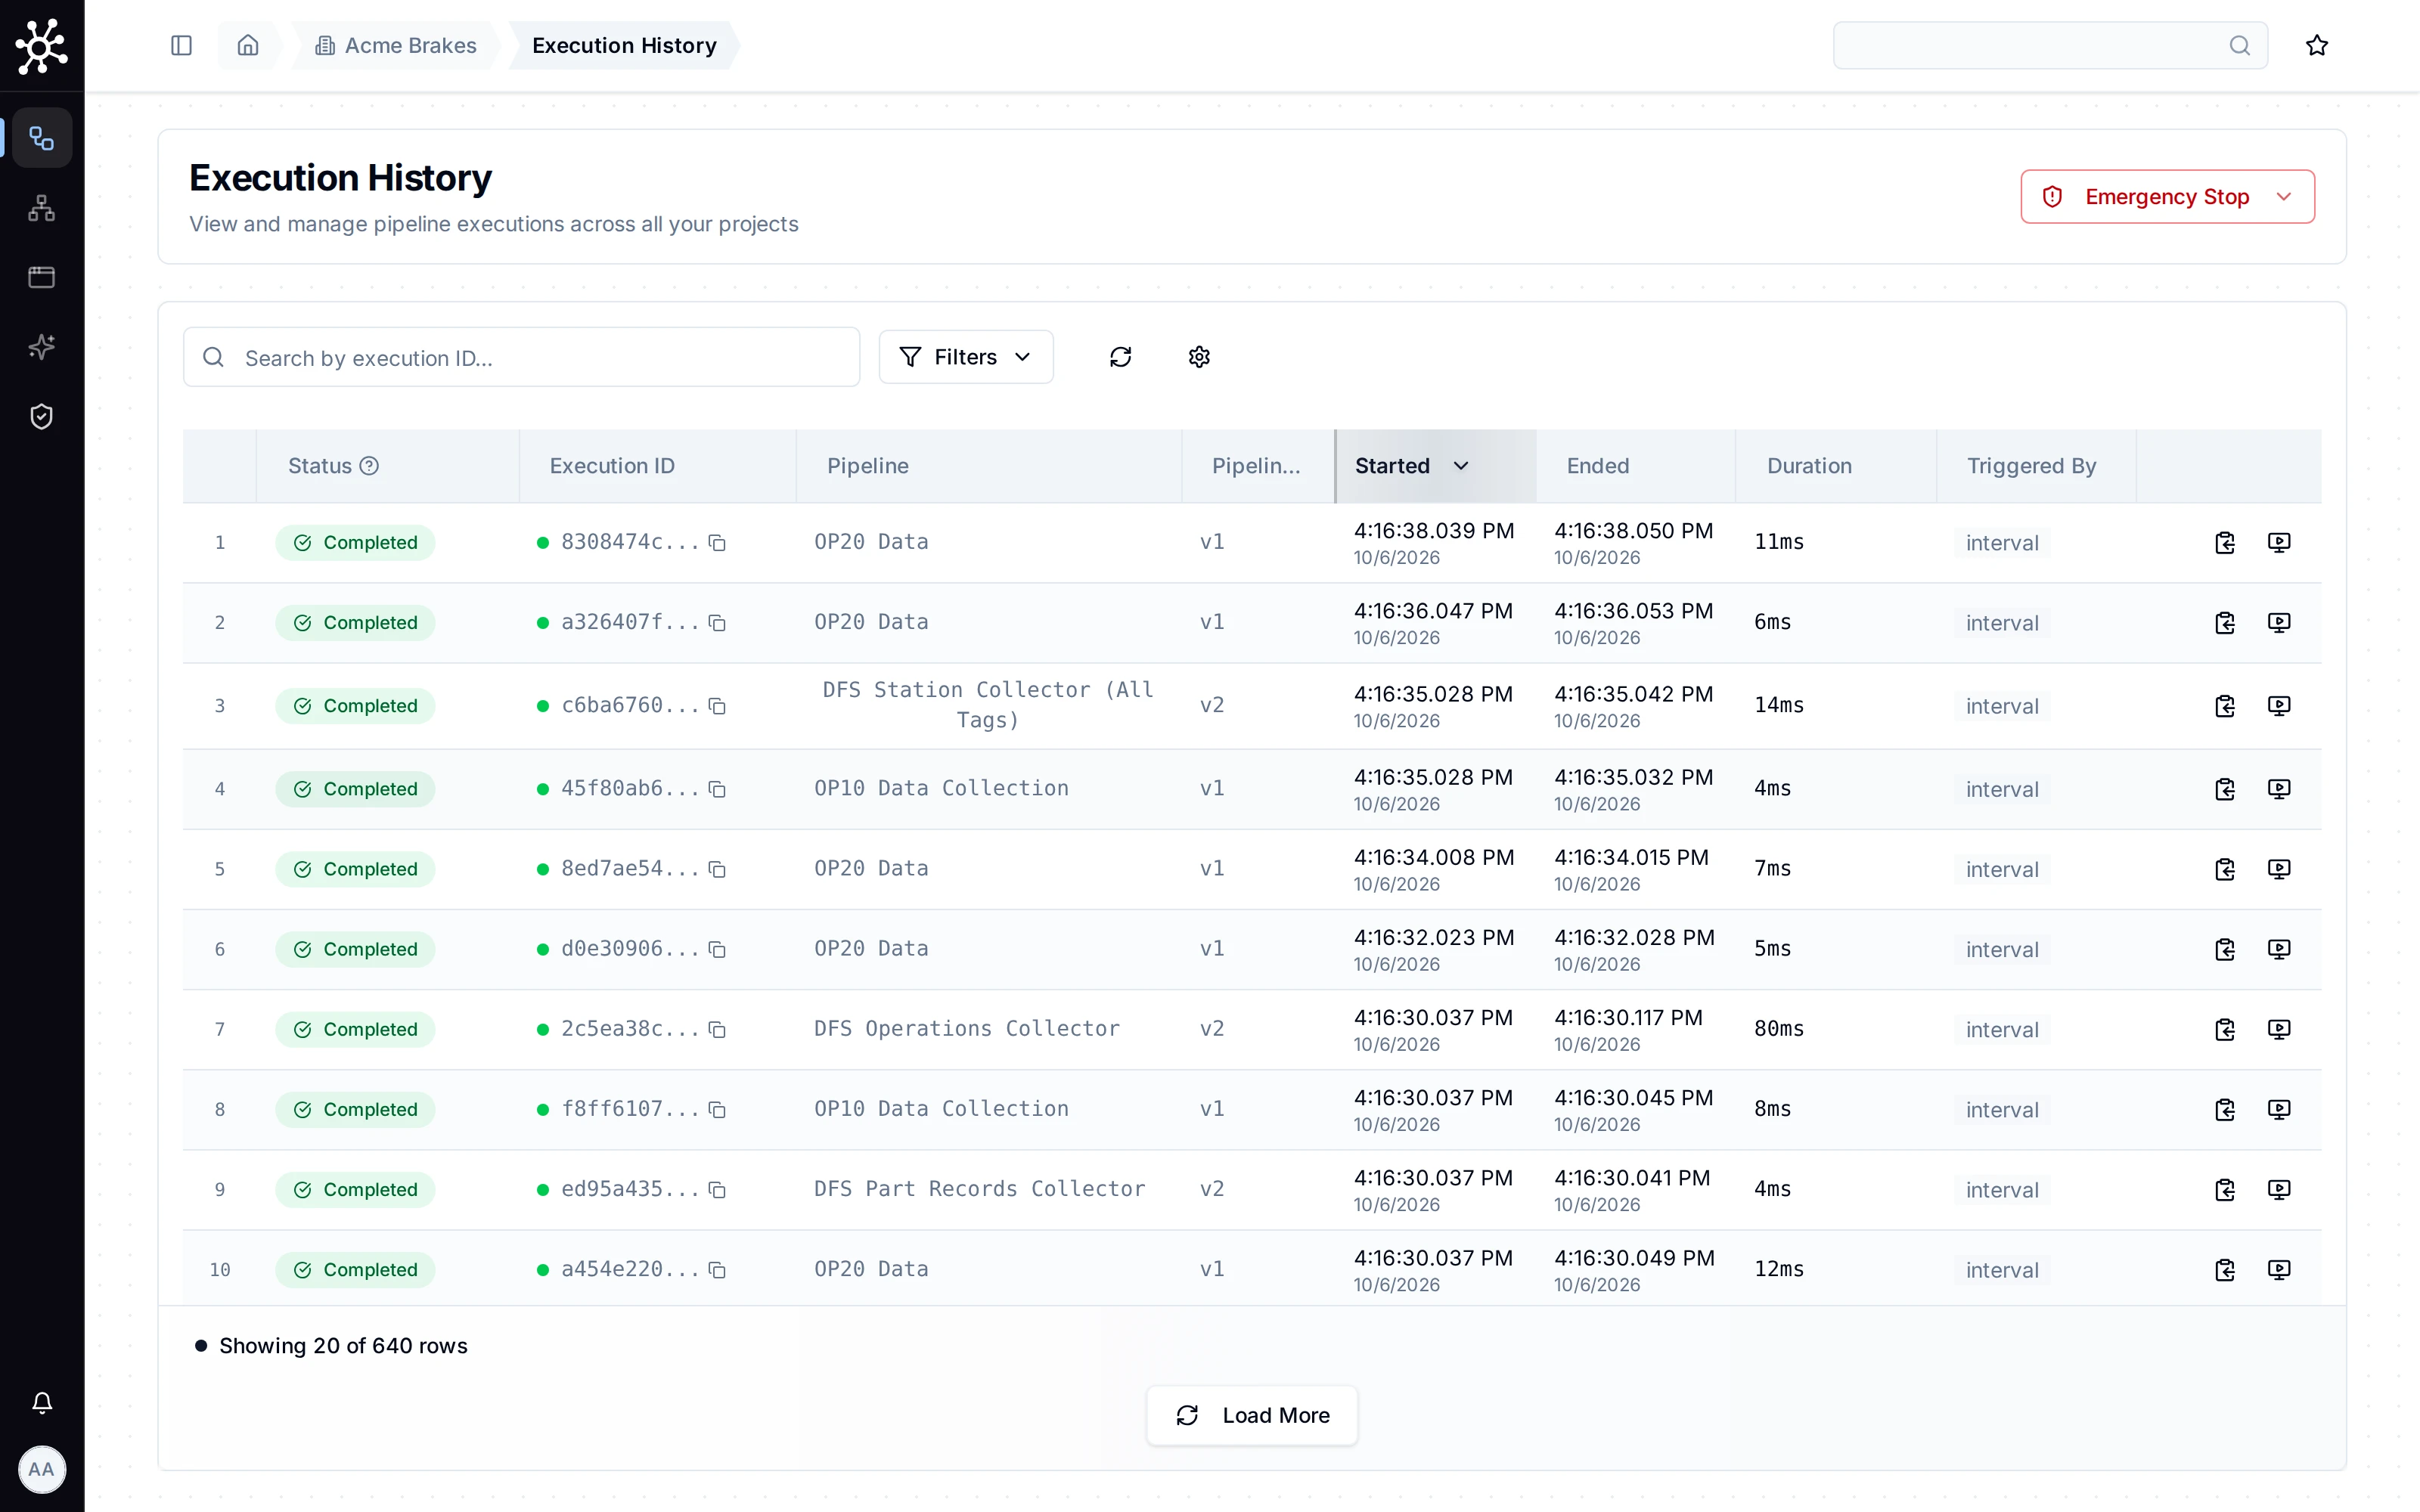
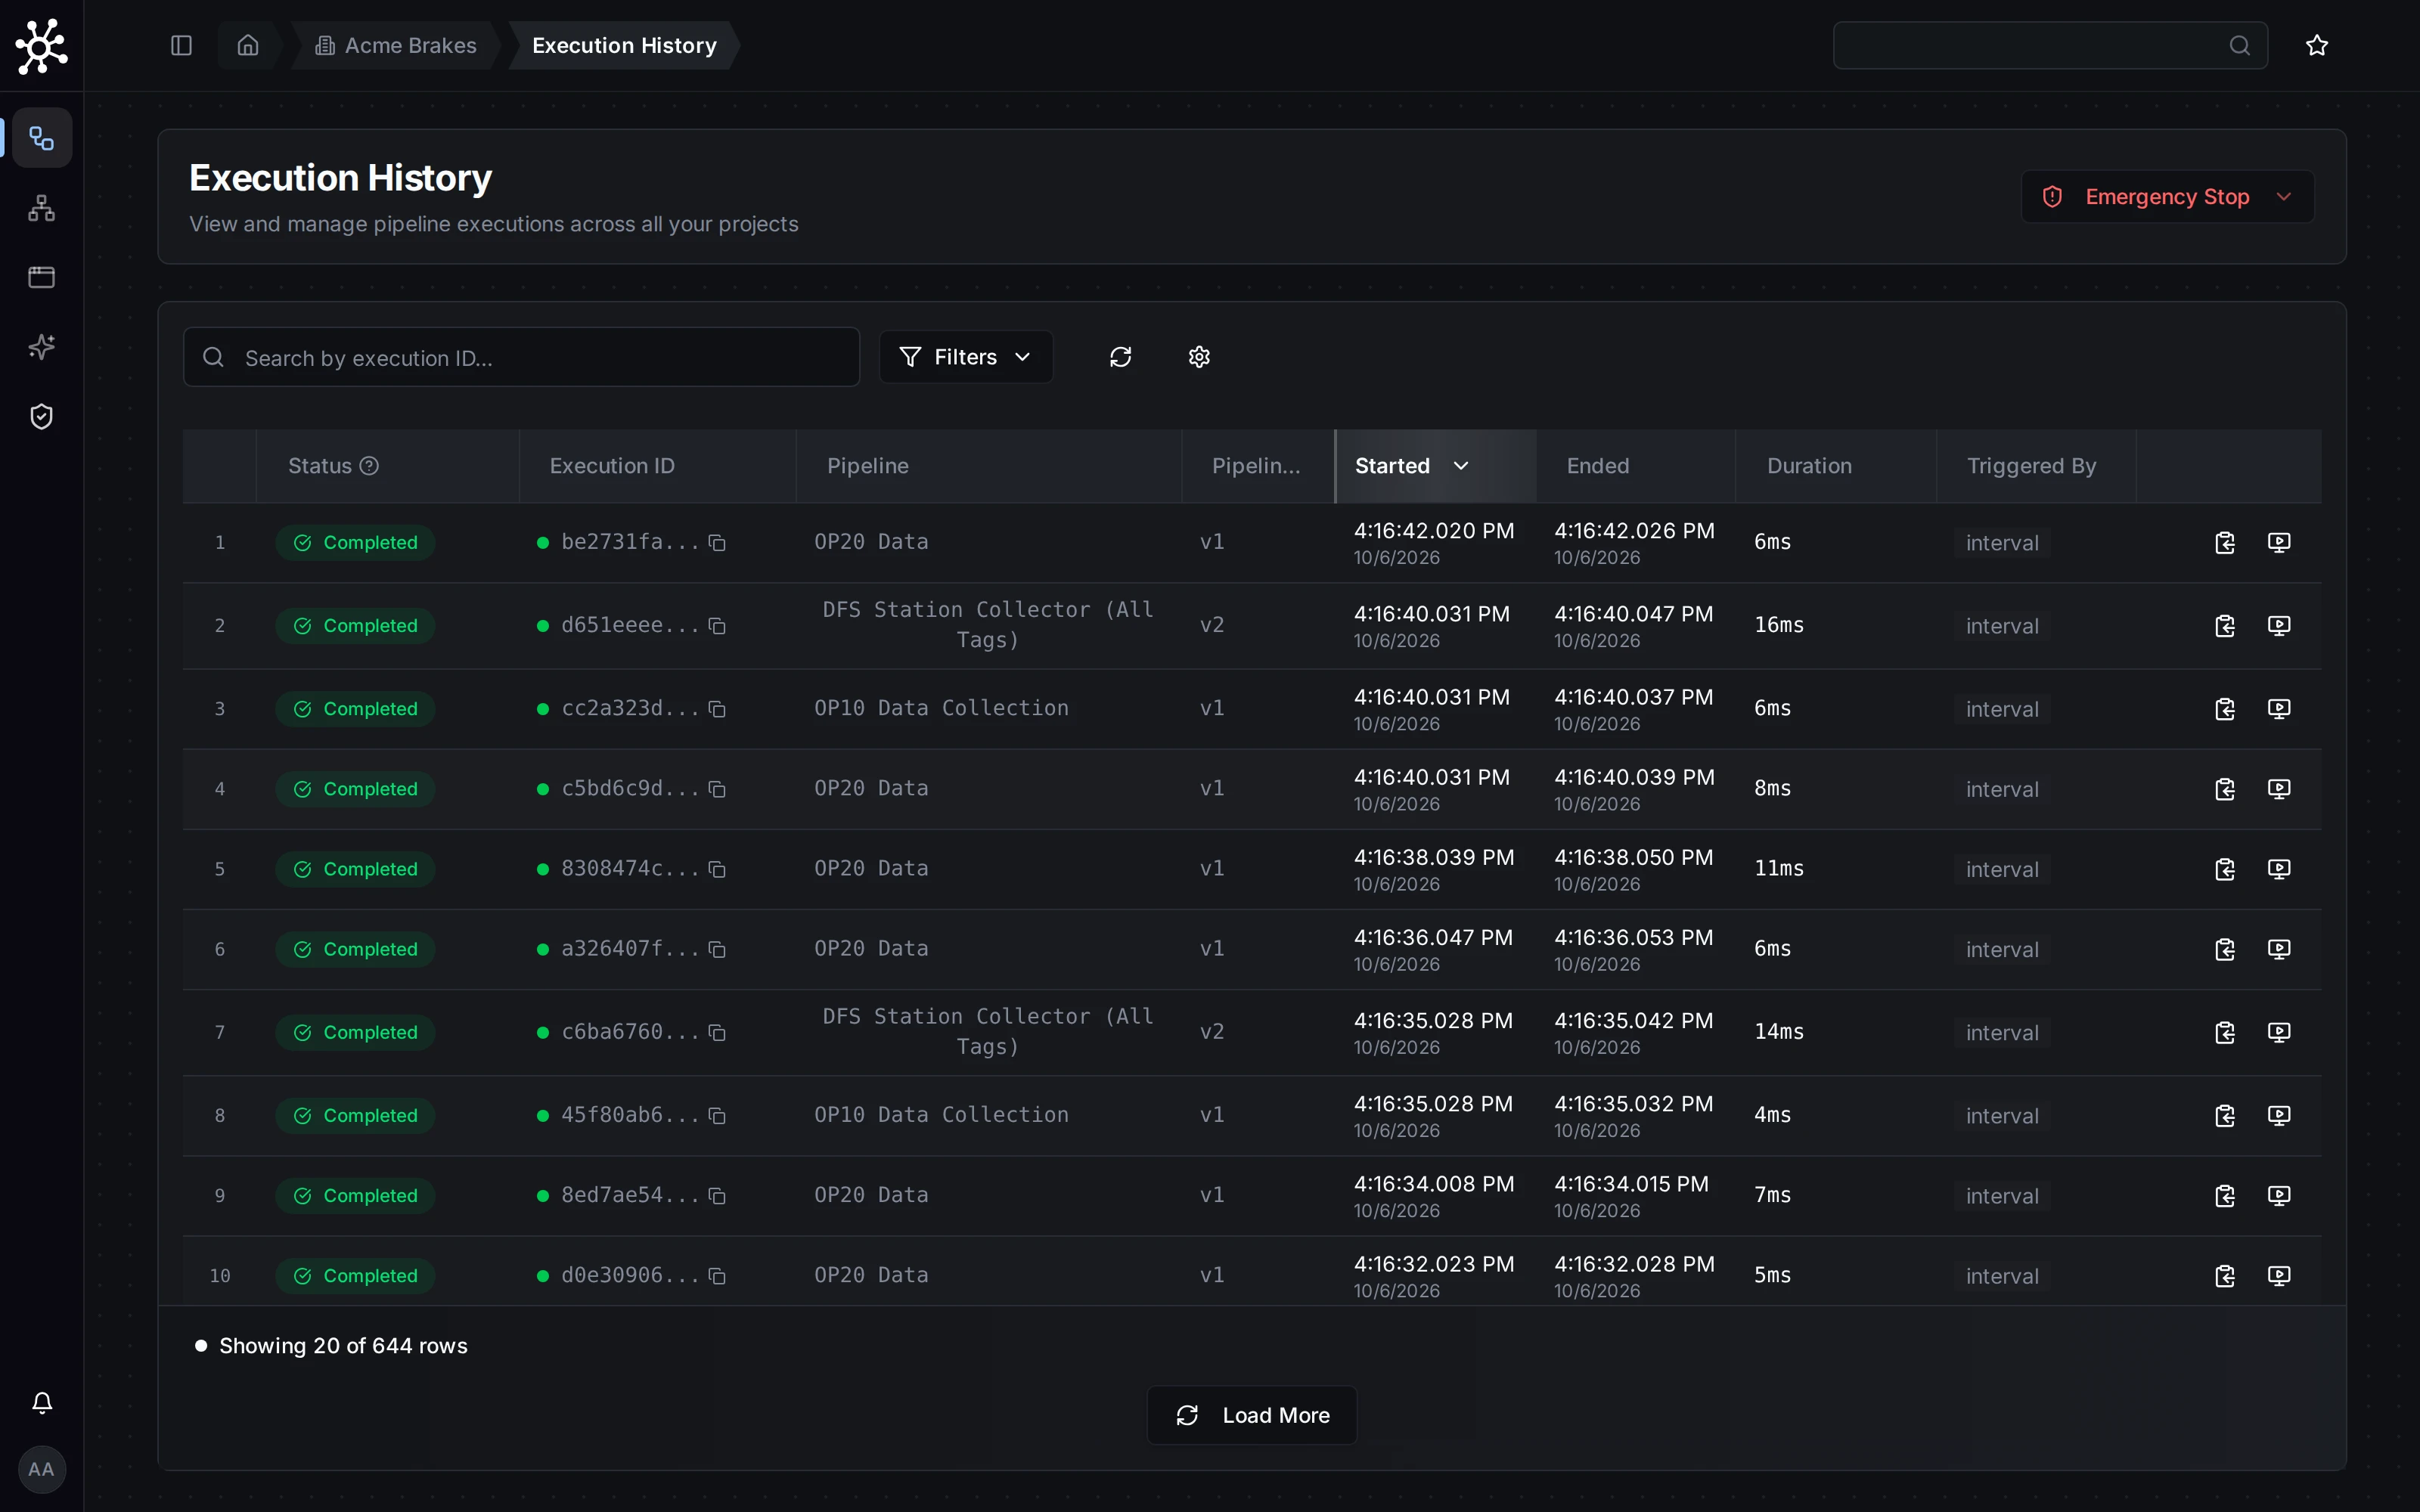
Every pipeline run, searchable and filterable (by time range, status, or pipeline), with per-node payloads and a one-click replay.
Browse Pipeline Execution History
Orchestrate › Execution History lists the pipeline runs of the workspace, newest first. Each row shows how a run ended, which pipeline and version ran, when, for how long, and what started it.
Data Explorer
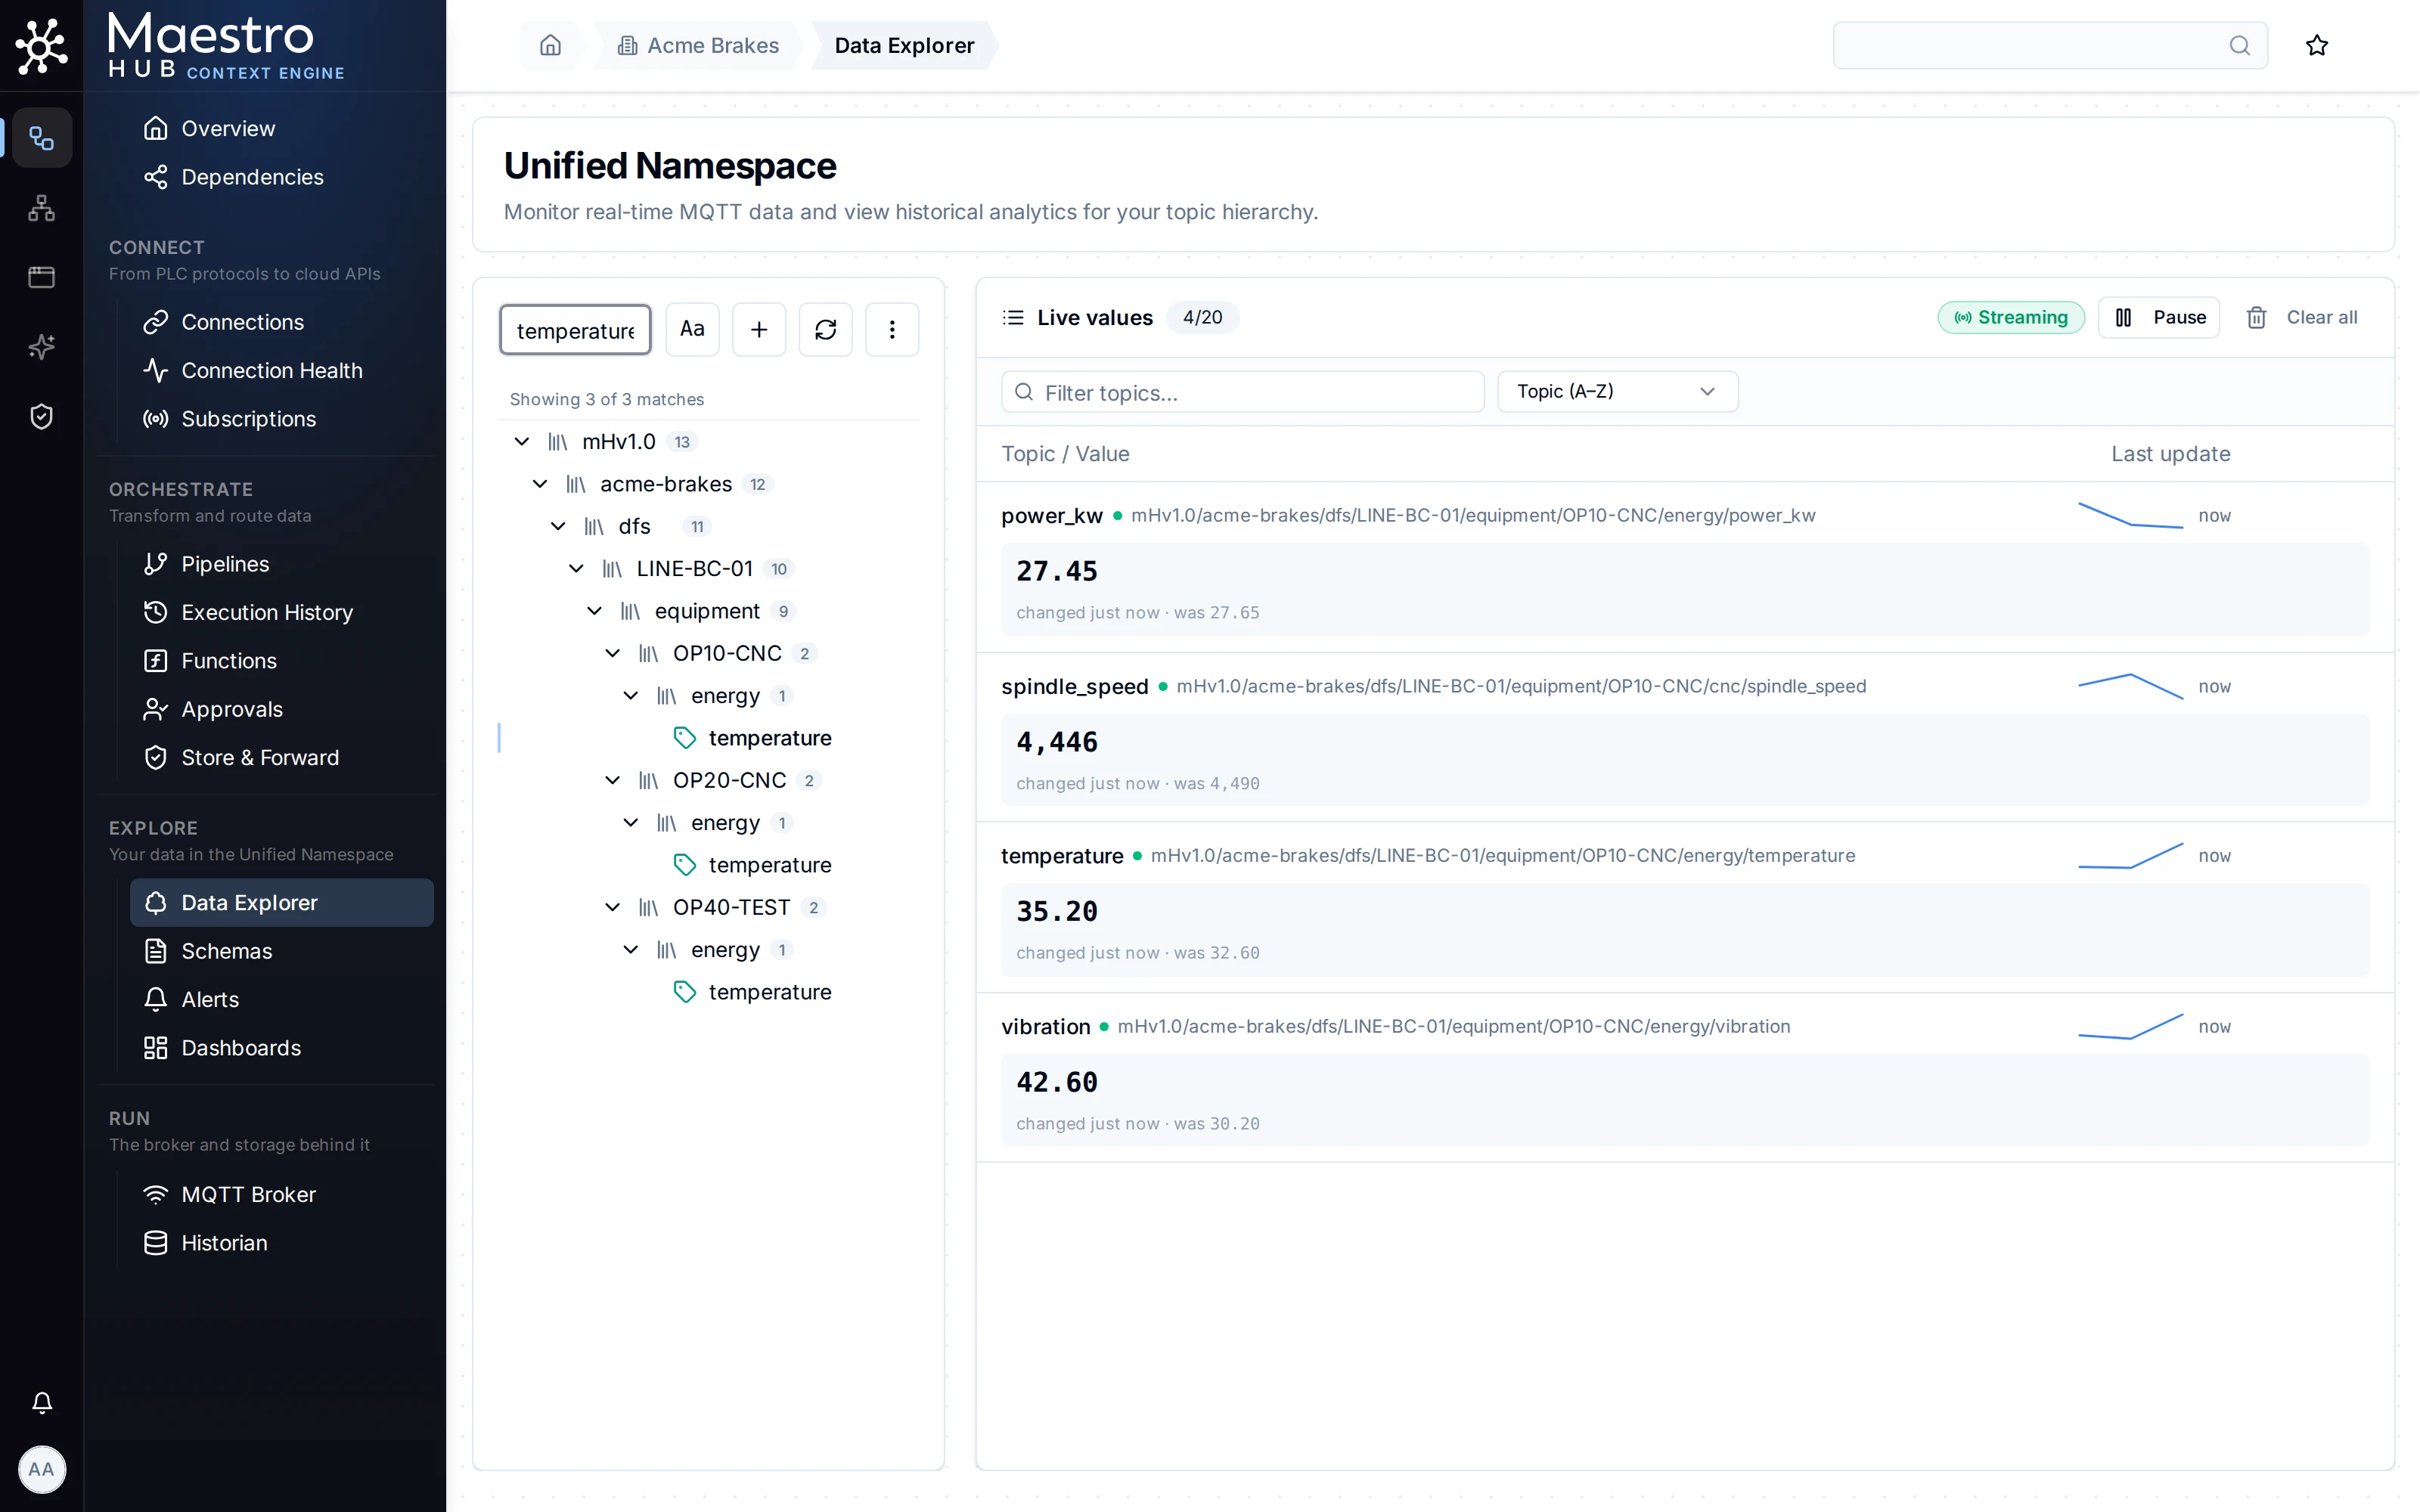
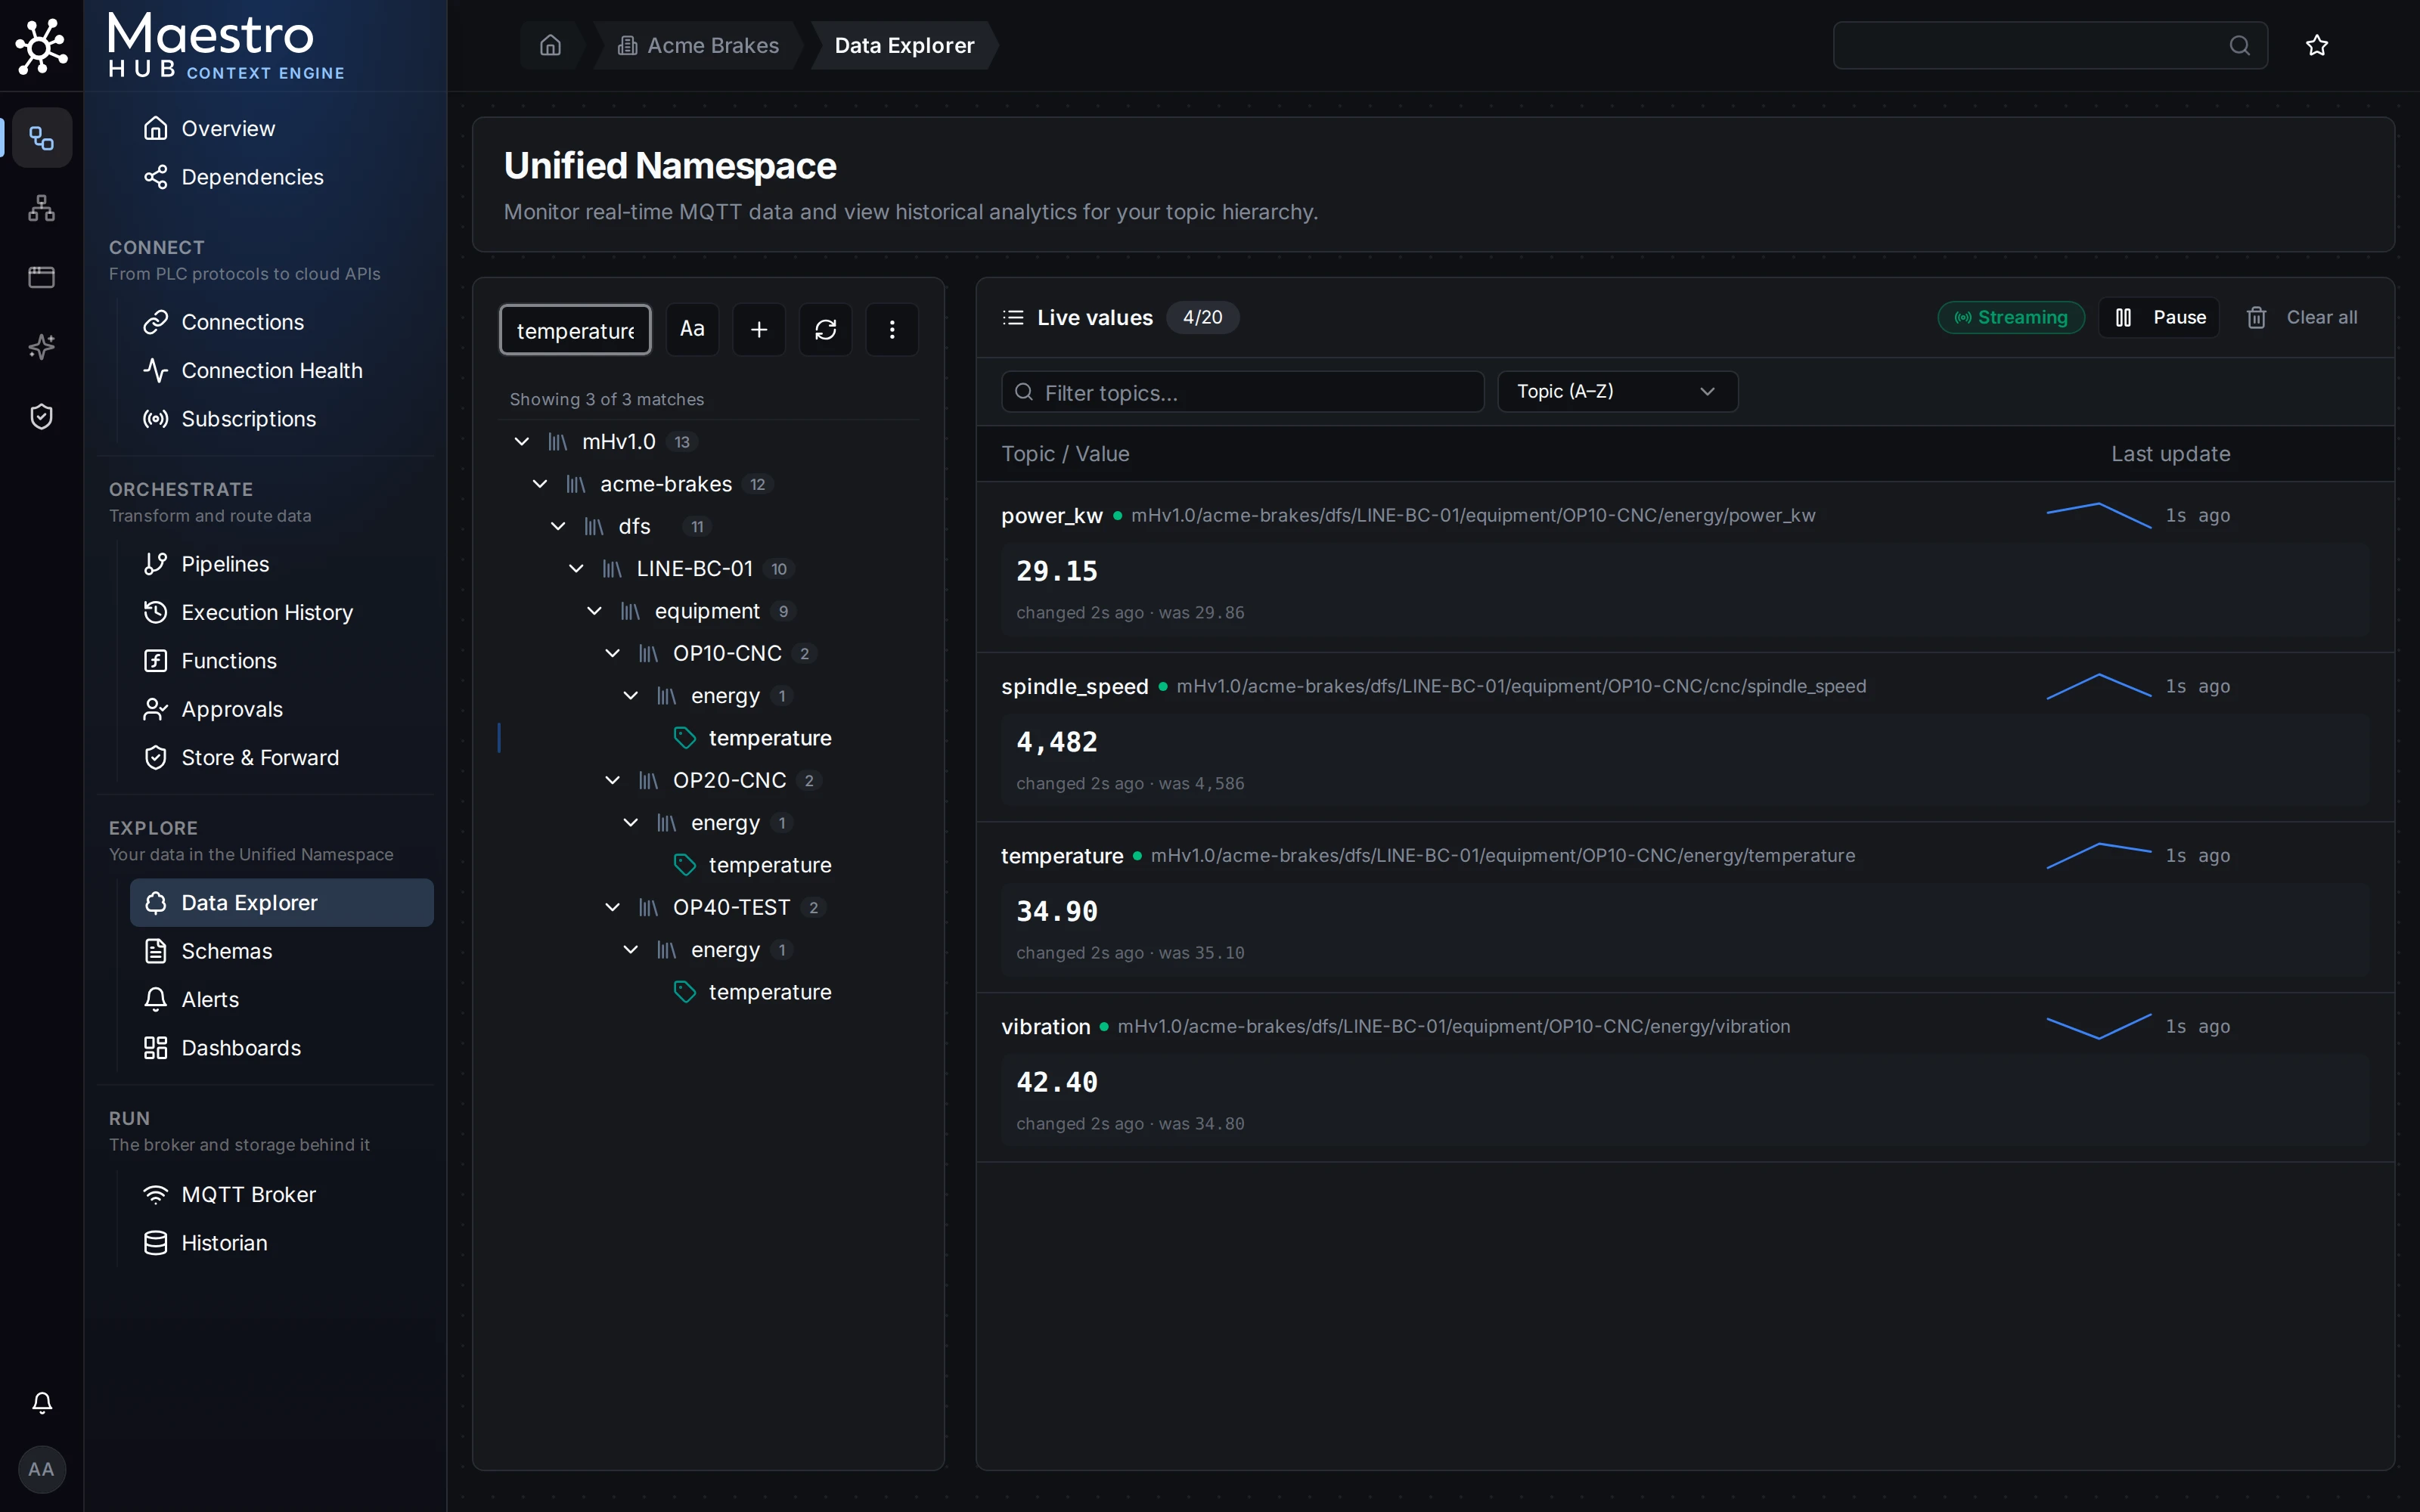
Browse the UNS topic tree, watch live values stream in, and pull historical trends for any node, with retention controls per topic.
Select a Topic from the UNS Tree
Find a topic in the tree on the left and add it to the Live values list on the right, where its current value streams in.
Backup & Migration
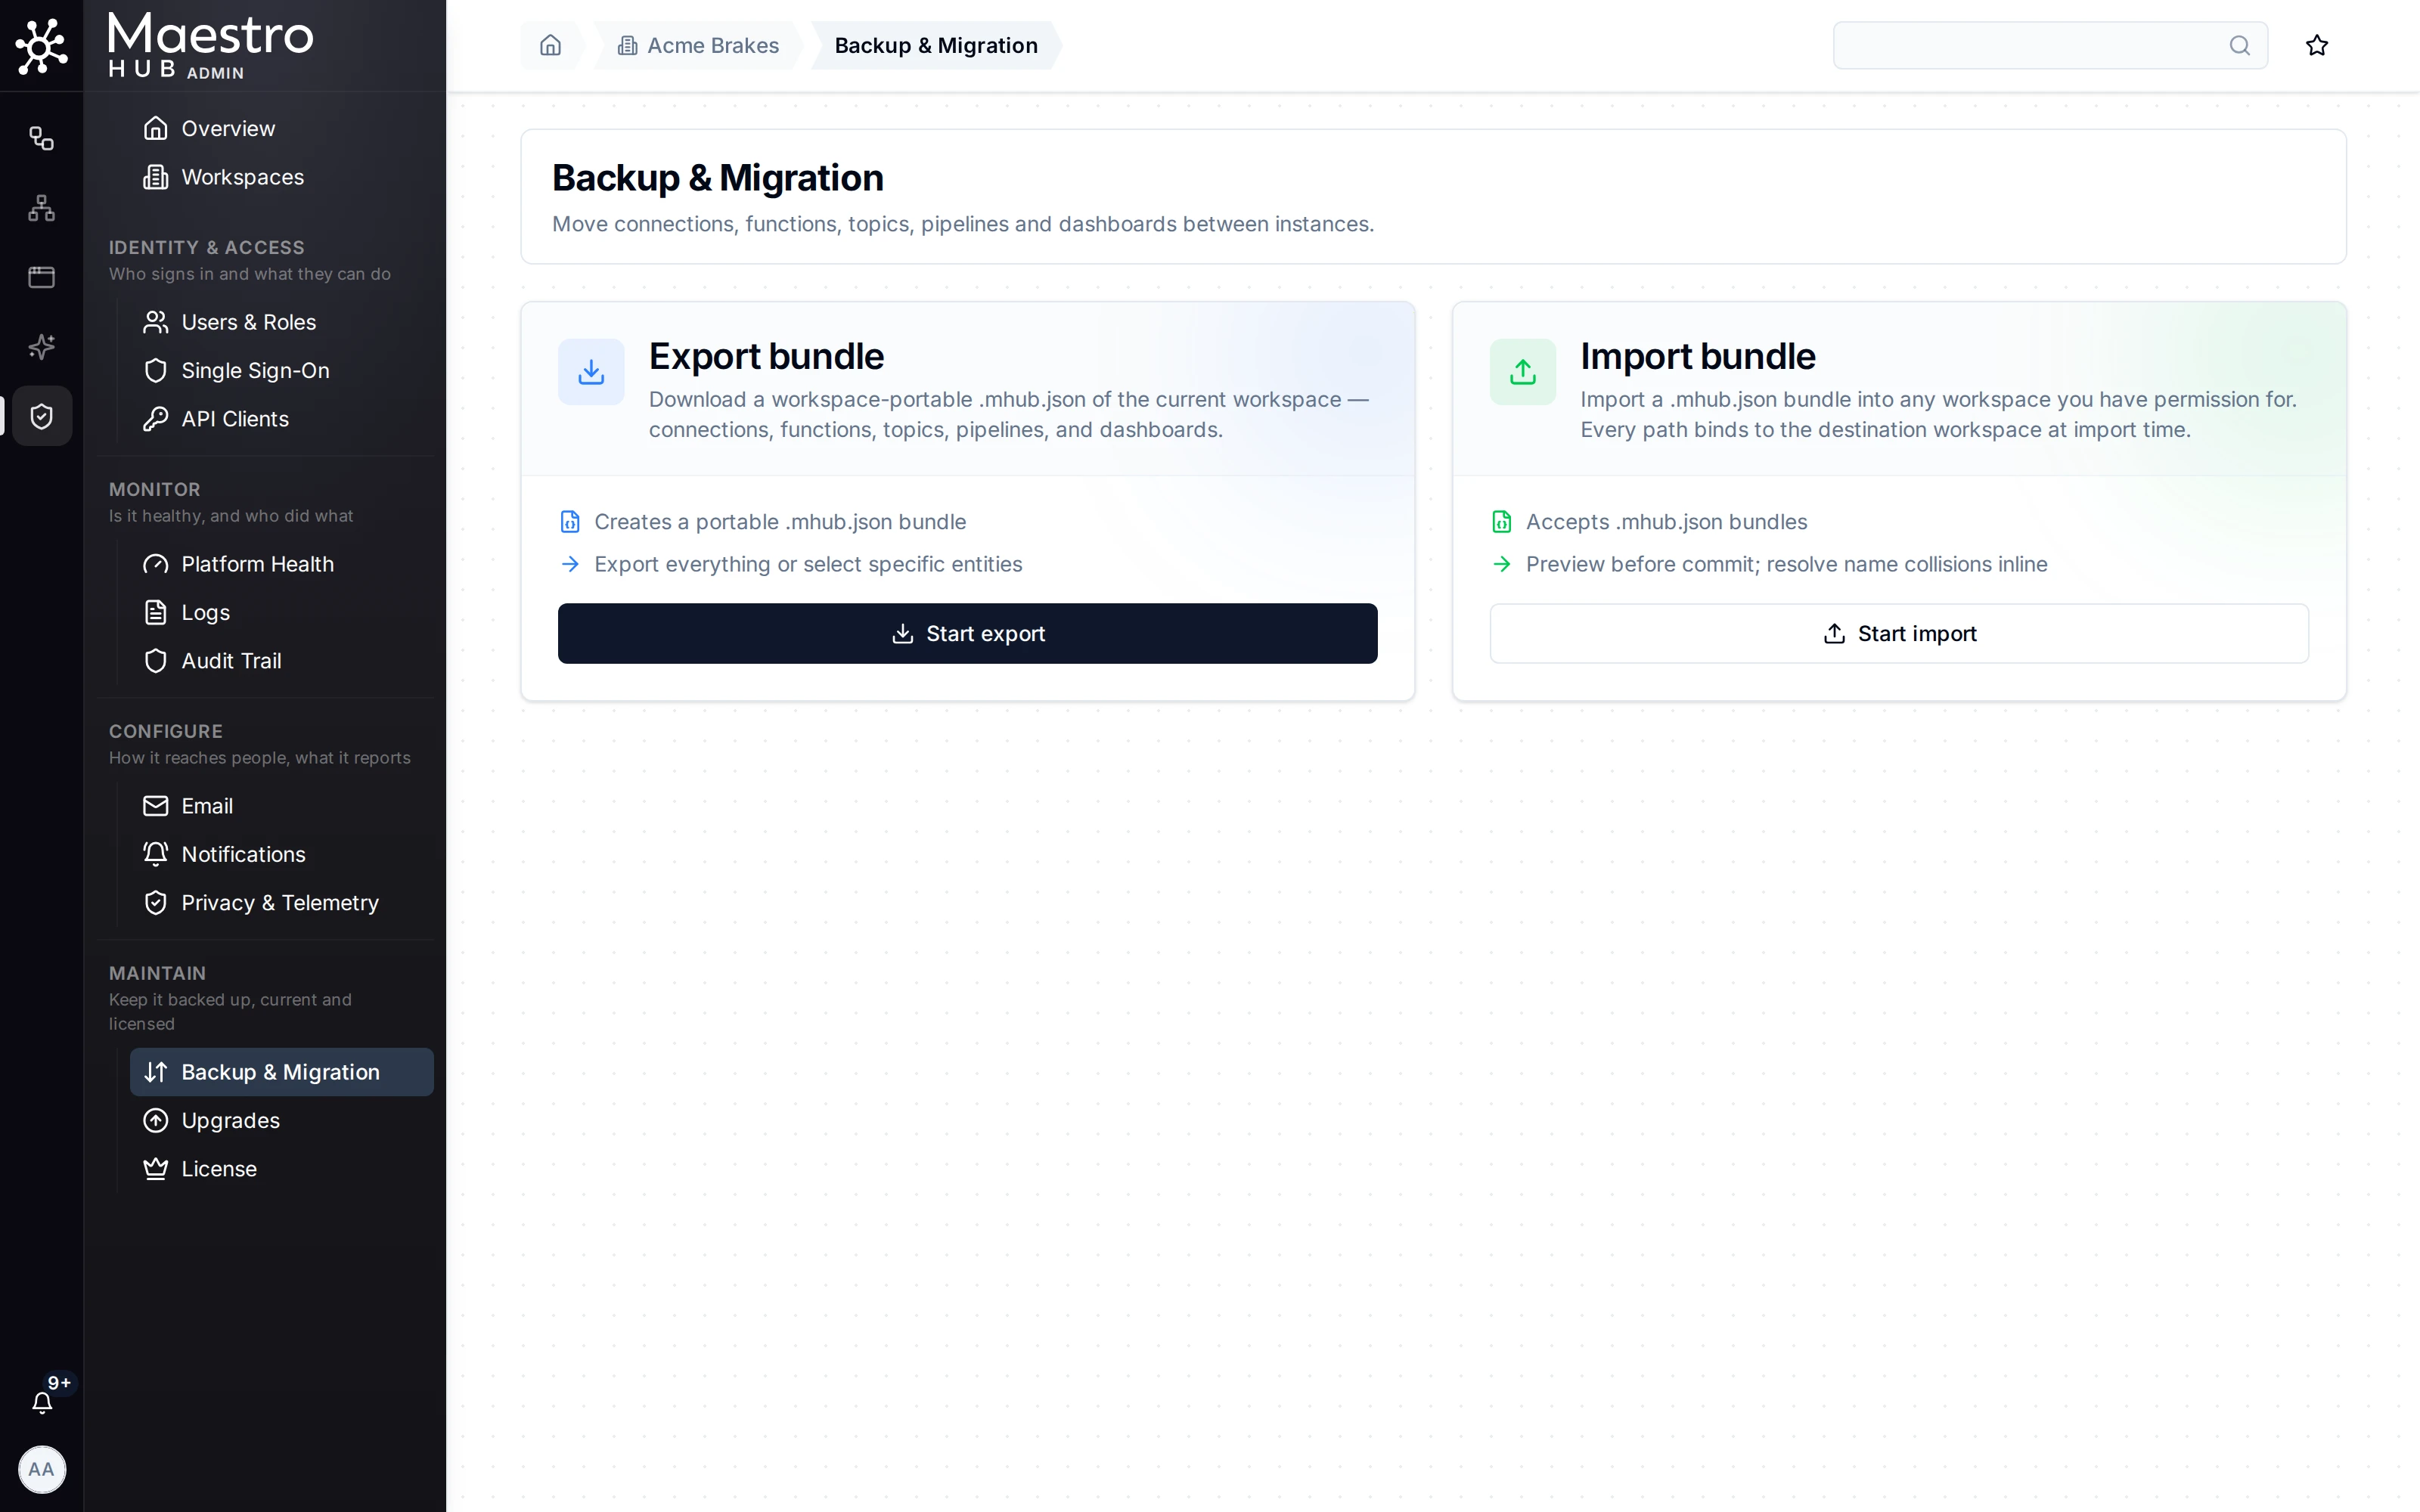
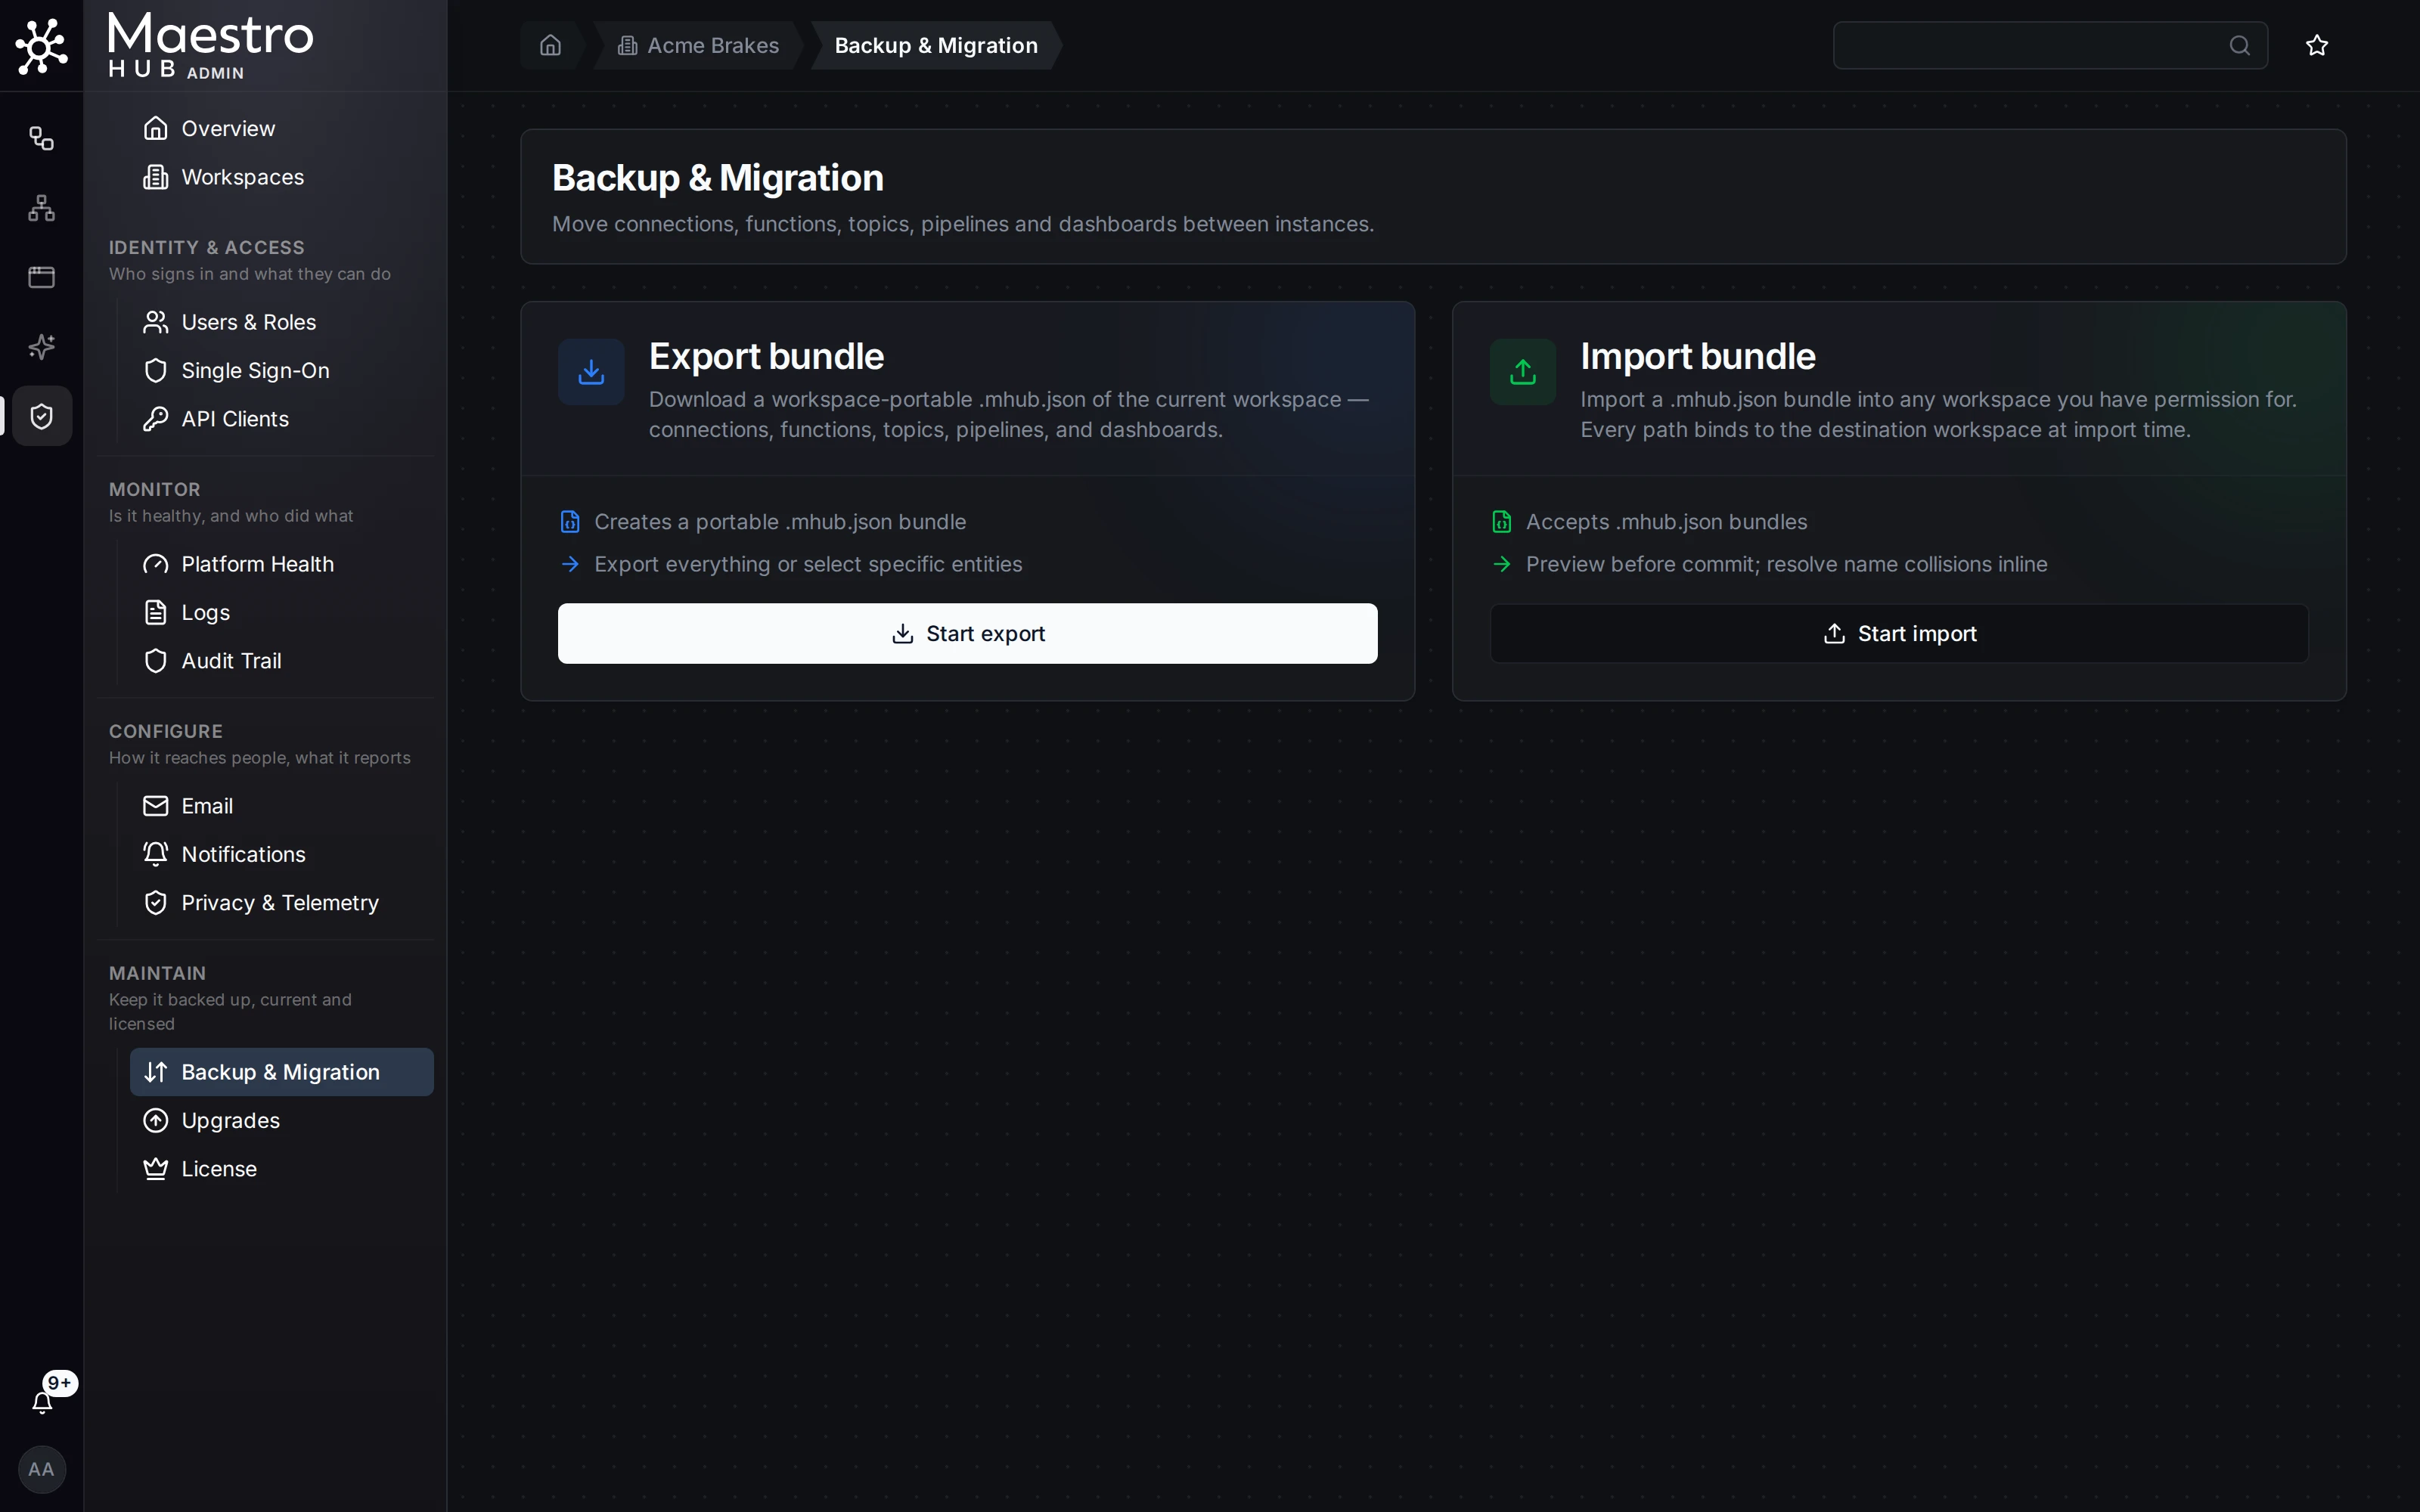
Move configuration between workspaces or environments as a single bundle: connections, functions, topics, pipelines and dashboards. Useful for backups and dev → prod promotion.
Start an Export
On Admin › Maintain › Backup & Migration, the Export bundle card packages the workspace's connections, functions, topics, pipelines and dashboards into a single .mhub.json file.
Email
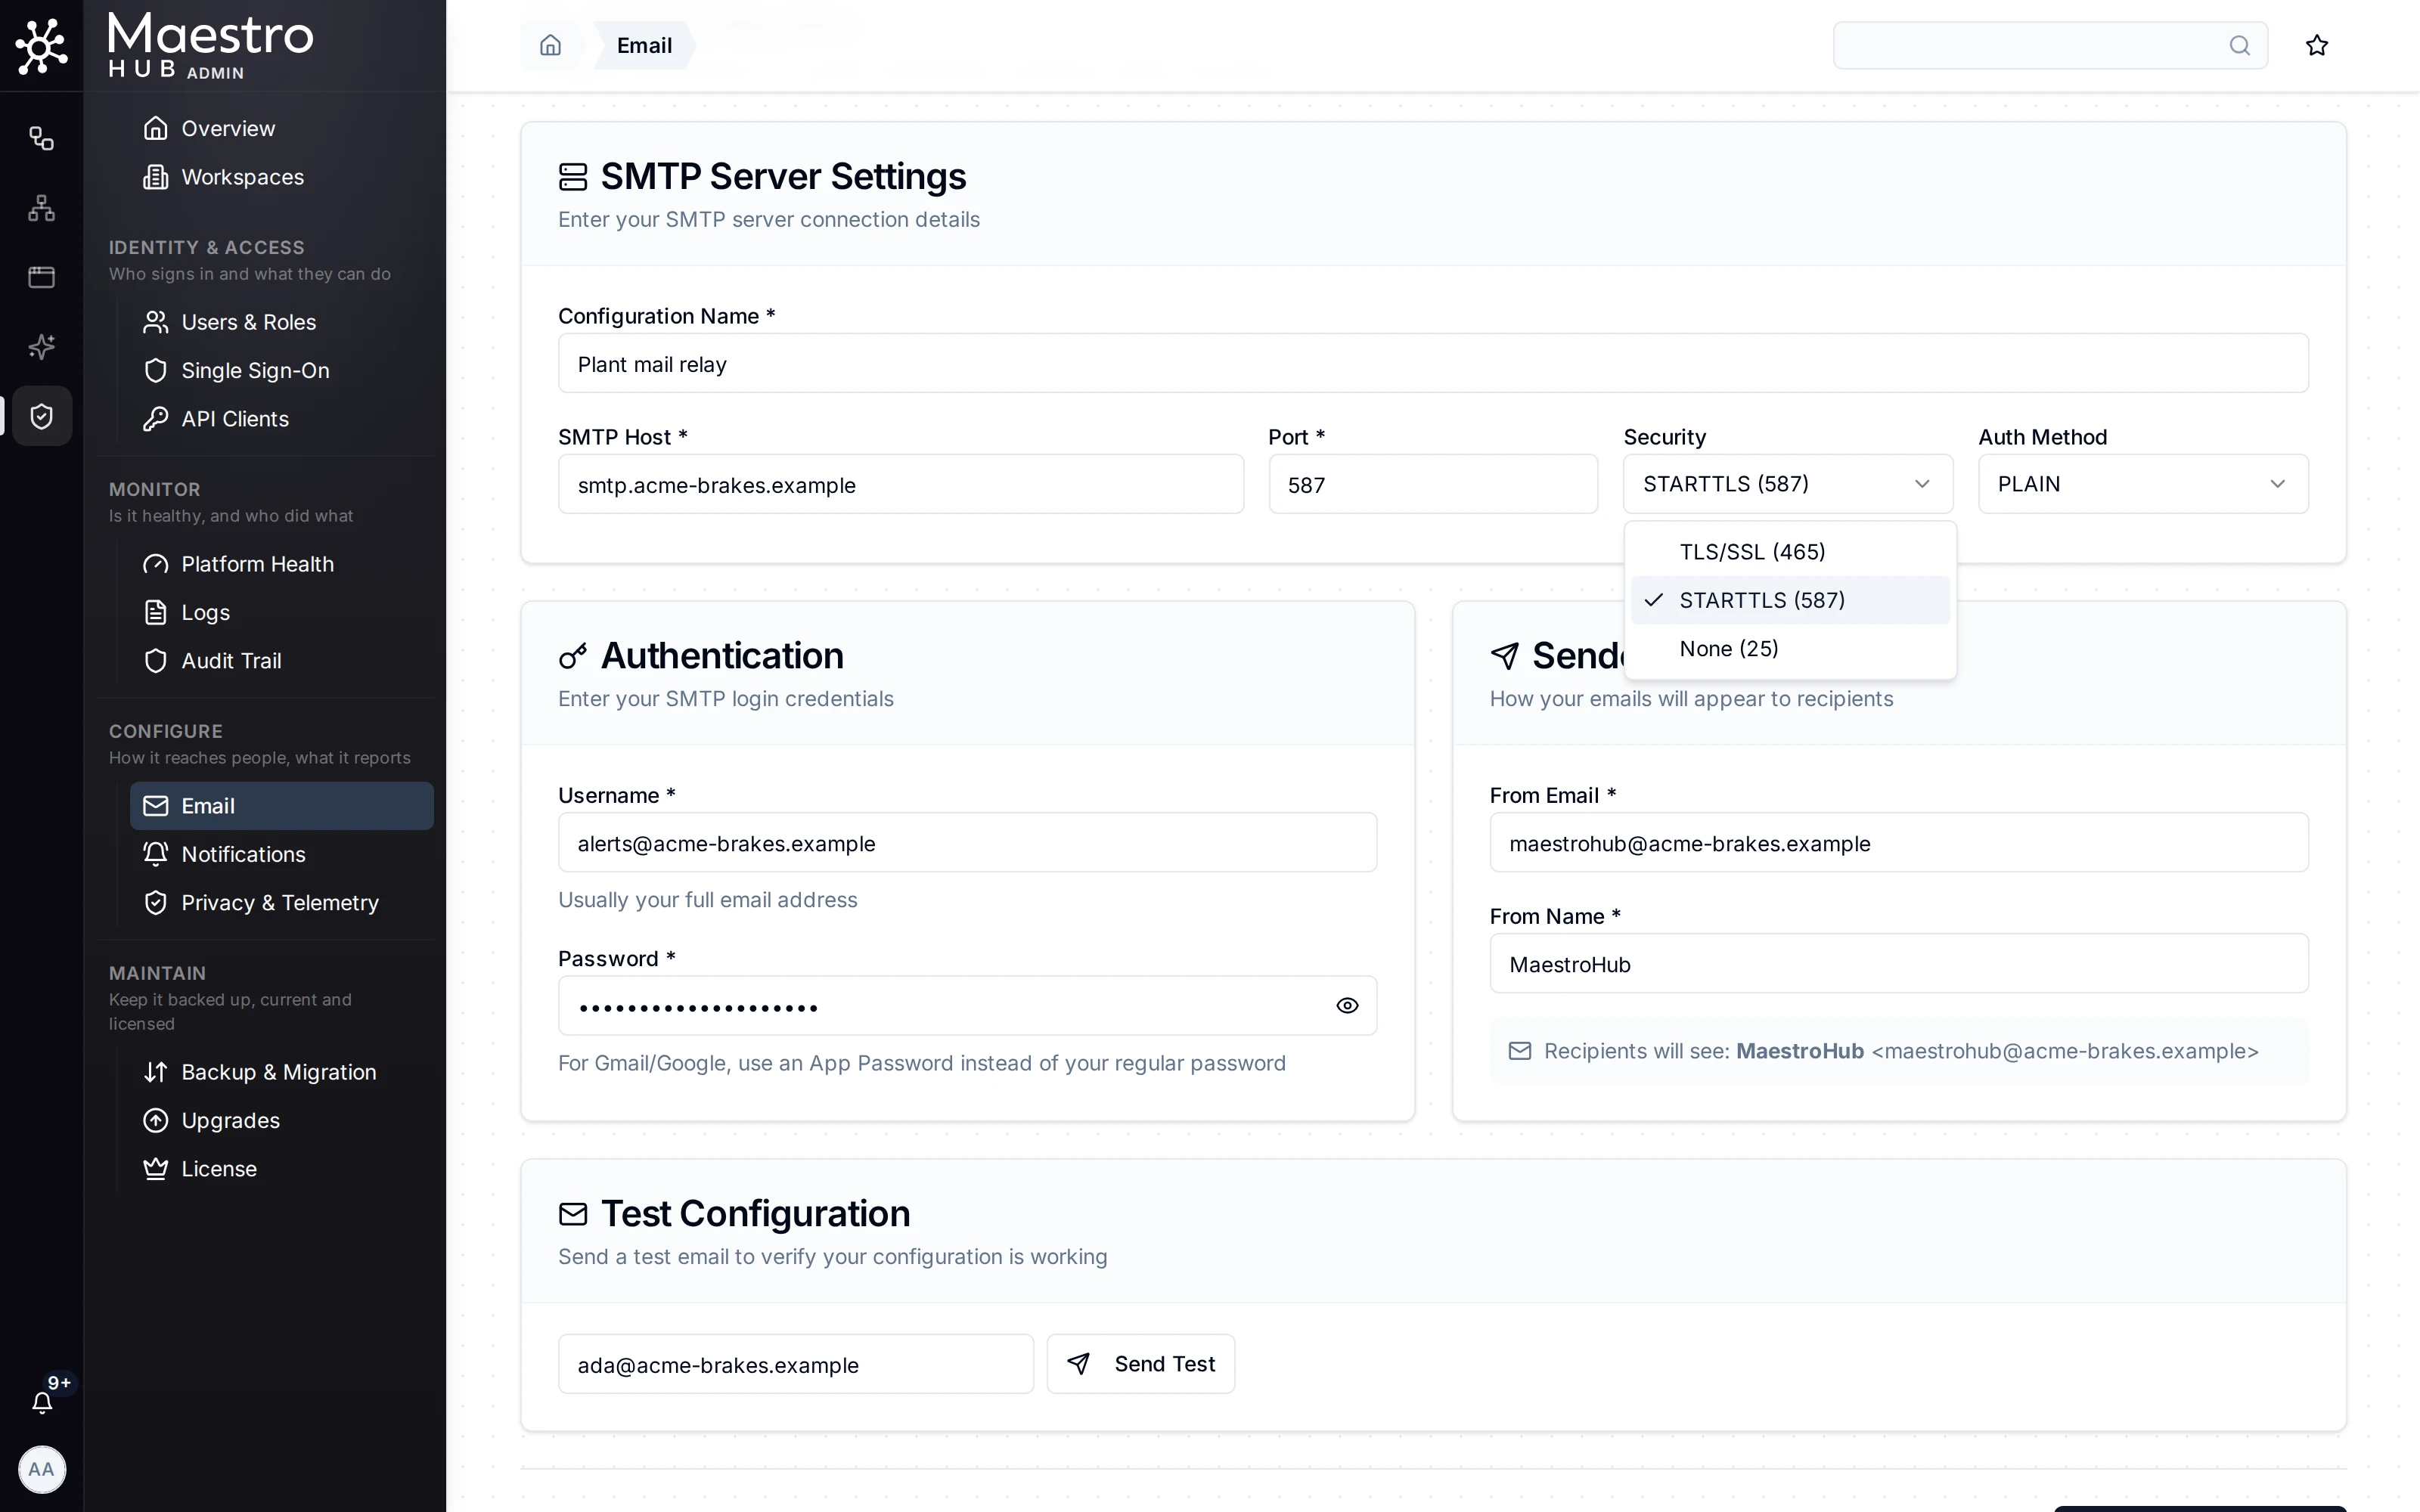
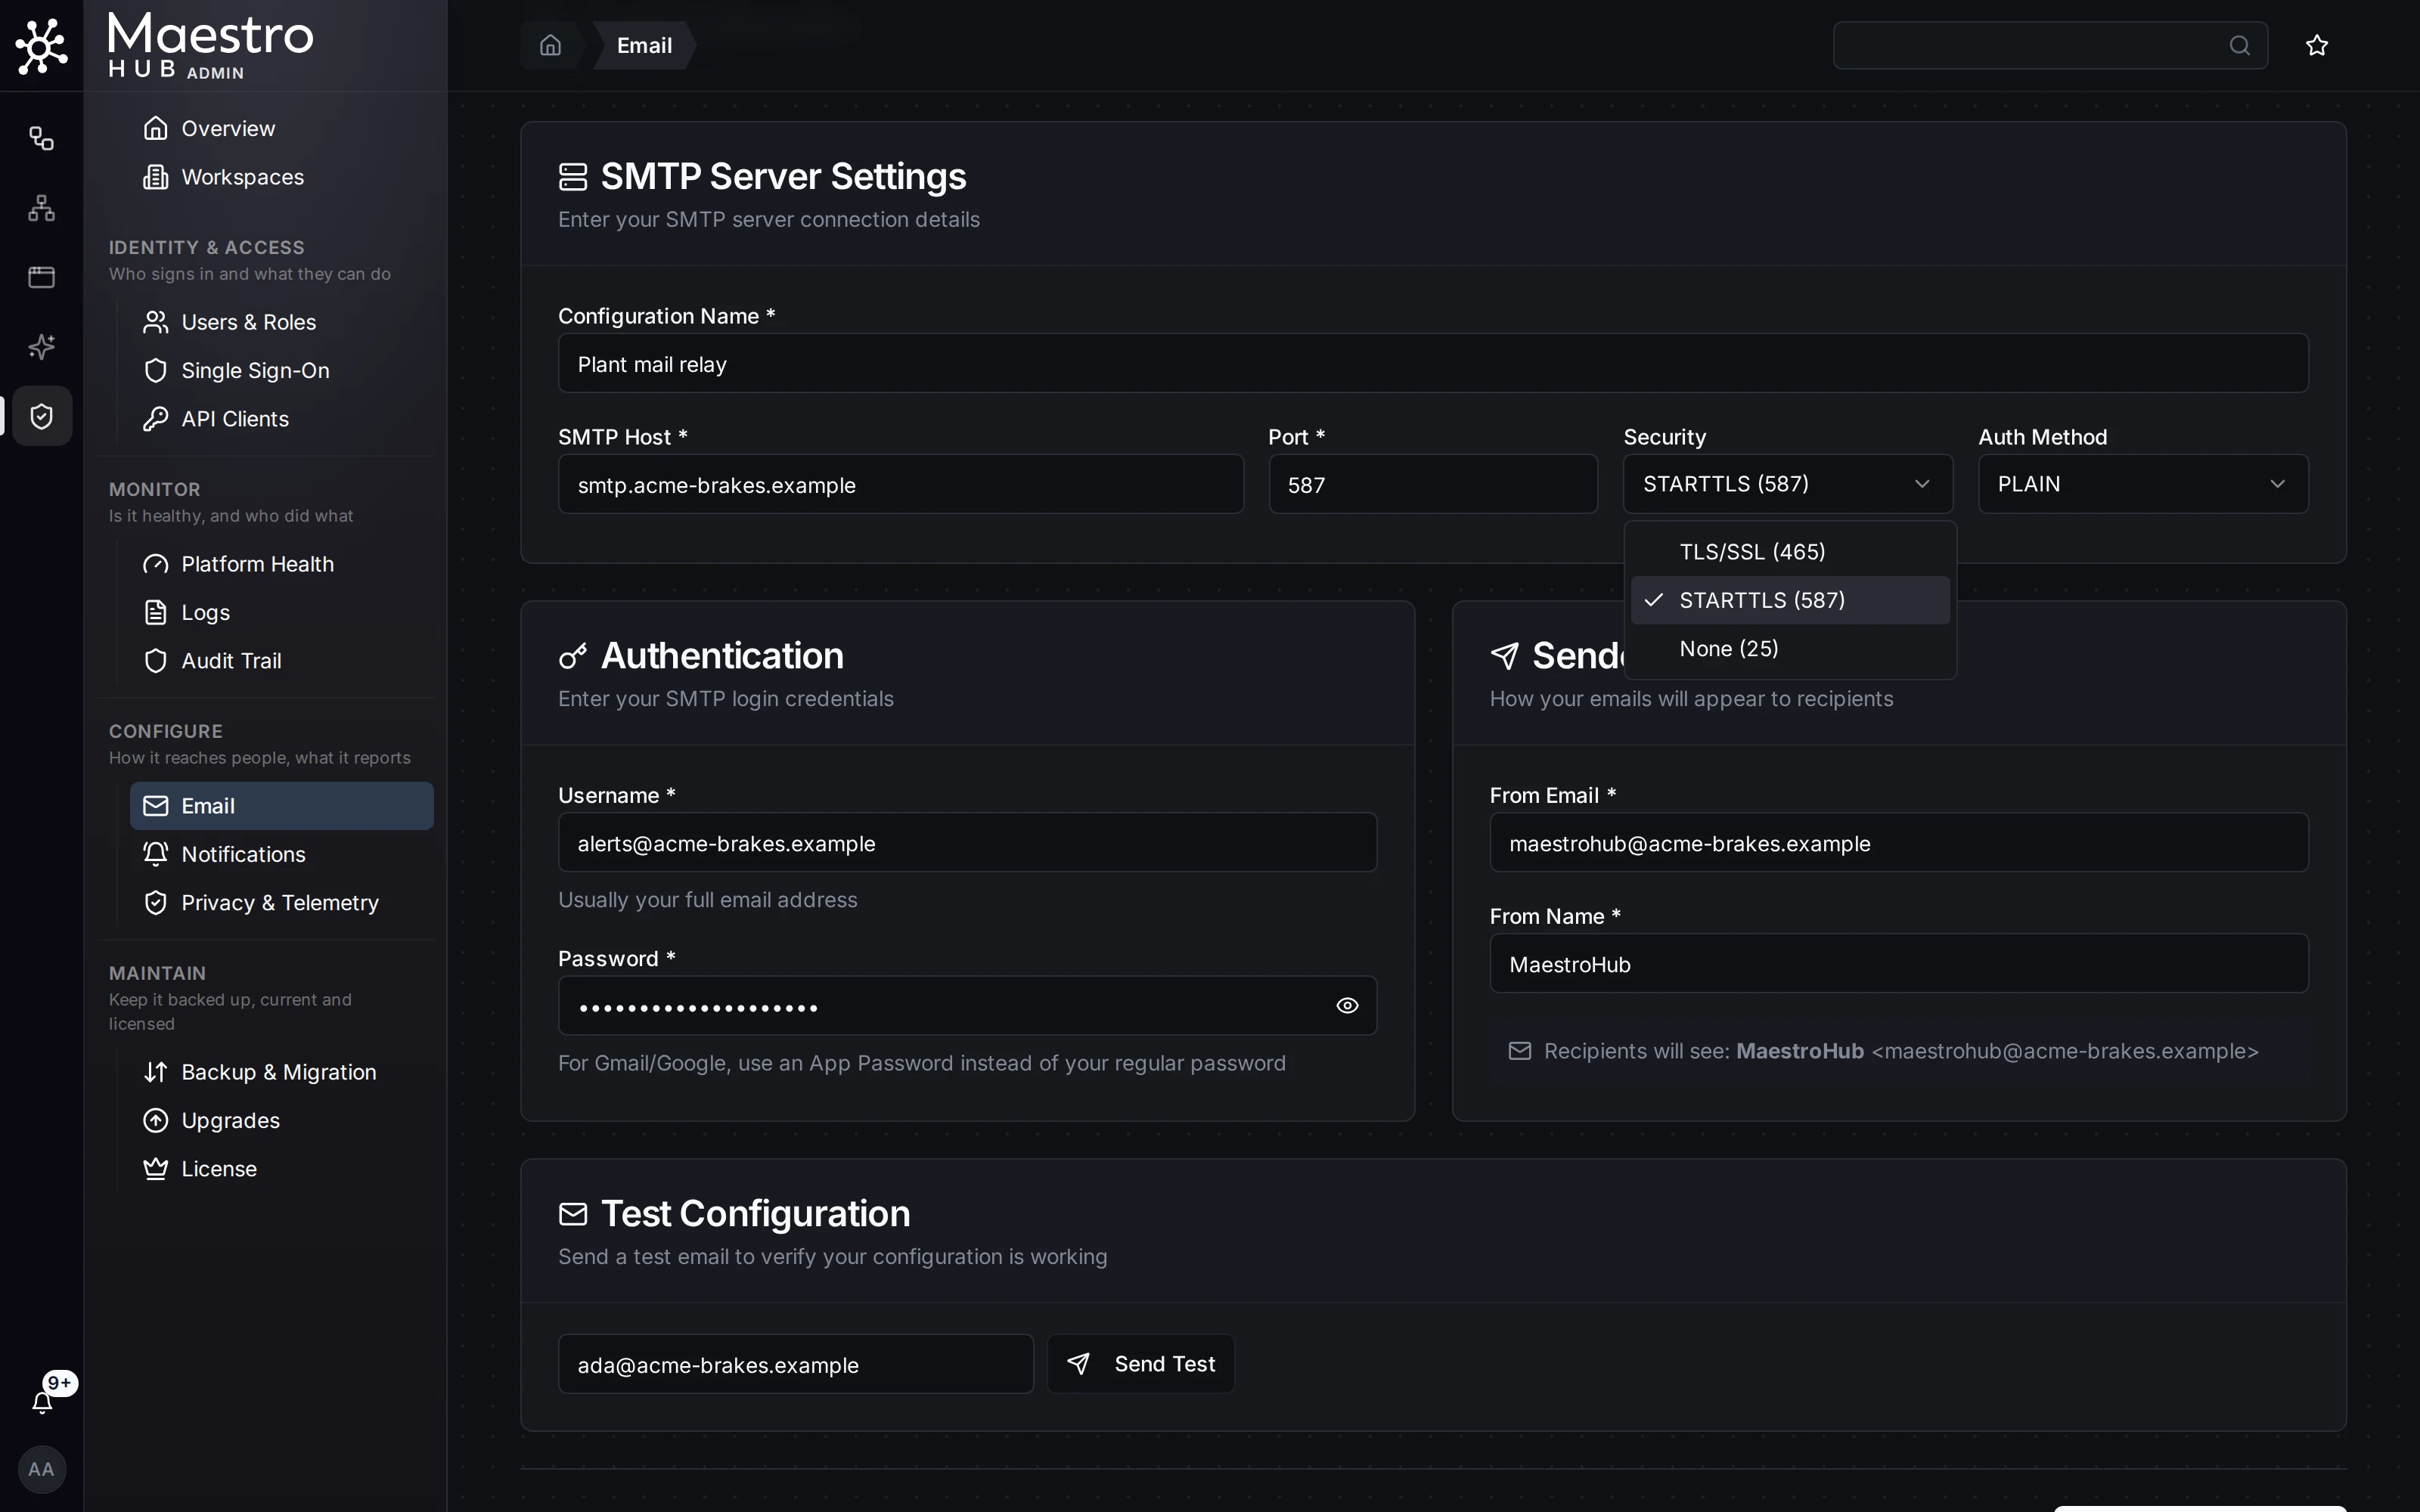
Set the SMTP server MaestroHub uses for its own messages, such as password resets and trial requests. Pipelines send email through an SMTP connection instead.
Configure SMTP Server Settings
Admin › Configure › Email sets up the SMTP server MaestroHub sends mail through, for password resets and trial extension requests. Email is optional: everything else works without it.
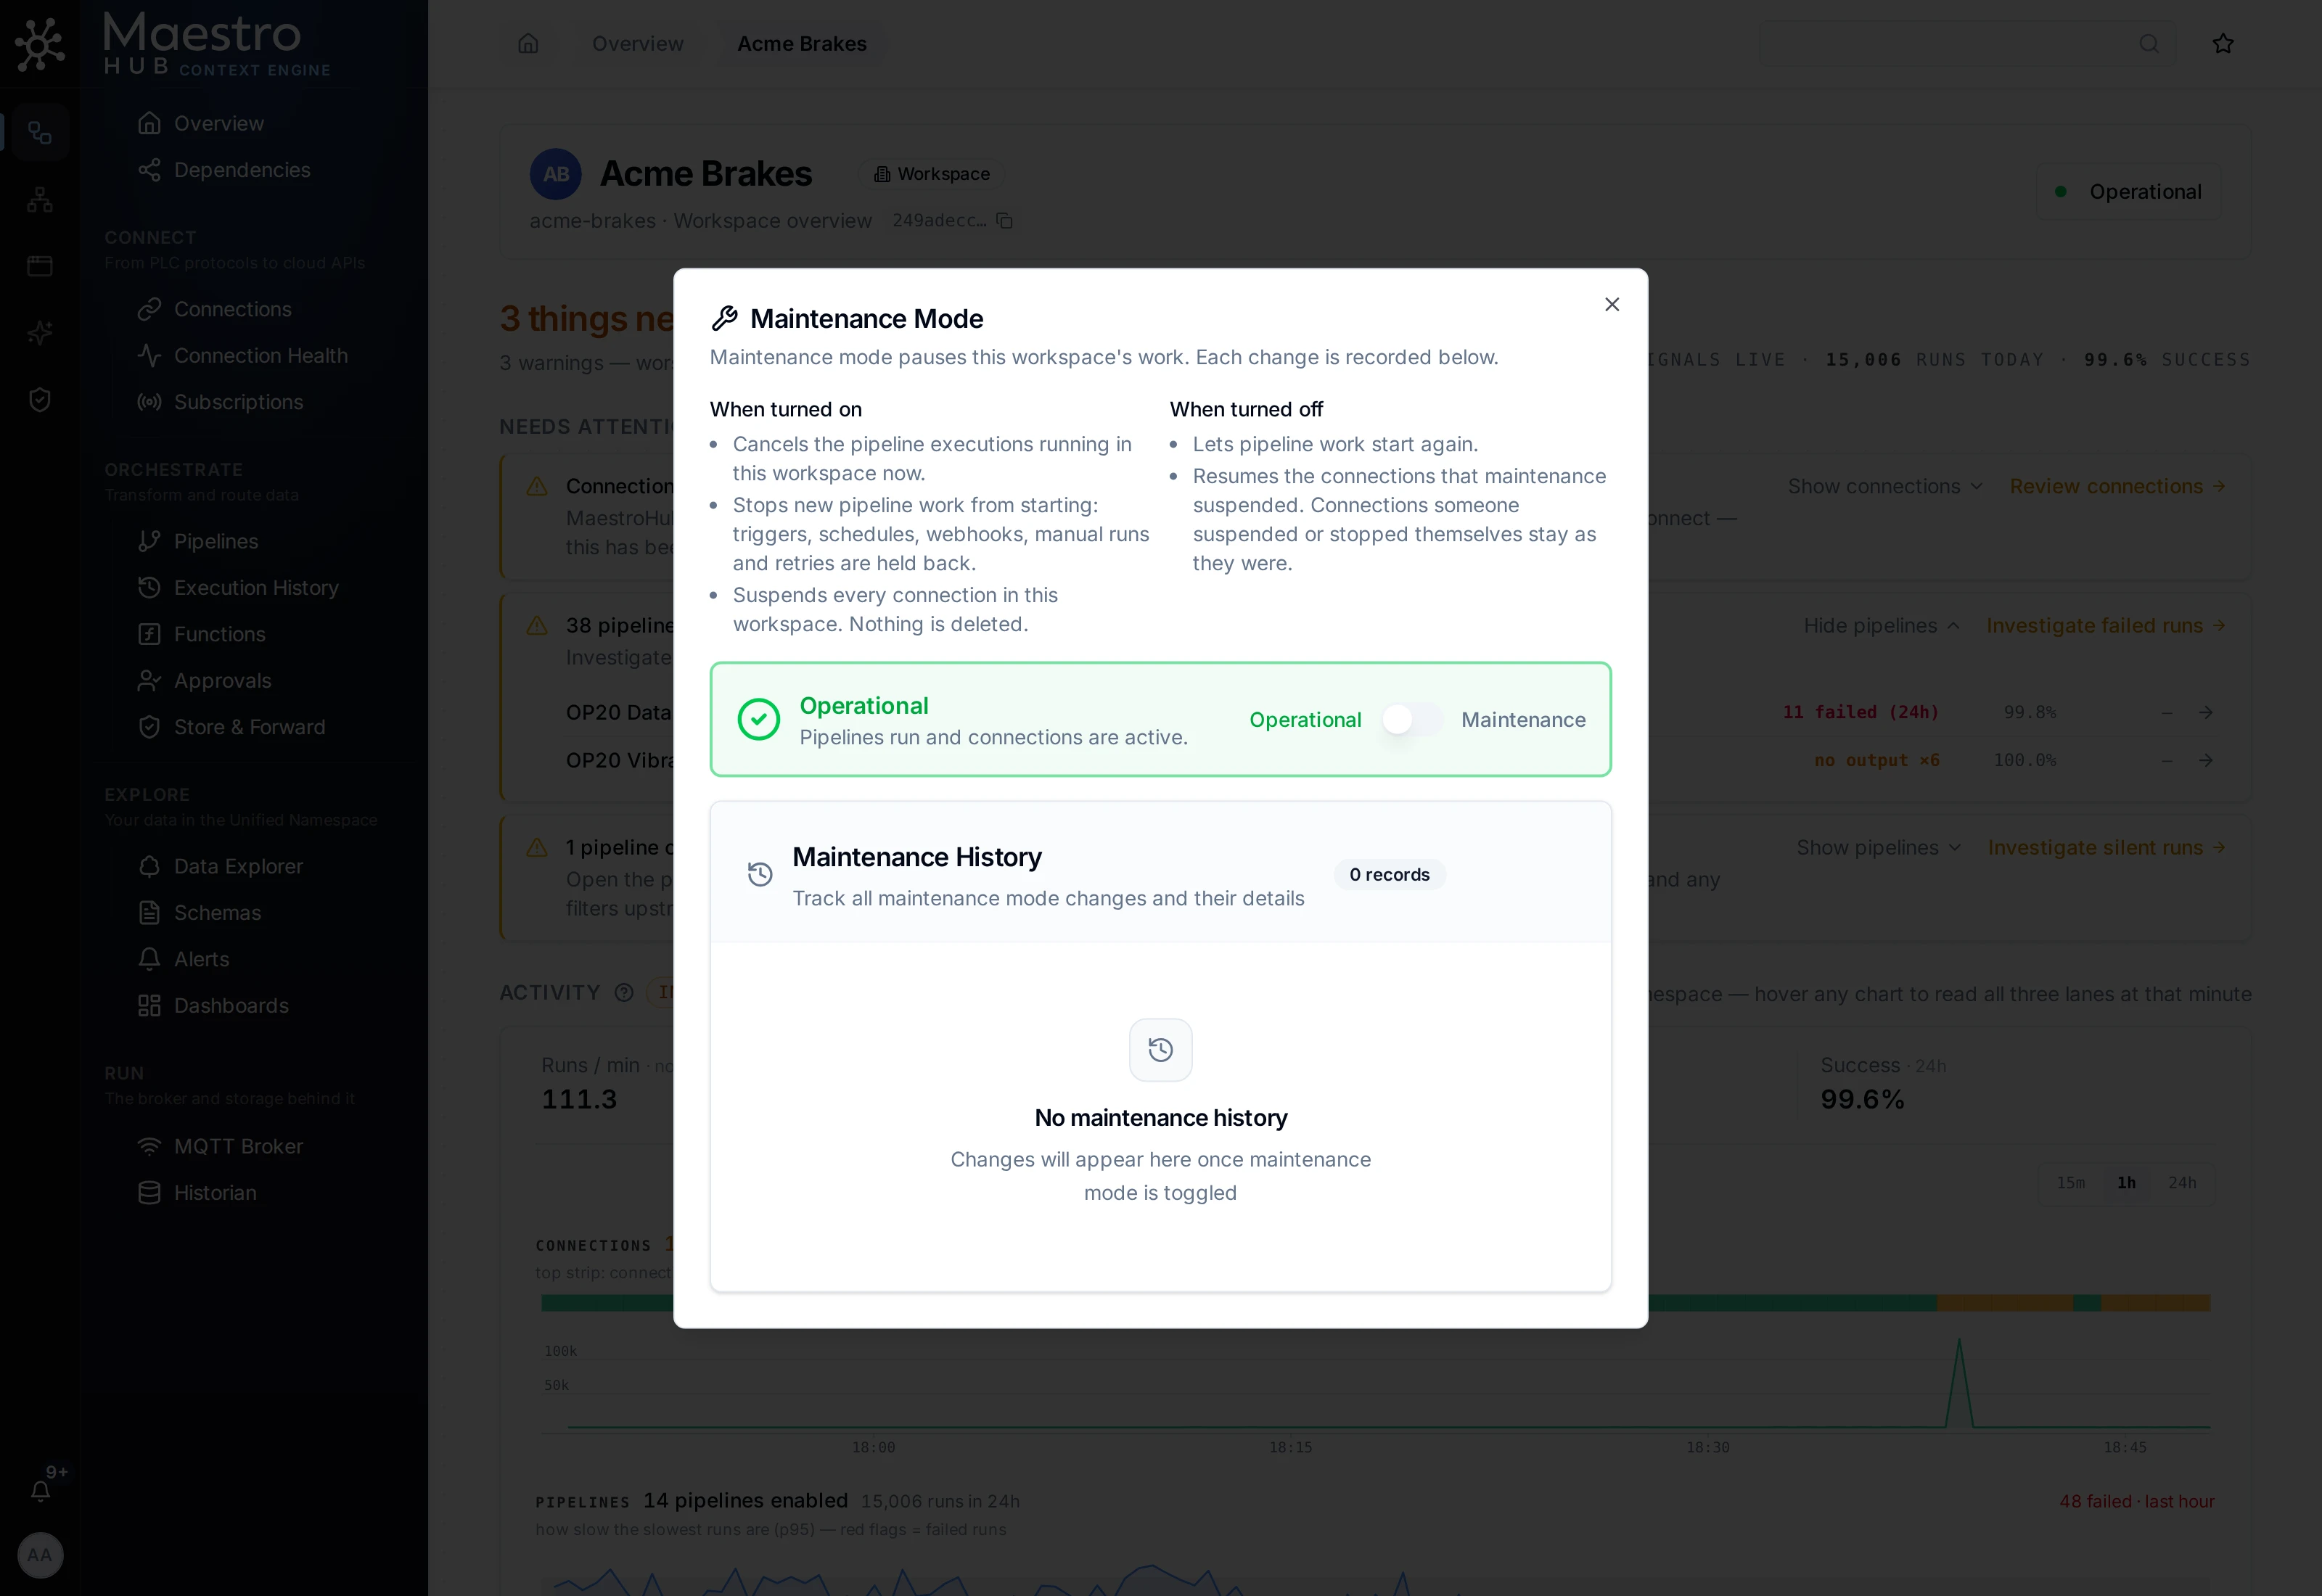
Maintenance Mode
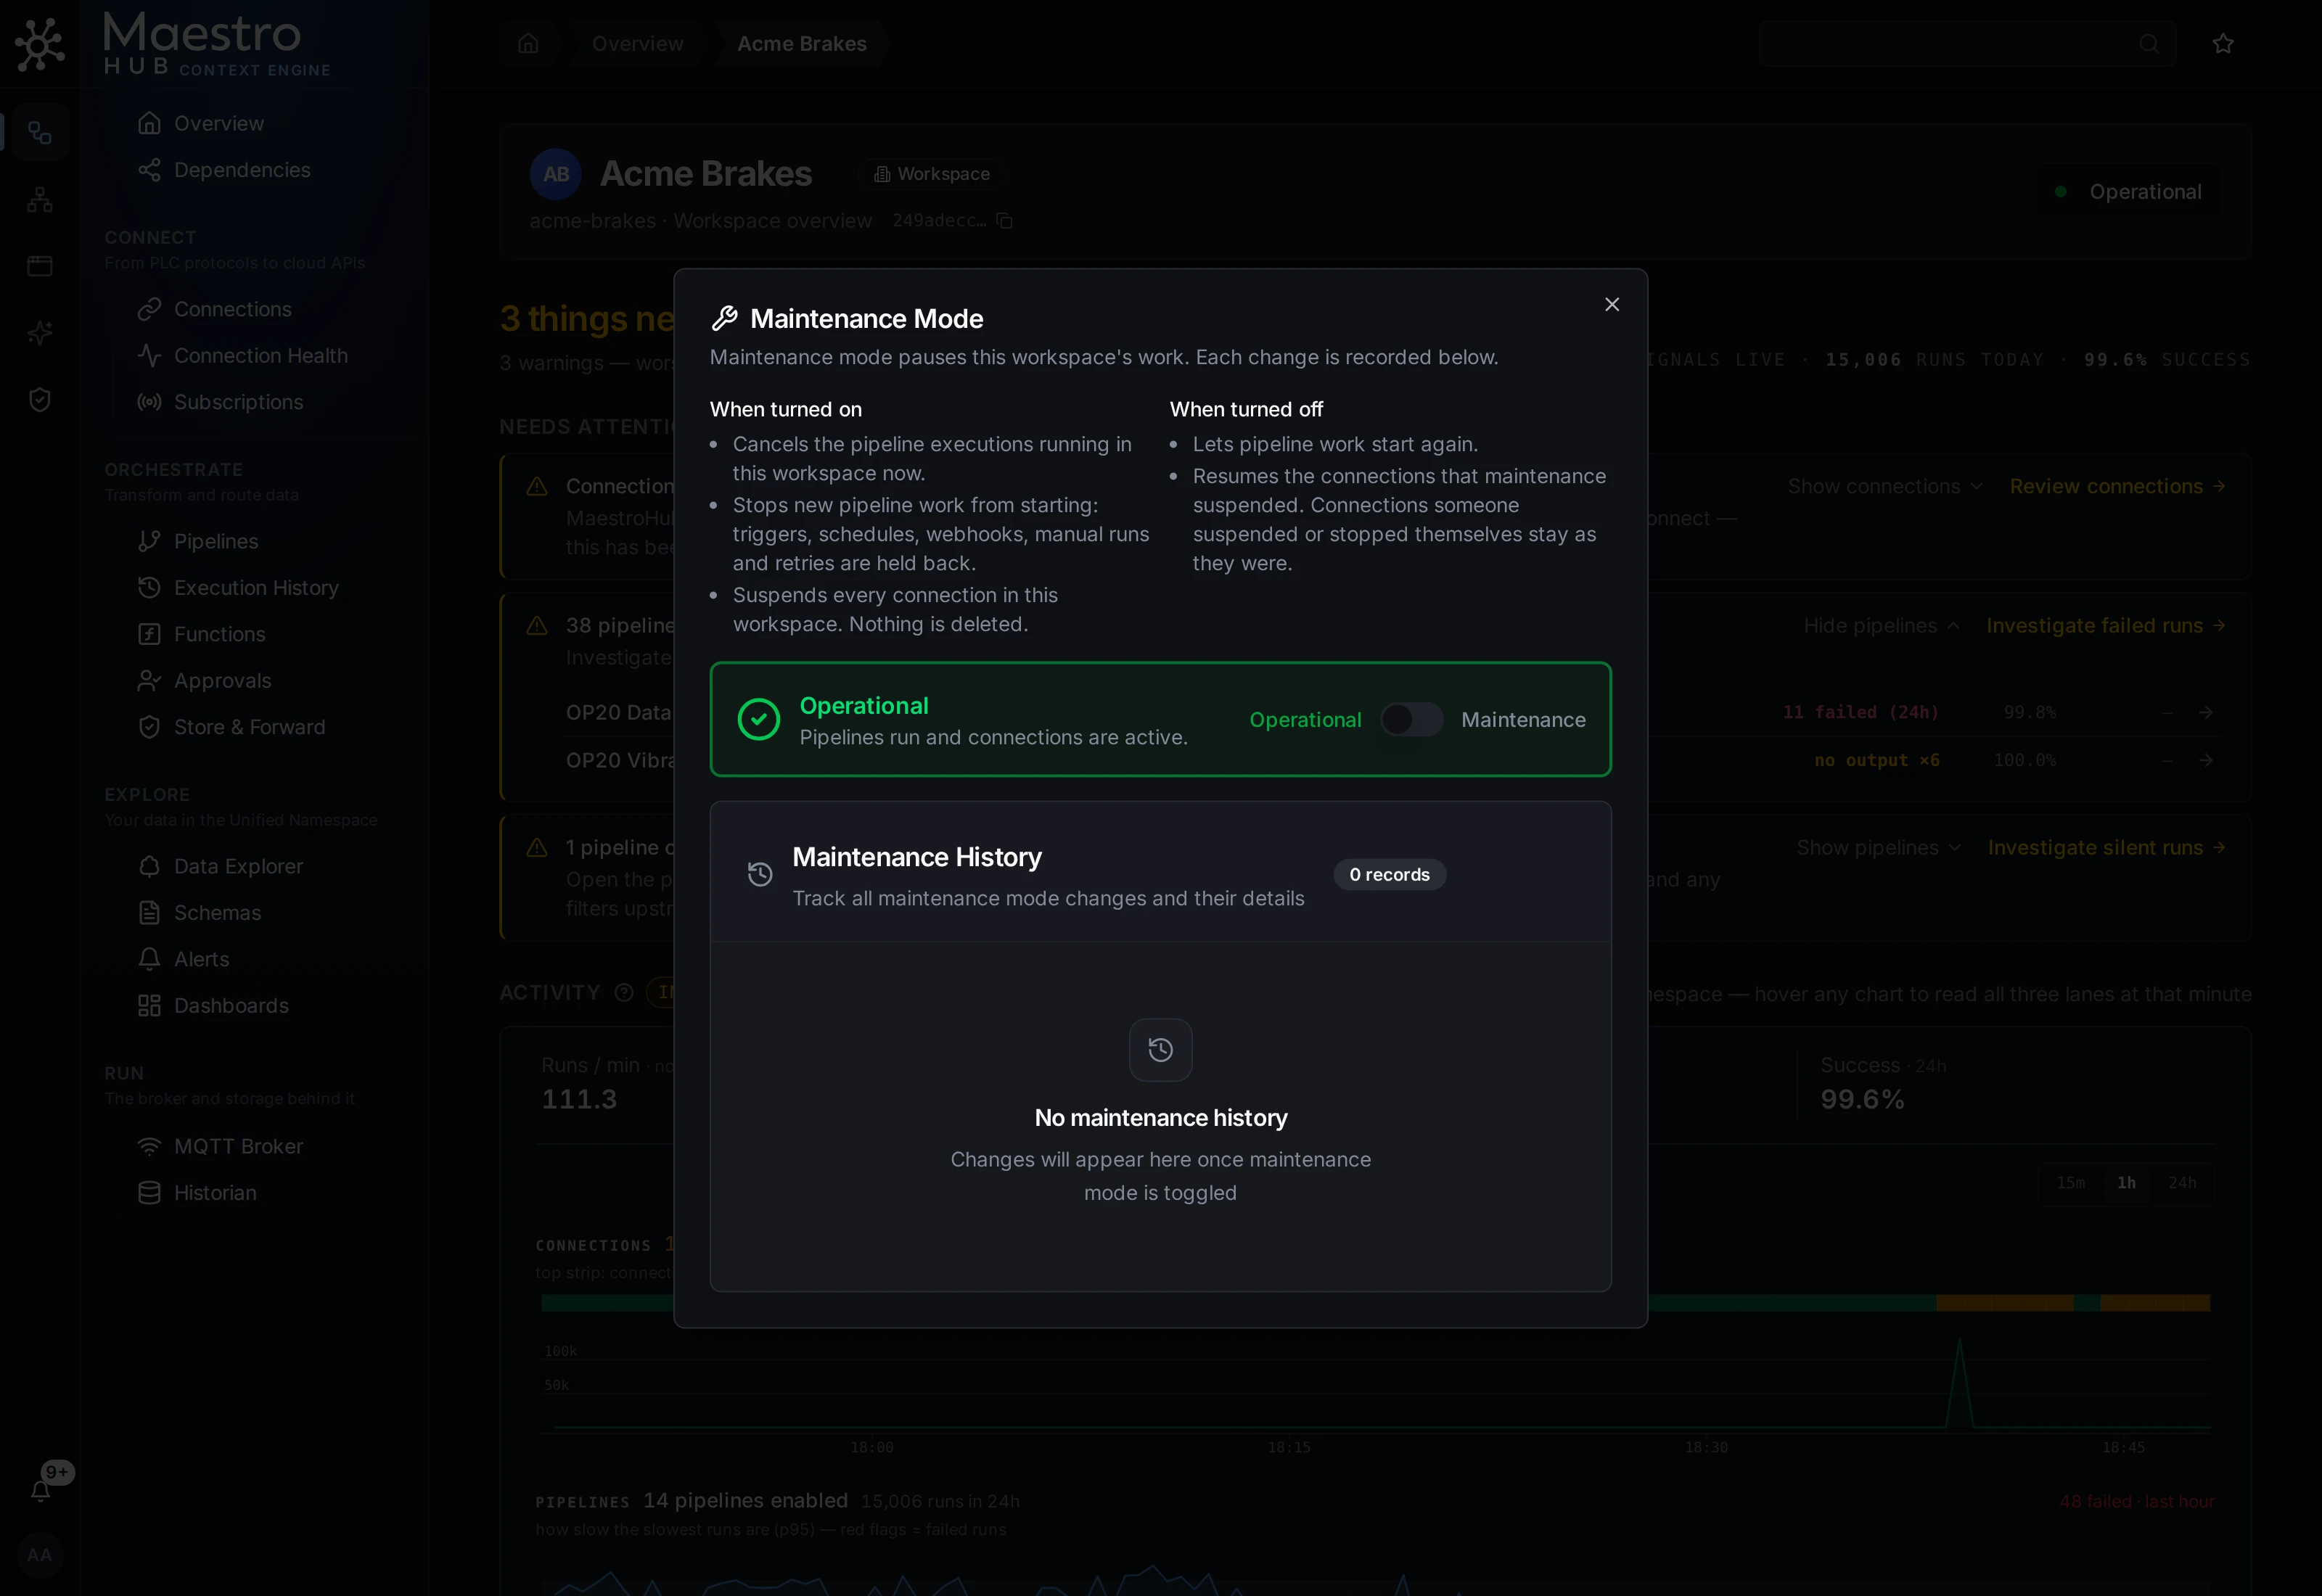
Pause one workspace's work for upgrades or planned downtime: running pipeline executions are cancelled, new pipeline work is held back, and every connection is suspended. Nothing is deleted. Turning it off resumes the connections maintenance suspended. Open it from the status pill in the workspace Overview header, or from a workspace's actions menu in the Workspaces list.
Review Maintenance Mode Status
Click the status pill in the workspace Overview header (or choose Enter/Exit maintenance in the Workspaces list) to open the Maintenance Mode dialog: the workspace's state, the switch, and the maintenance history.
MQTT Broker and Historian
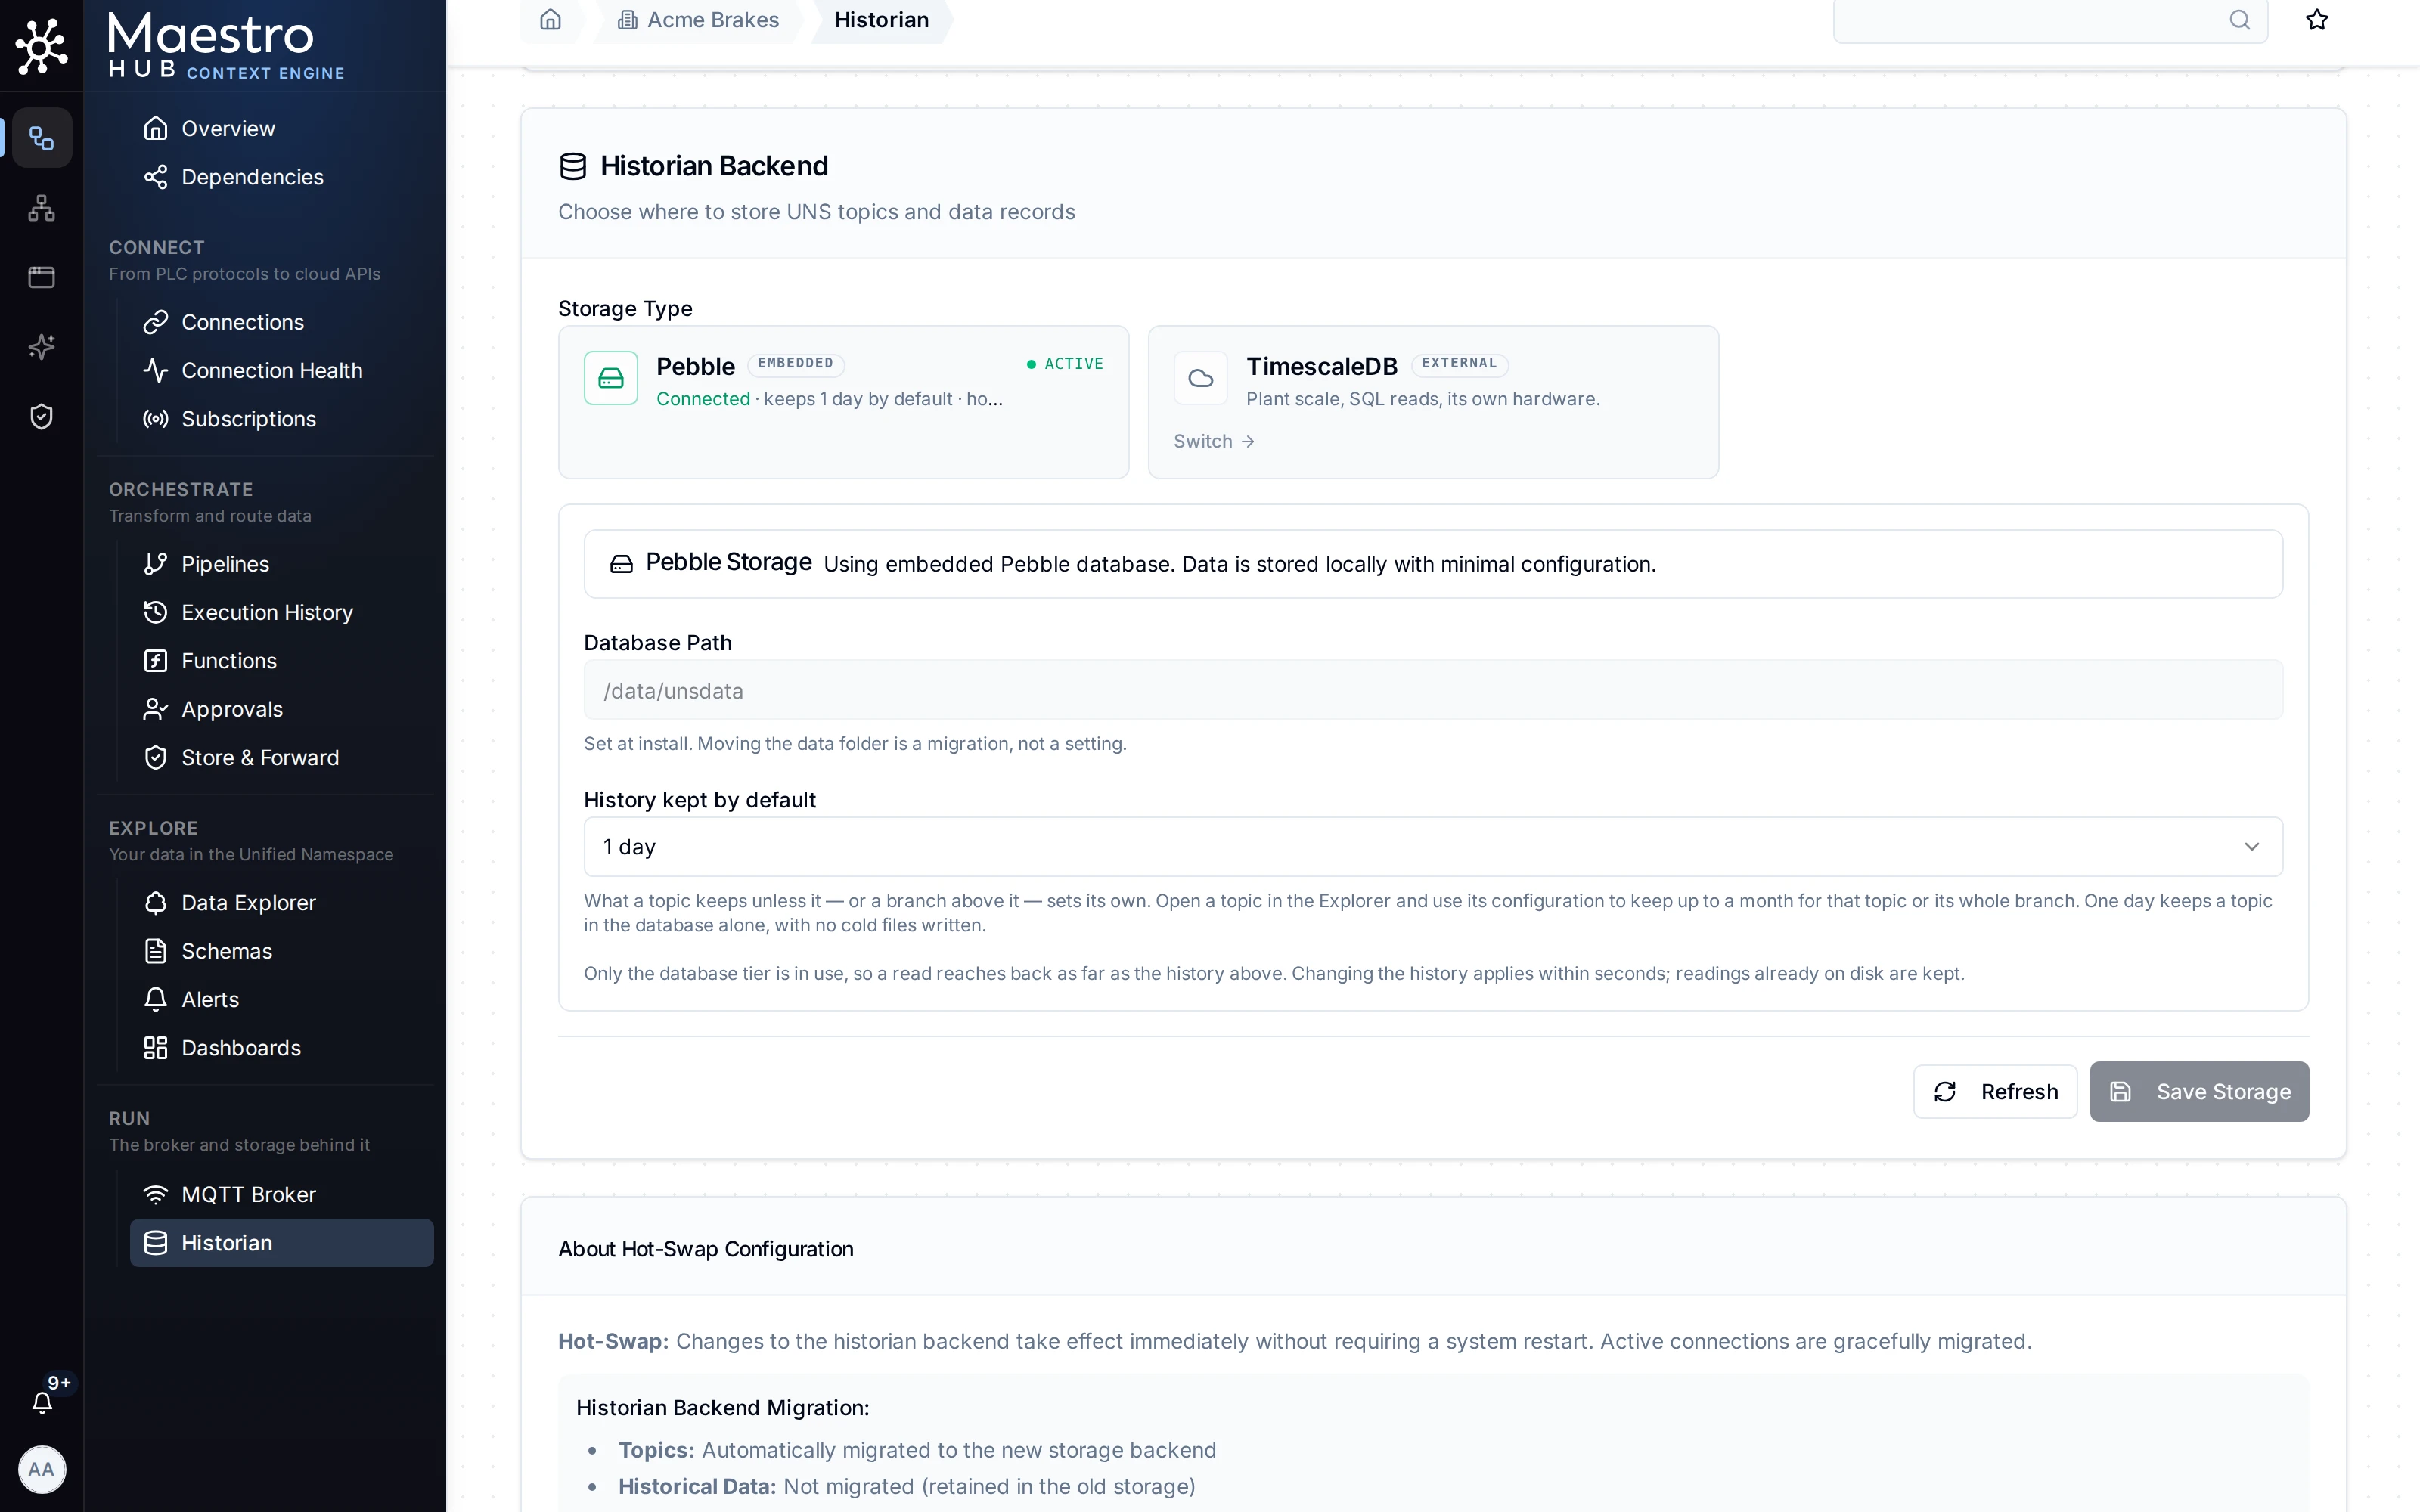
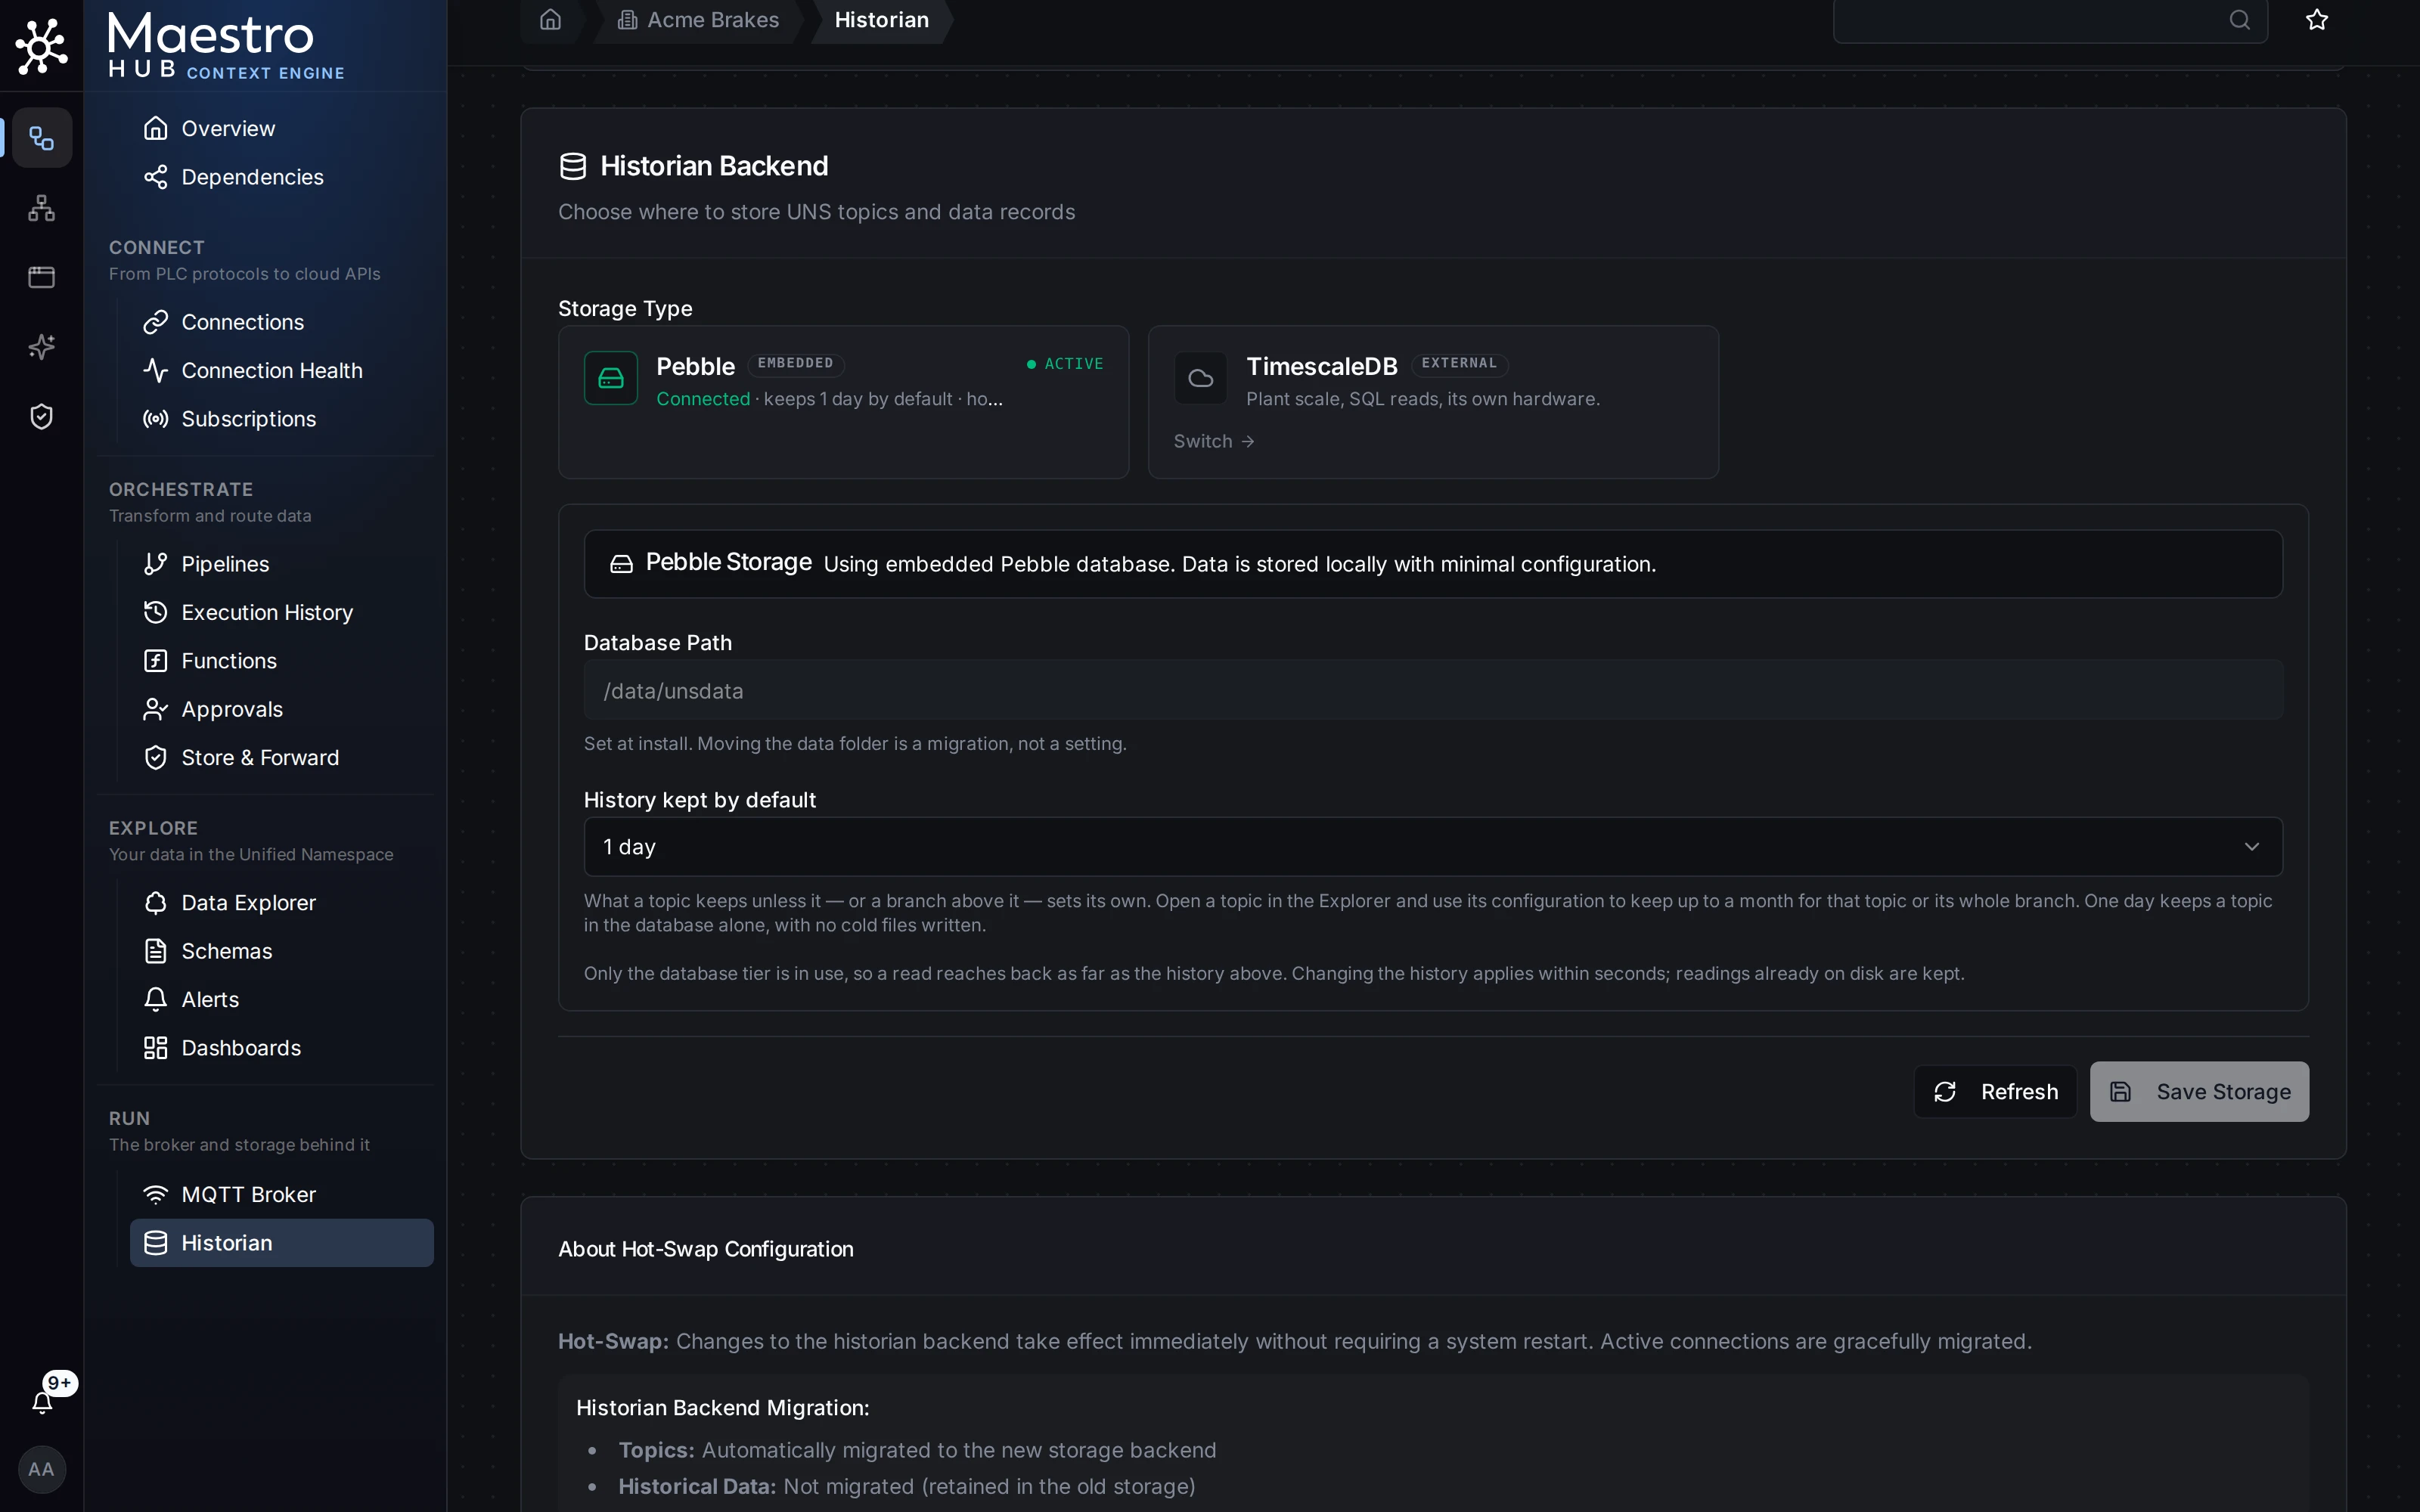
Choose where topic history is stored (embedded Pebble or TimescaleDB), configure the built-in MQTT broker that outside systems connect to, and see whether each one is up.
Find the MQTT Broker and Historian Pages
The UNS Settings tab is gone. Its two halves are now separate pages under Context Engine › Run in the sidebar: MQTT Broker and Historian. There is one broker and one historian per installation, so only a platform administrator sees them. The Historian page opens with a short How this works lesson; the MQTT Broker page explains itself under its <b>?</b> guide.
Workspaces
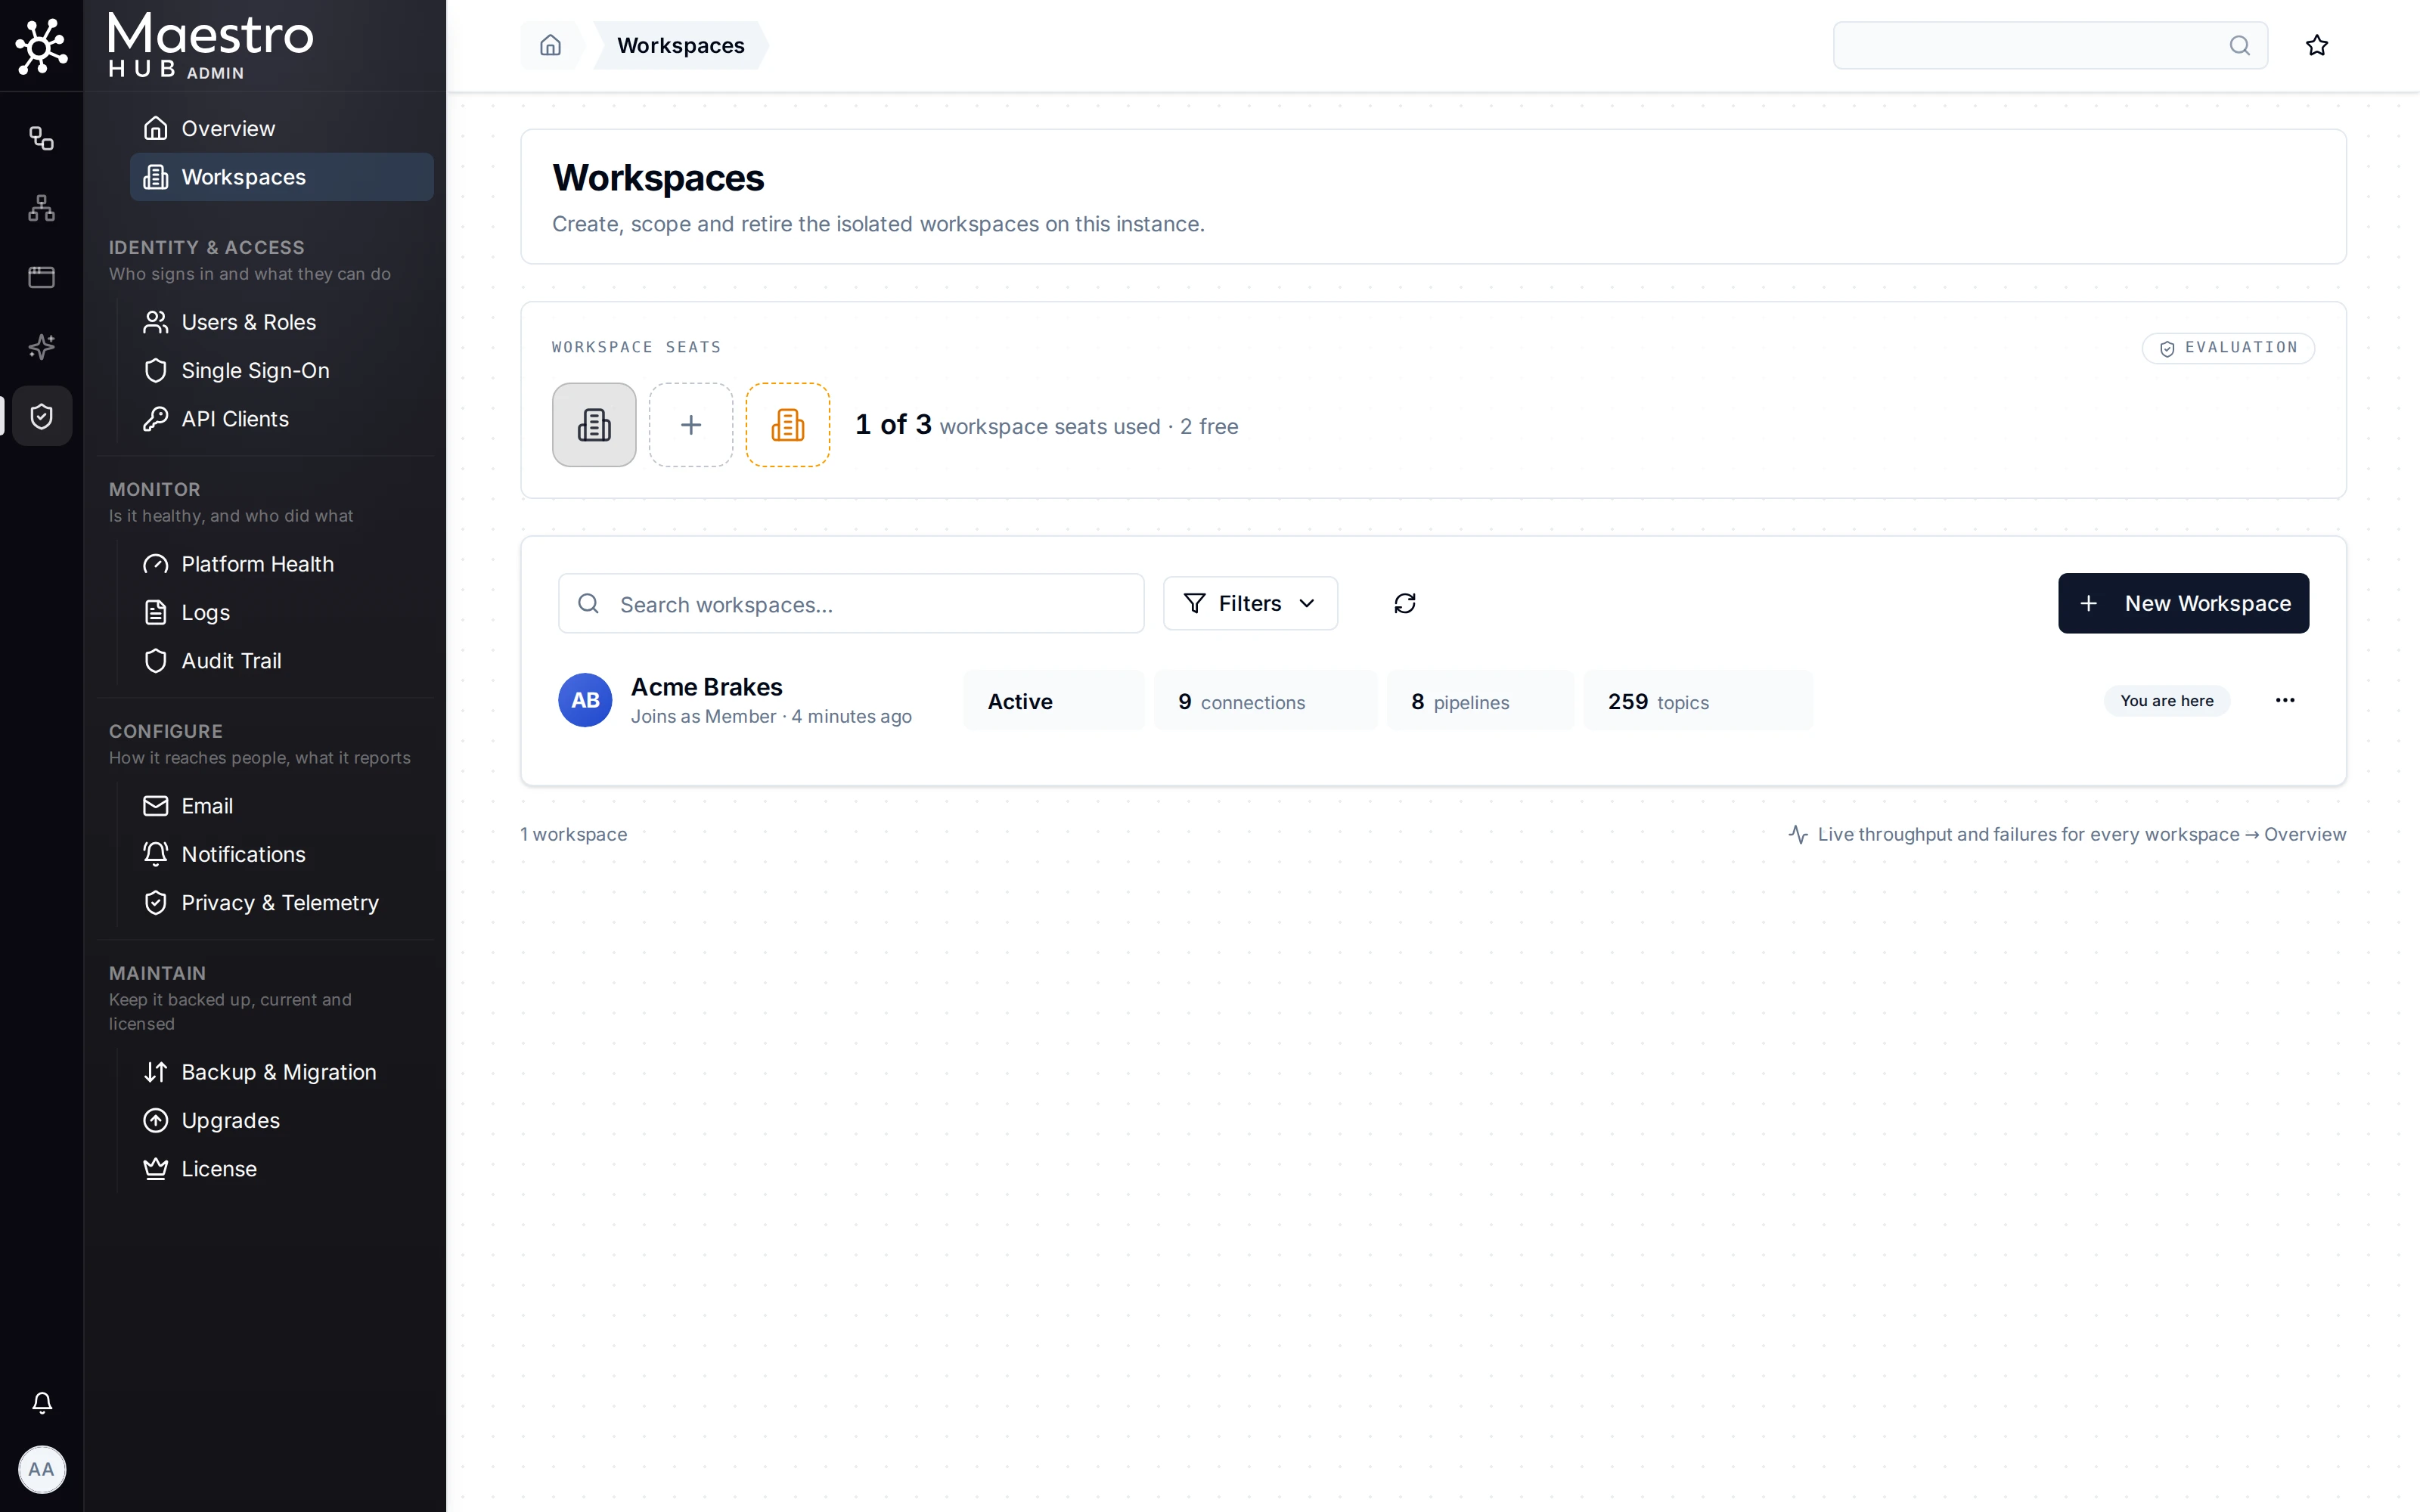
Create and manage workspaces. Each workspace is isolated and has its own connections, pipelines, UNS topics, users, and dashboards. Every instance has at least one workspace, created at first boot, and can create more as the licence allows.
Browse the Workspaces List
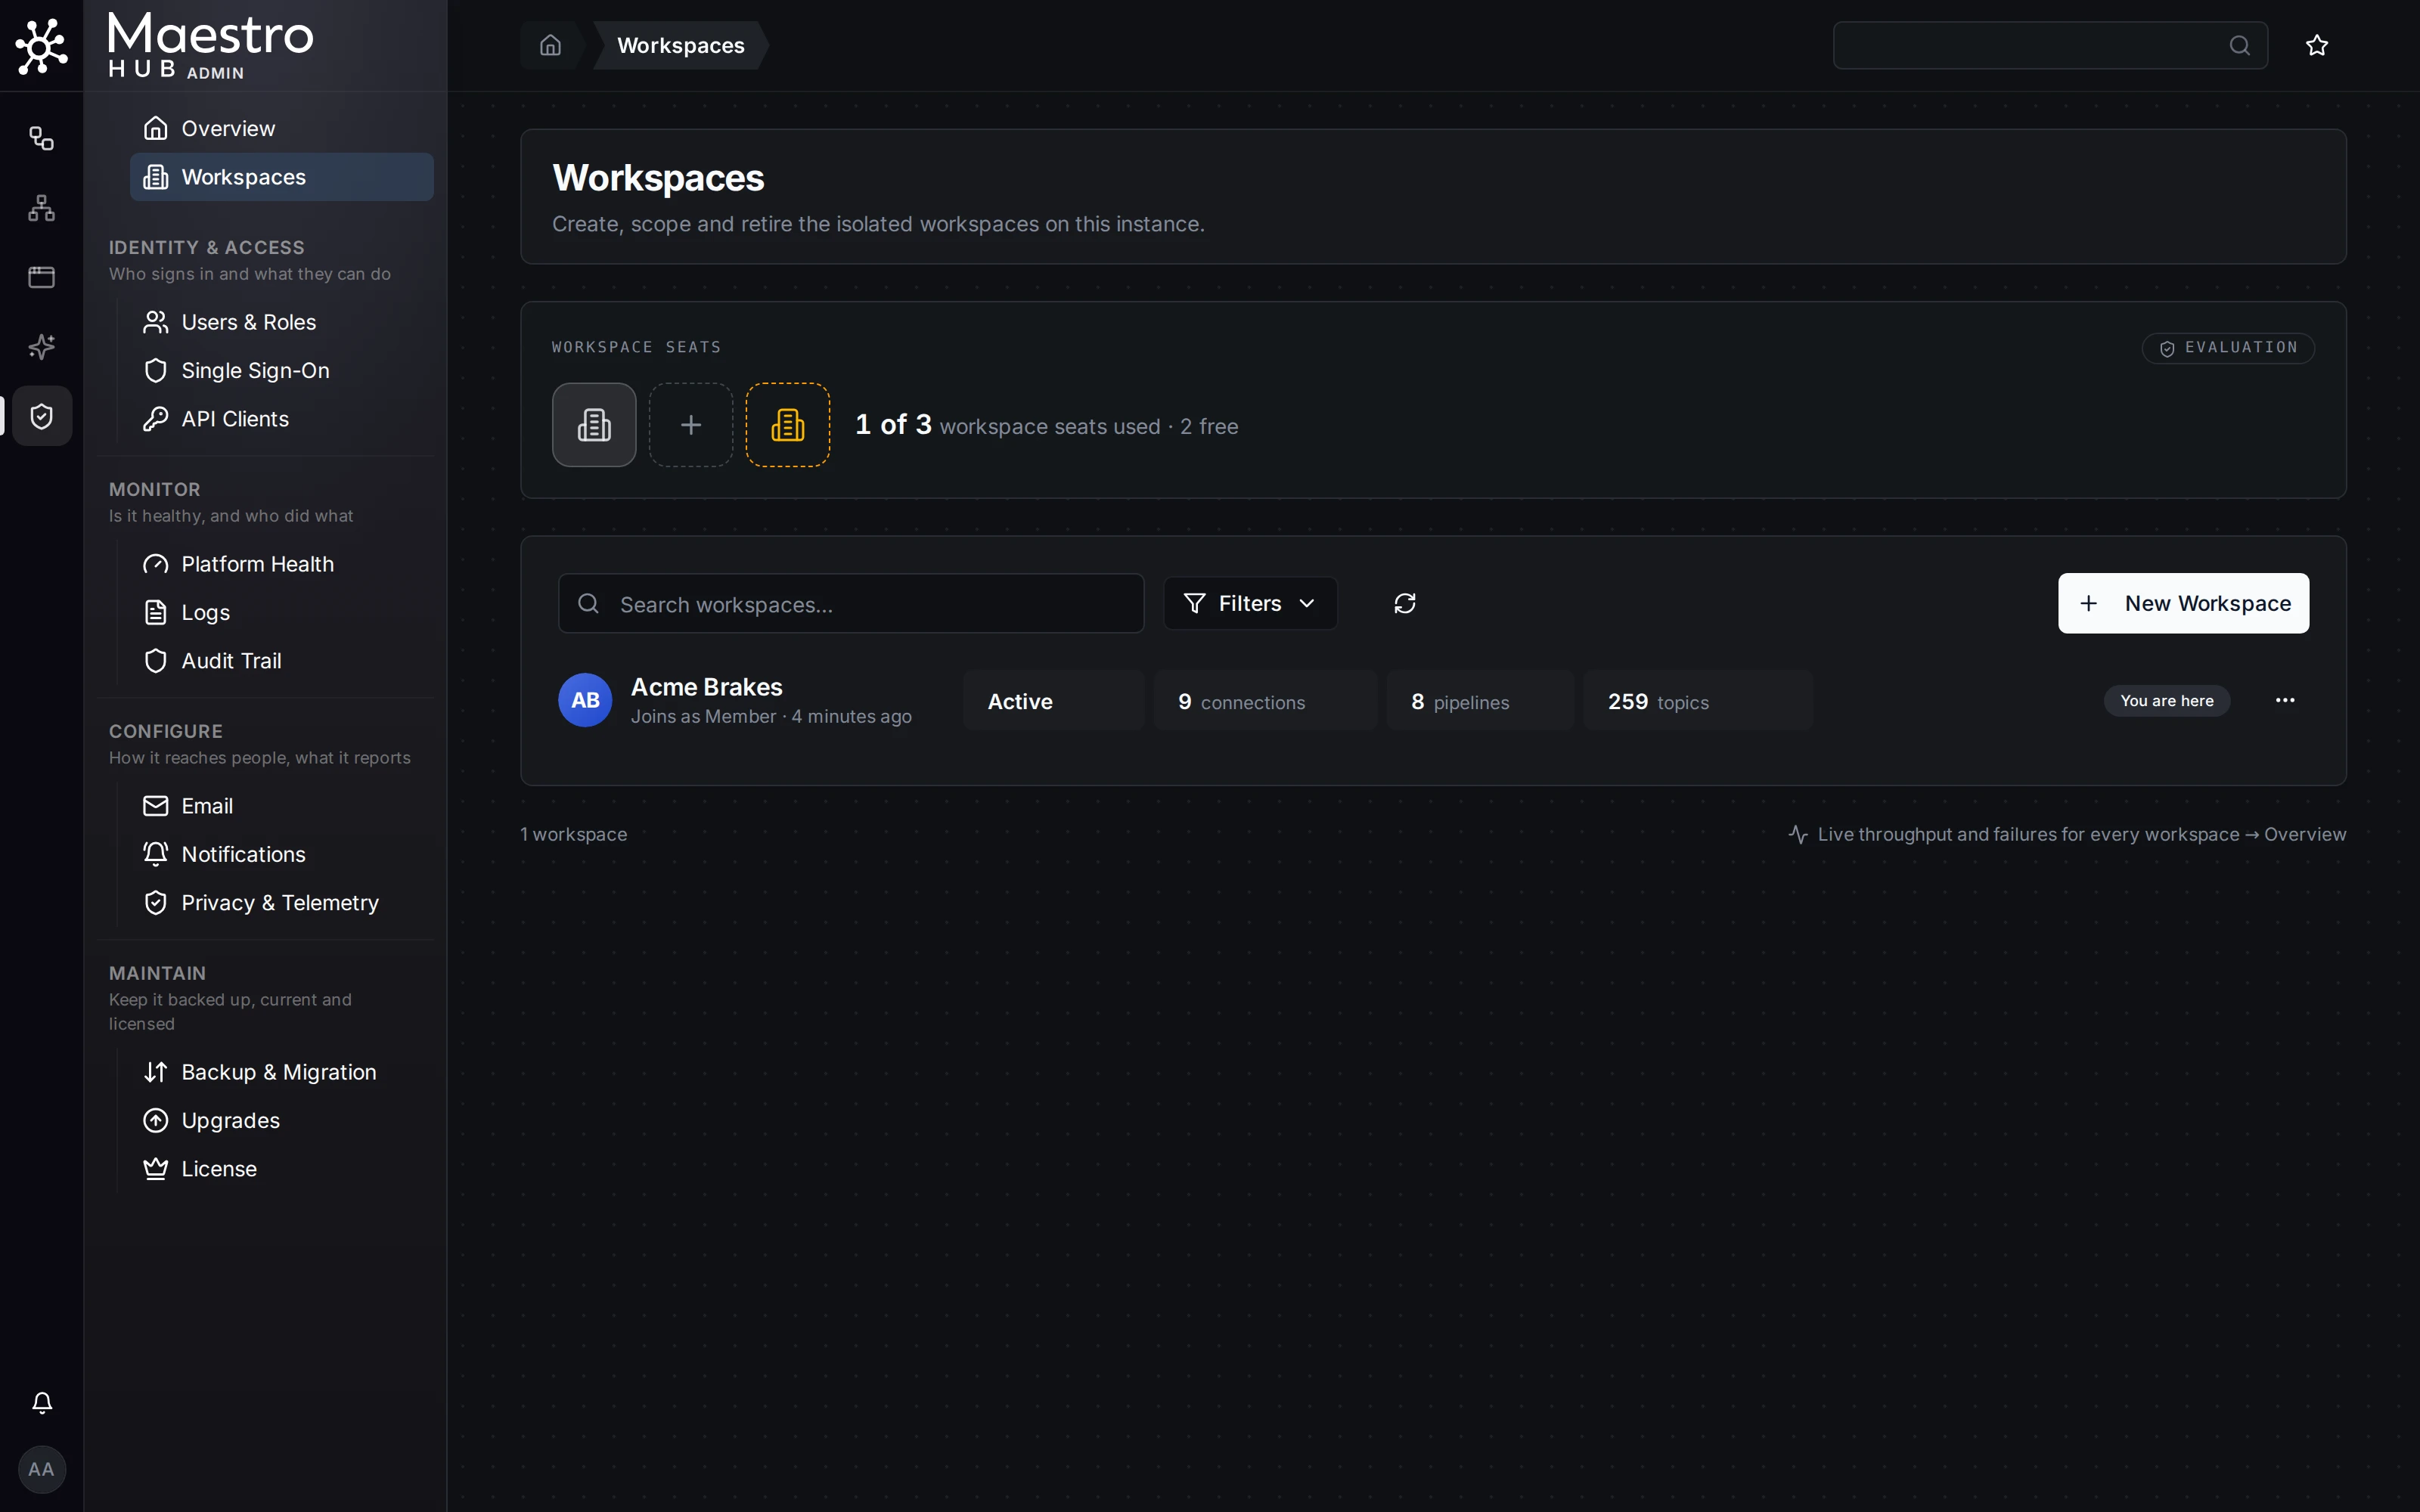
The Workspaces page (Admin › Workspaces) lists the workspaces on this Context Engine instance. Every instance has at least one, and you can create more with New Workspace as your licence allows; the Workspace seats band shows how many seats are used.
License
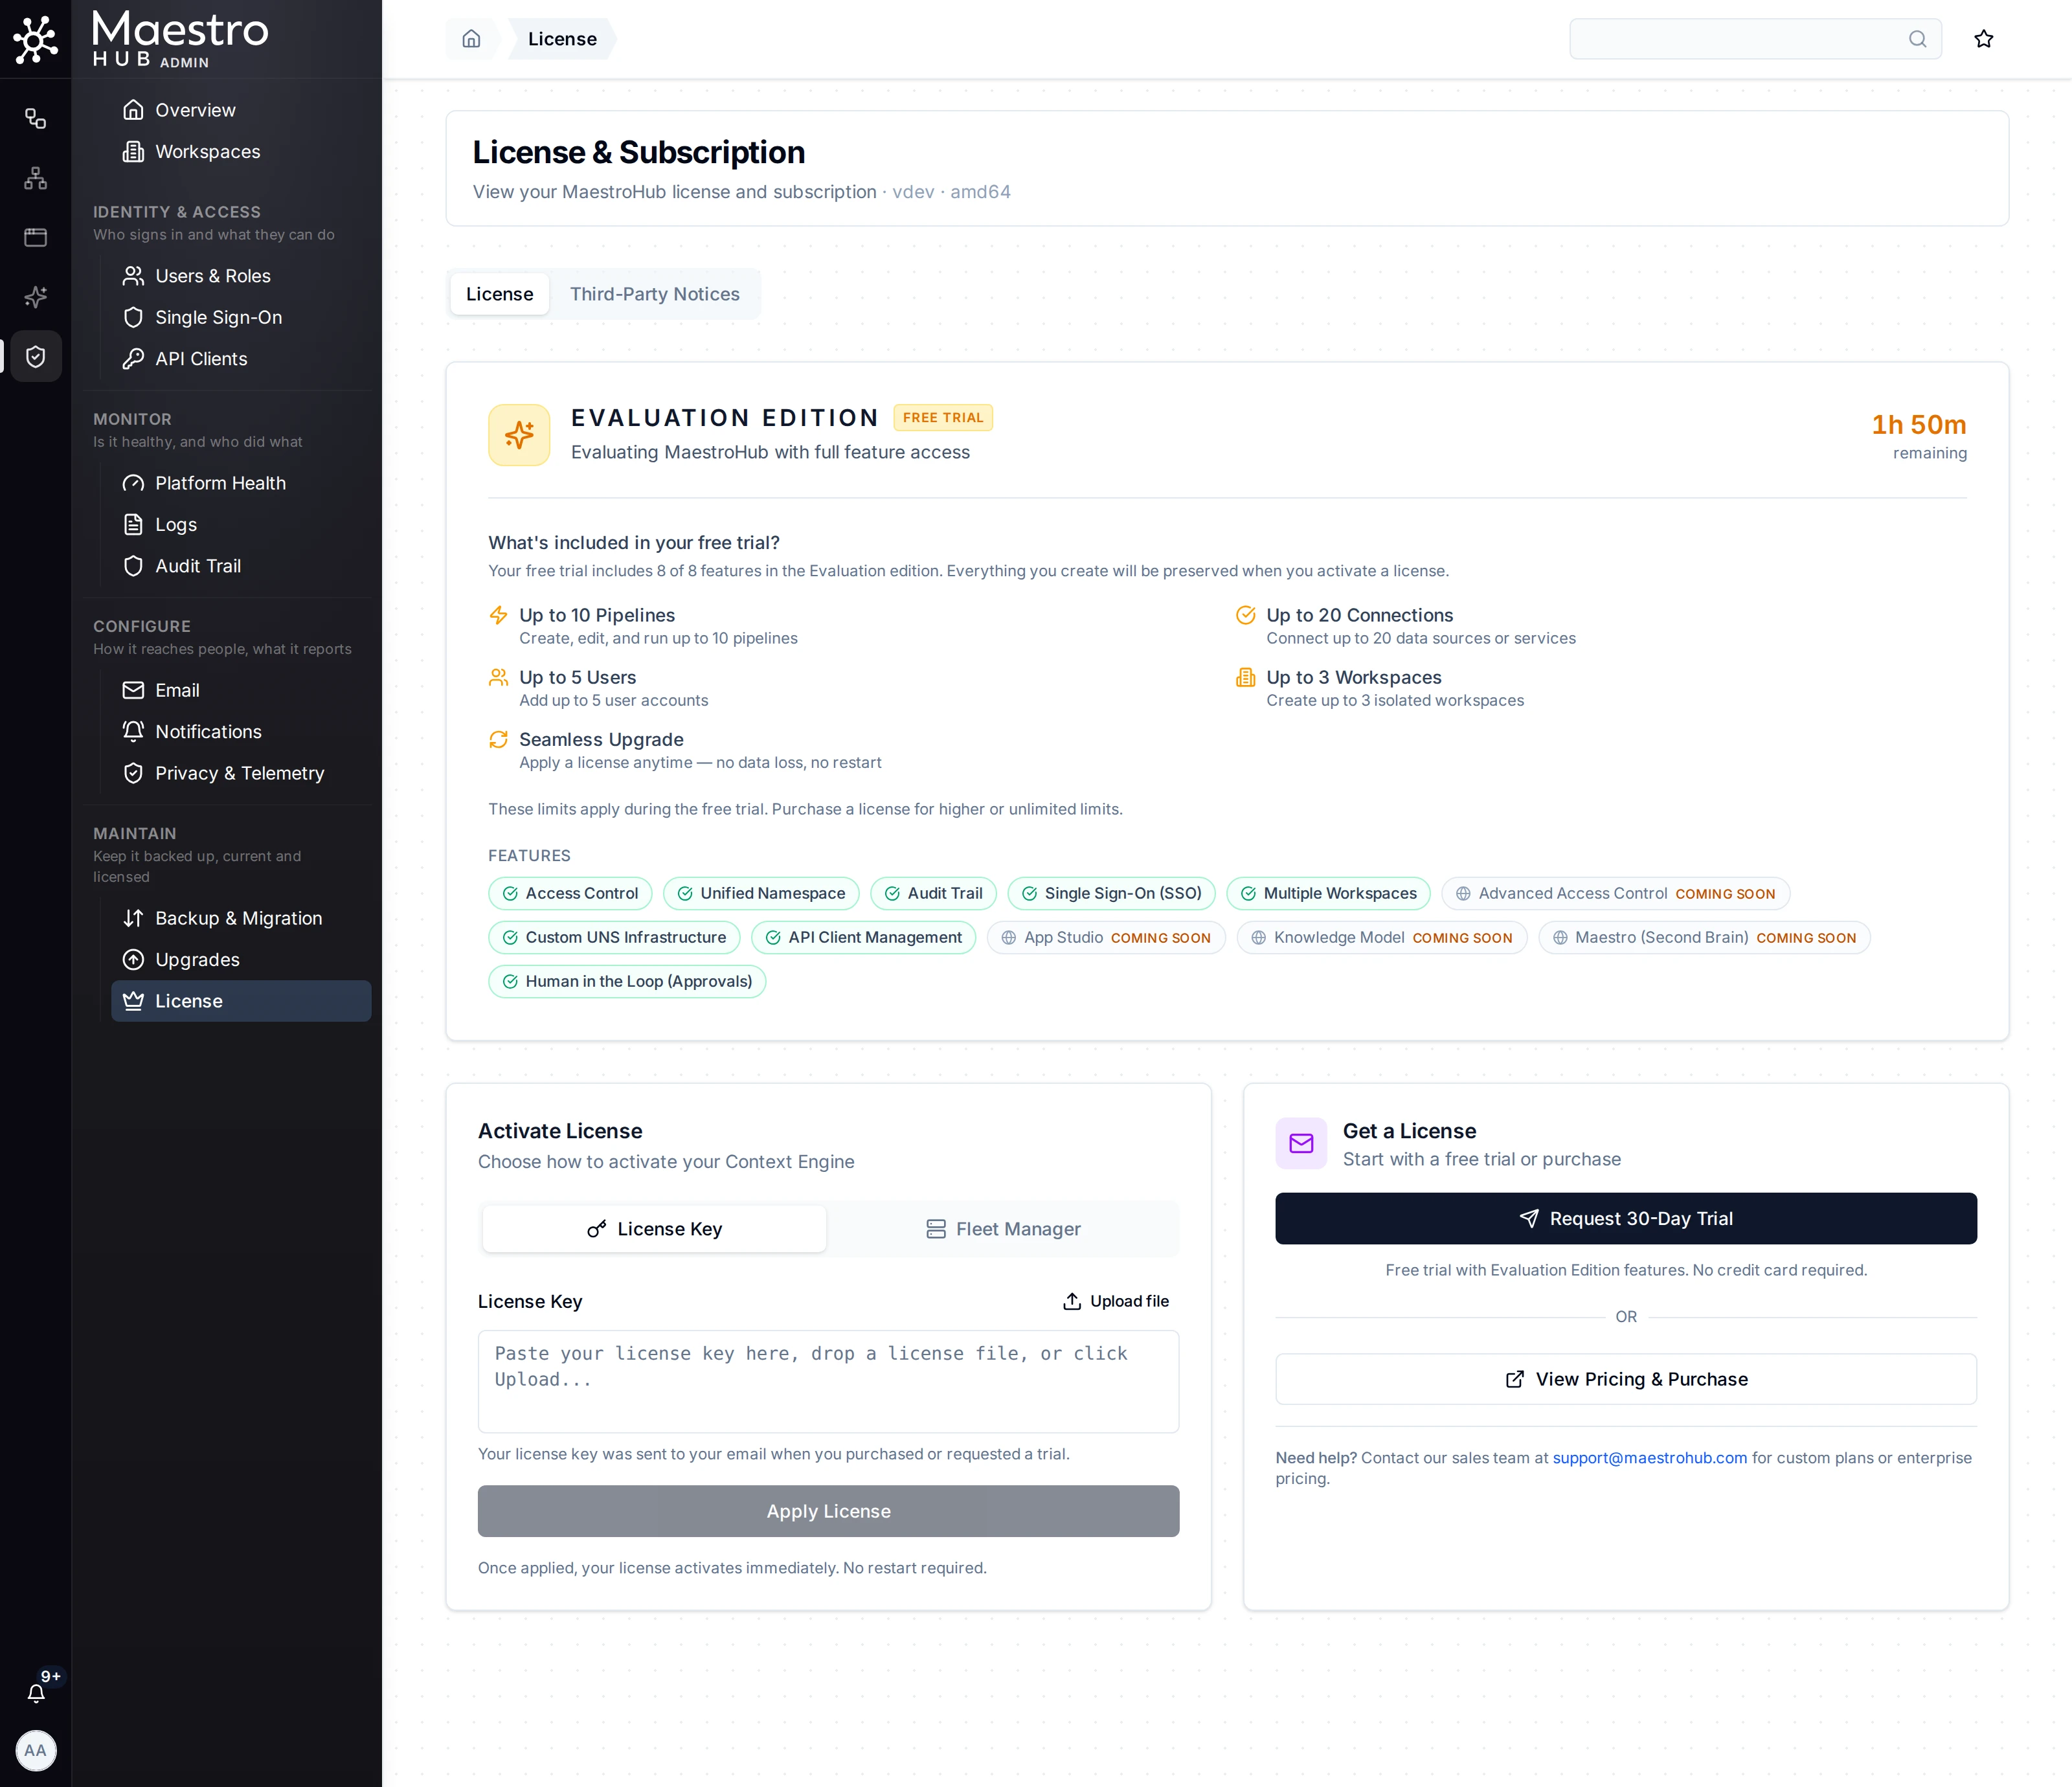
Activate your license key, view the edition and expiry date, and link to Fleet Manager for fleet-wide licence management.
Review License Status and Update Options
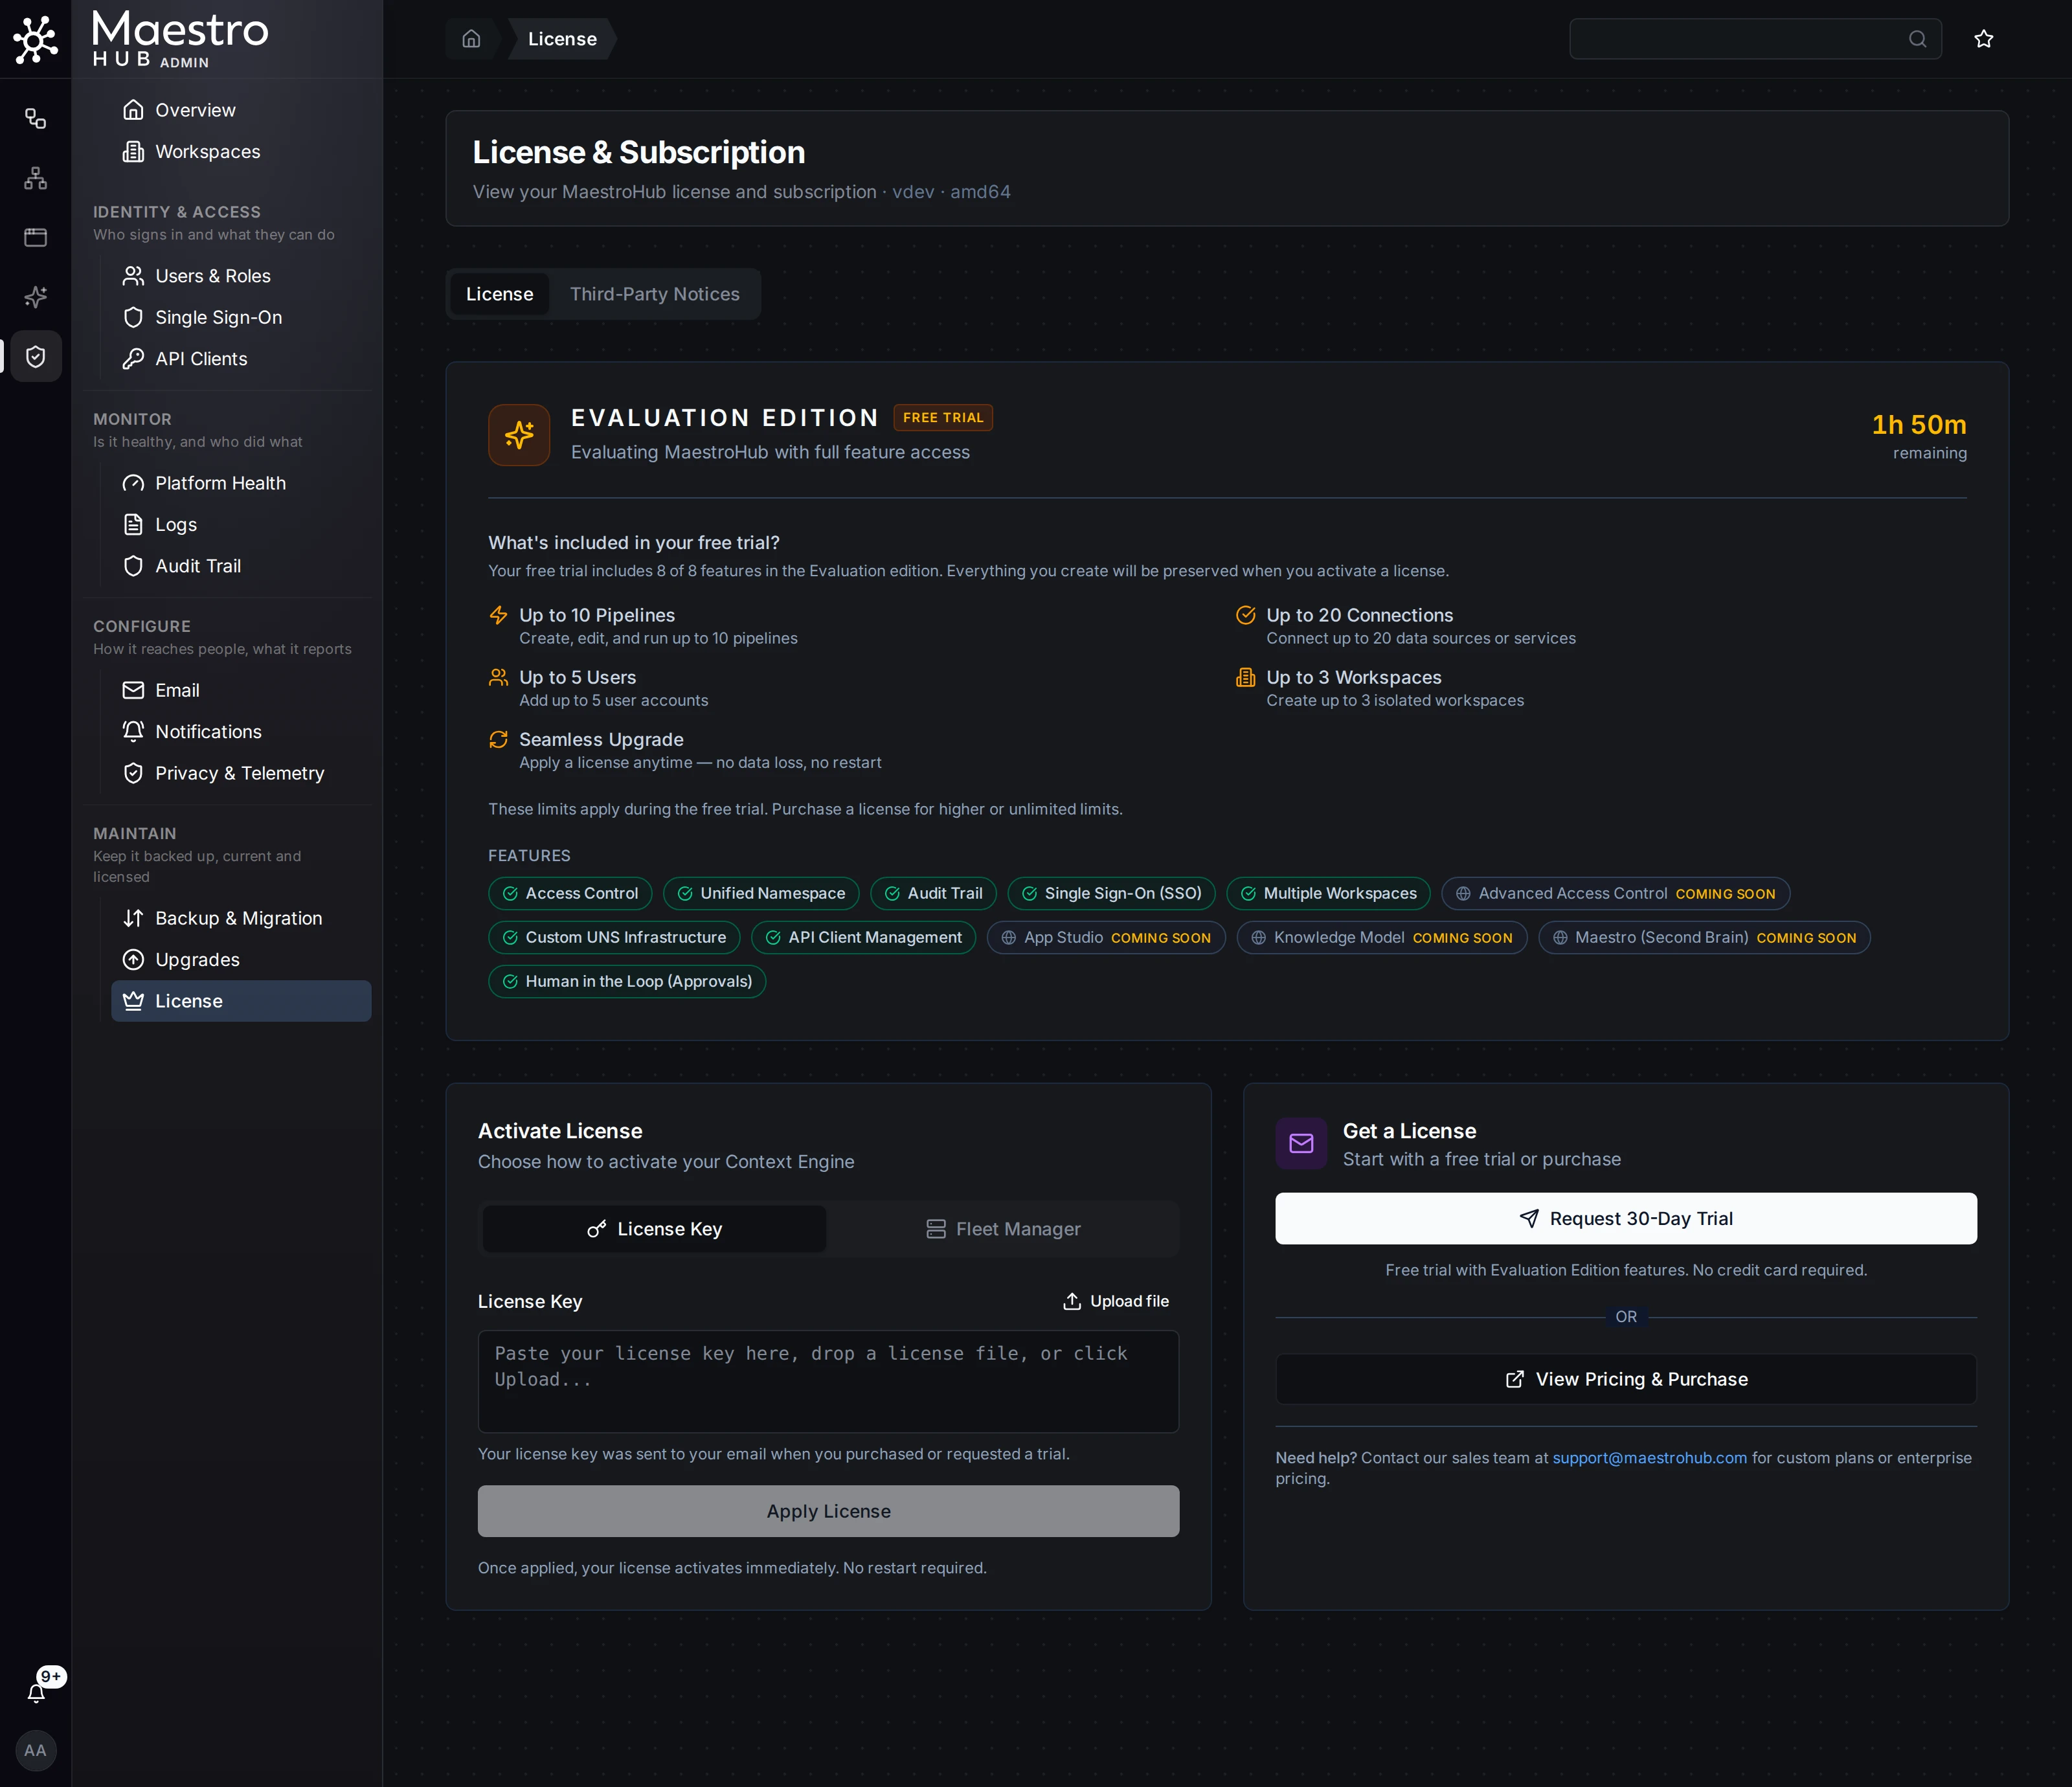
Admin › Maintain › License shows the licence this instance runs, its limits and features, and the ways to activate a license. Here the instance runs the Evaluation licence.
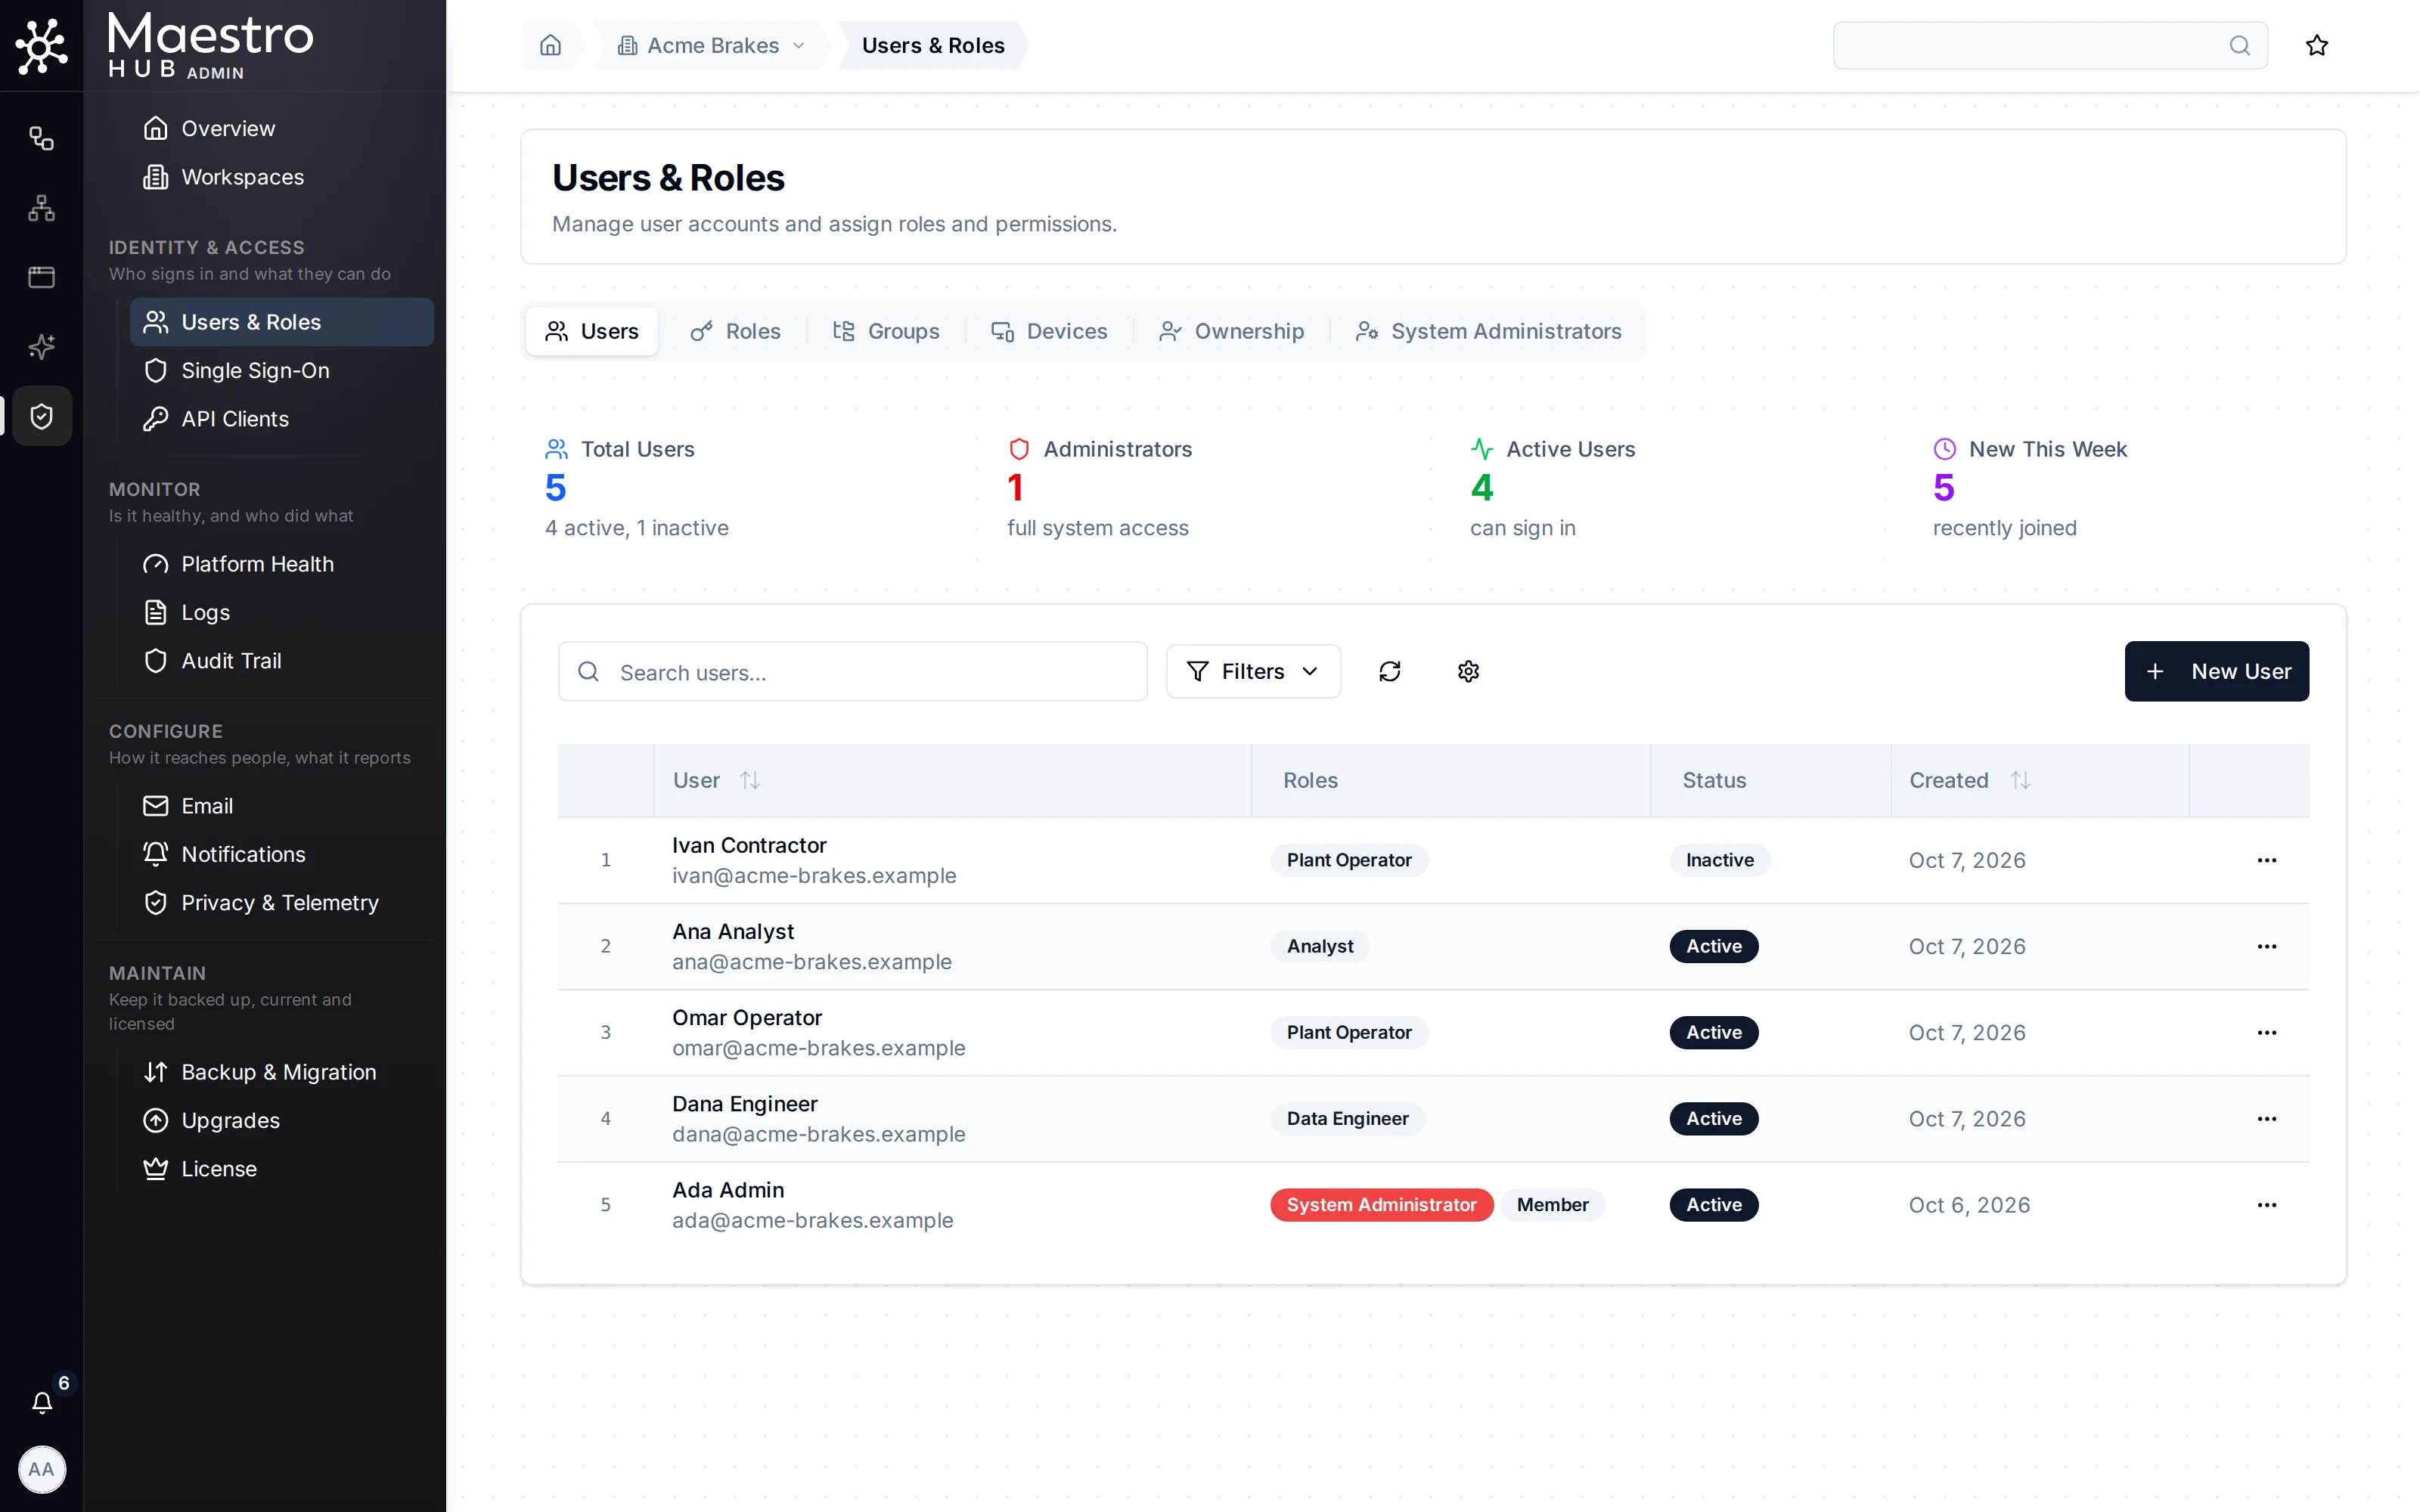
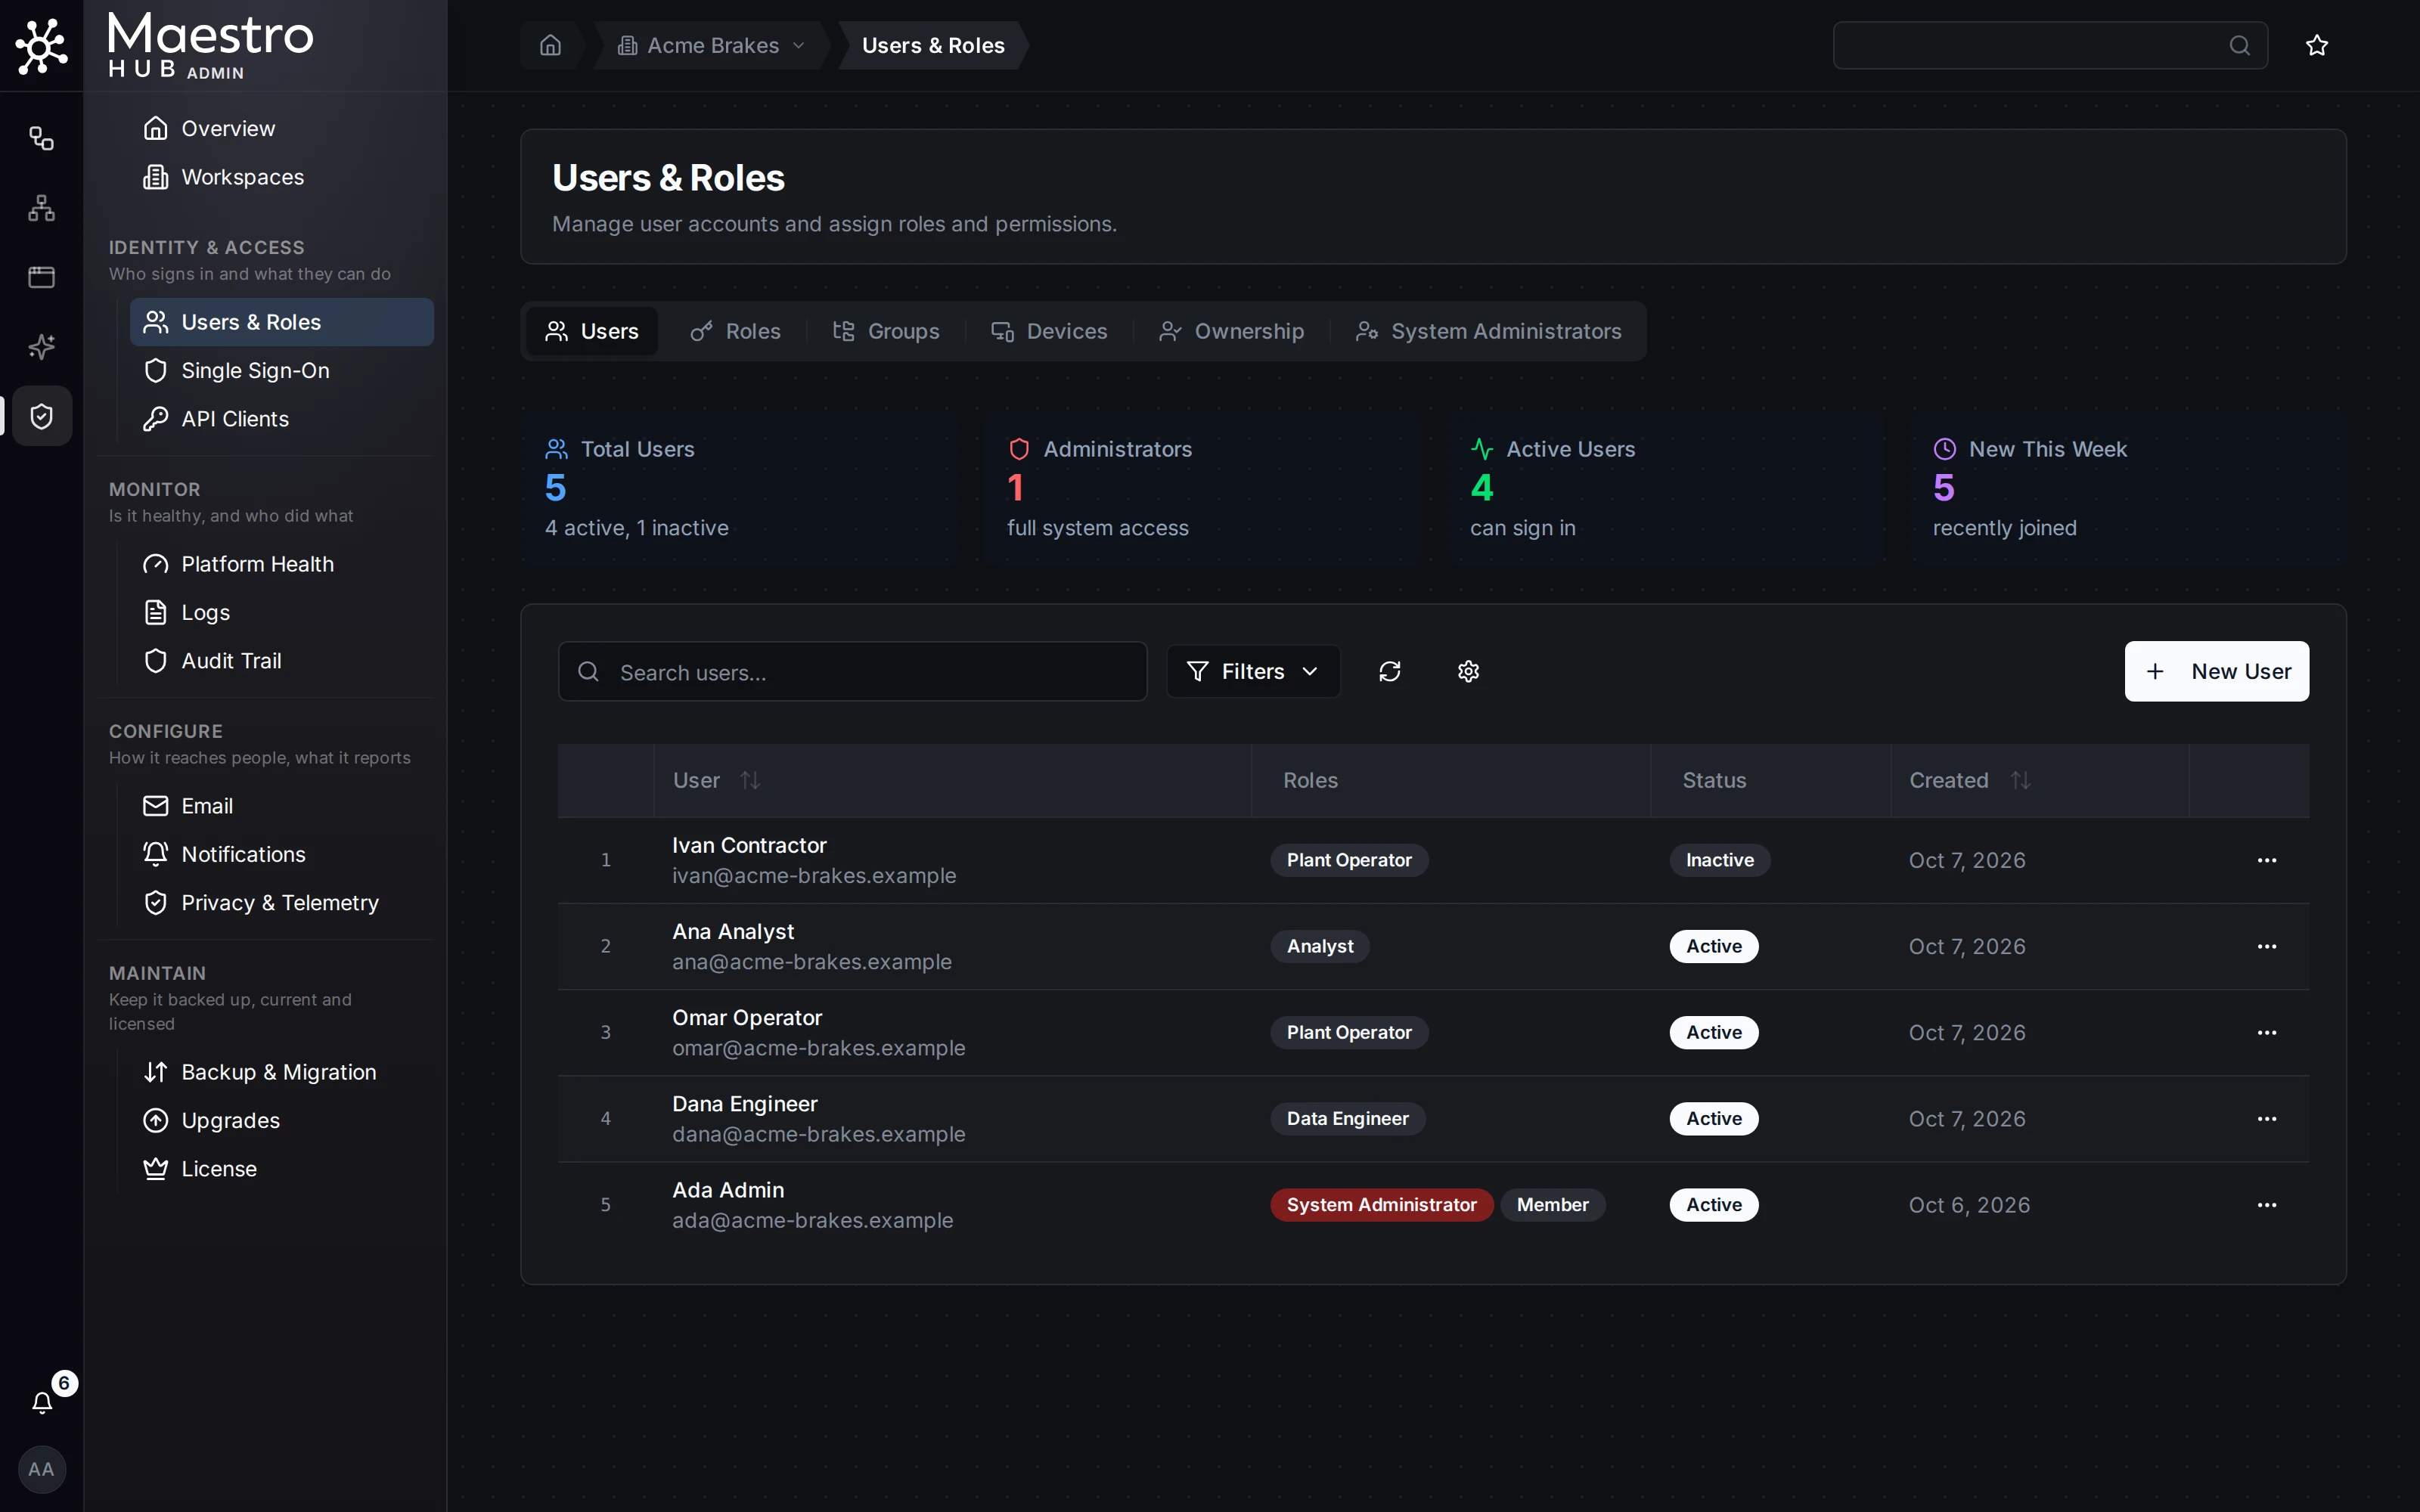
Users & Roles
Invite users by email, assign roles, deactivate accounts, and search or filter the user list.
Open Users & Roles
Admin › Identity & Access › Users & Roles opens on the Users tab: four summary cards, then the user table, with New User for adding an account.
SSO Deep-Dive
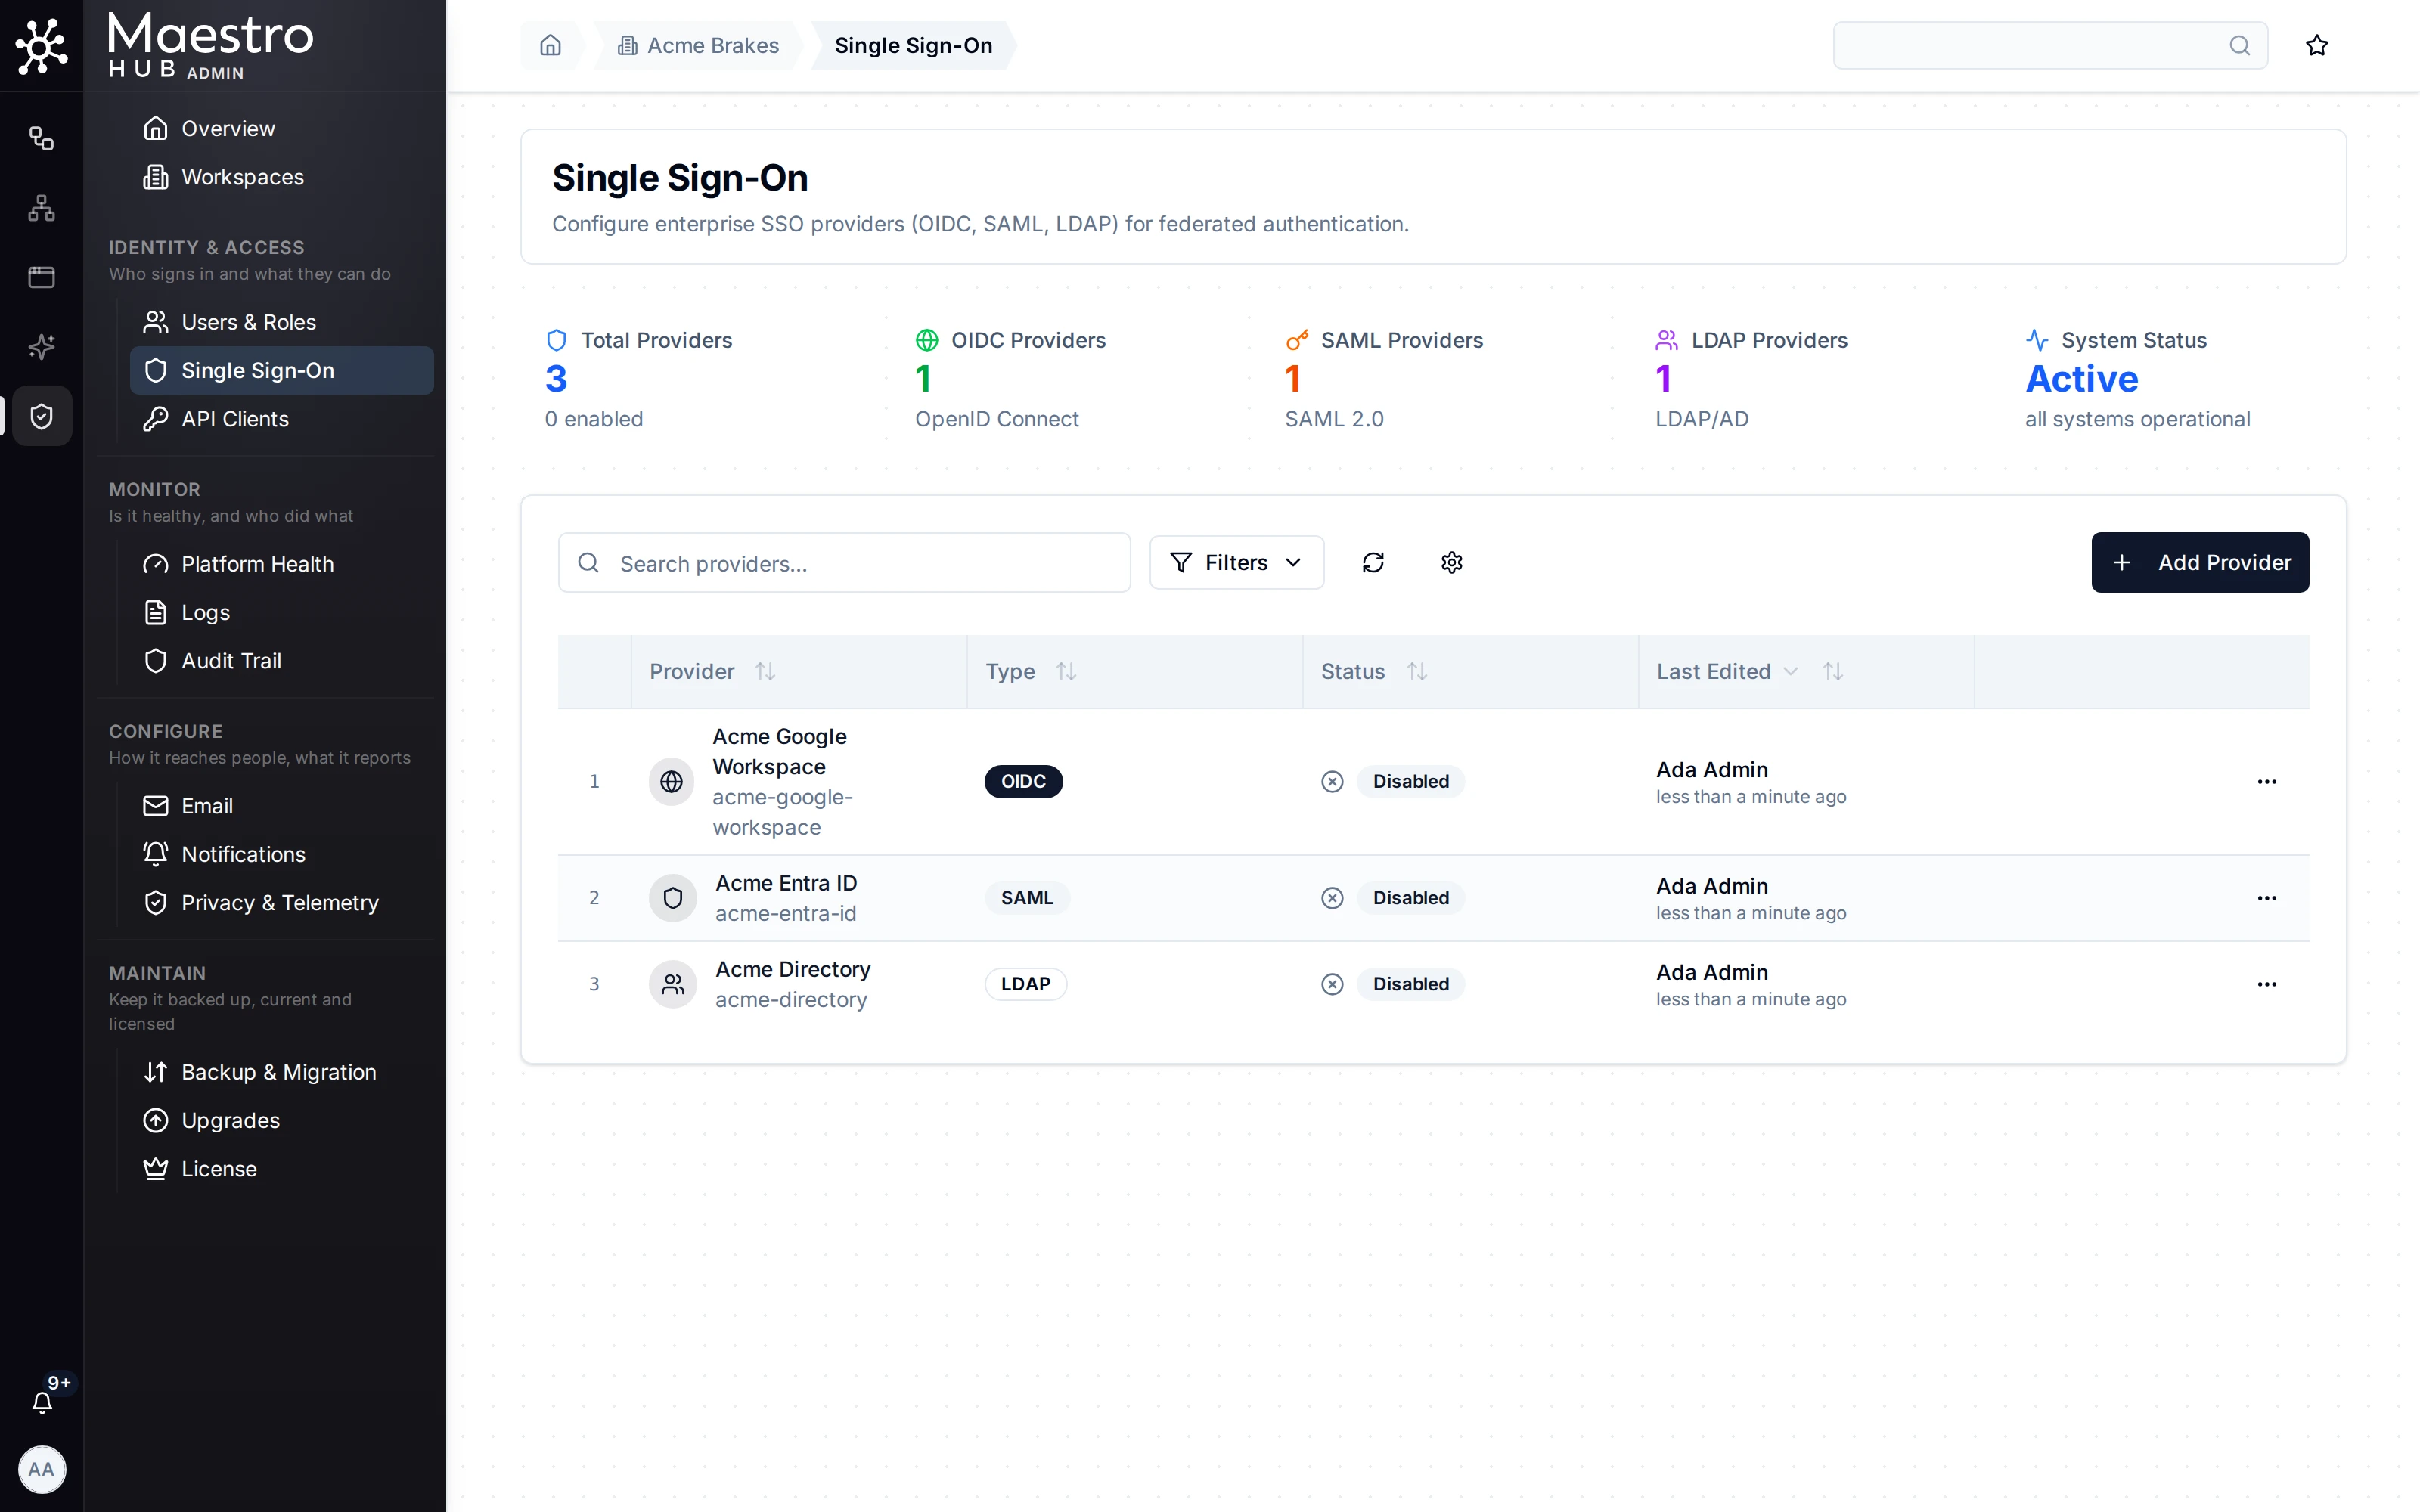
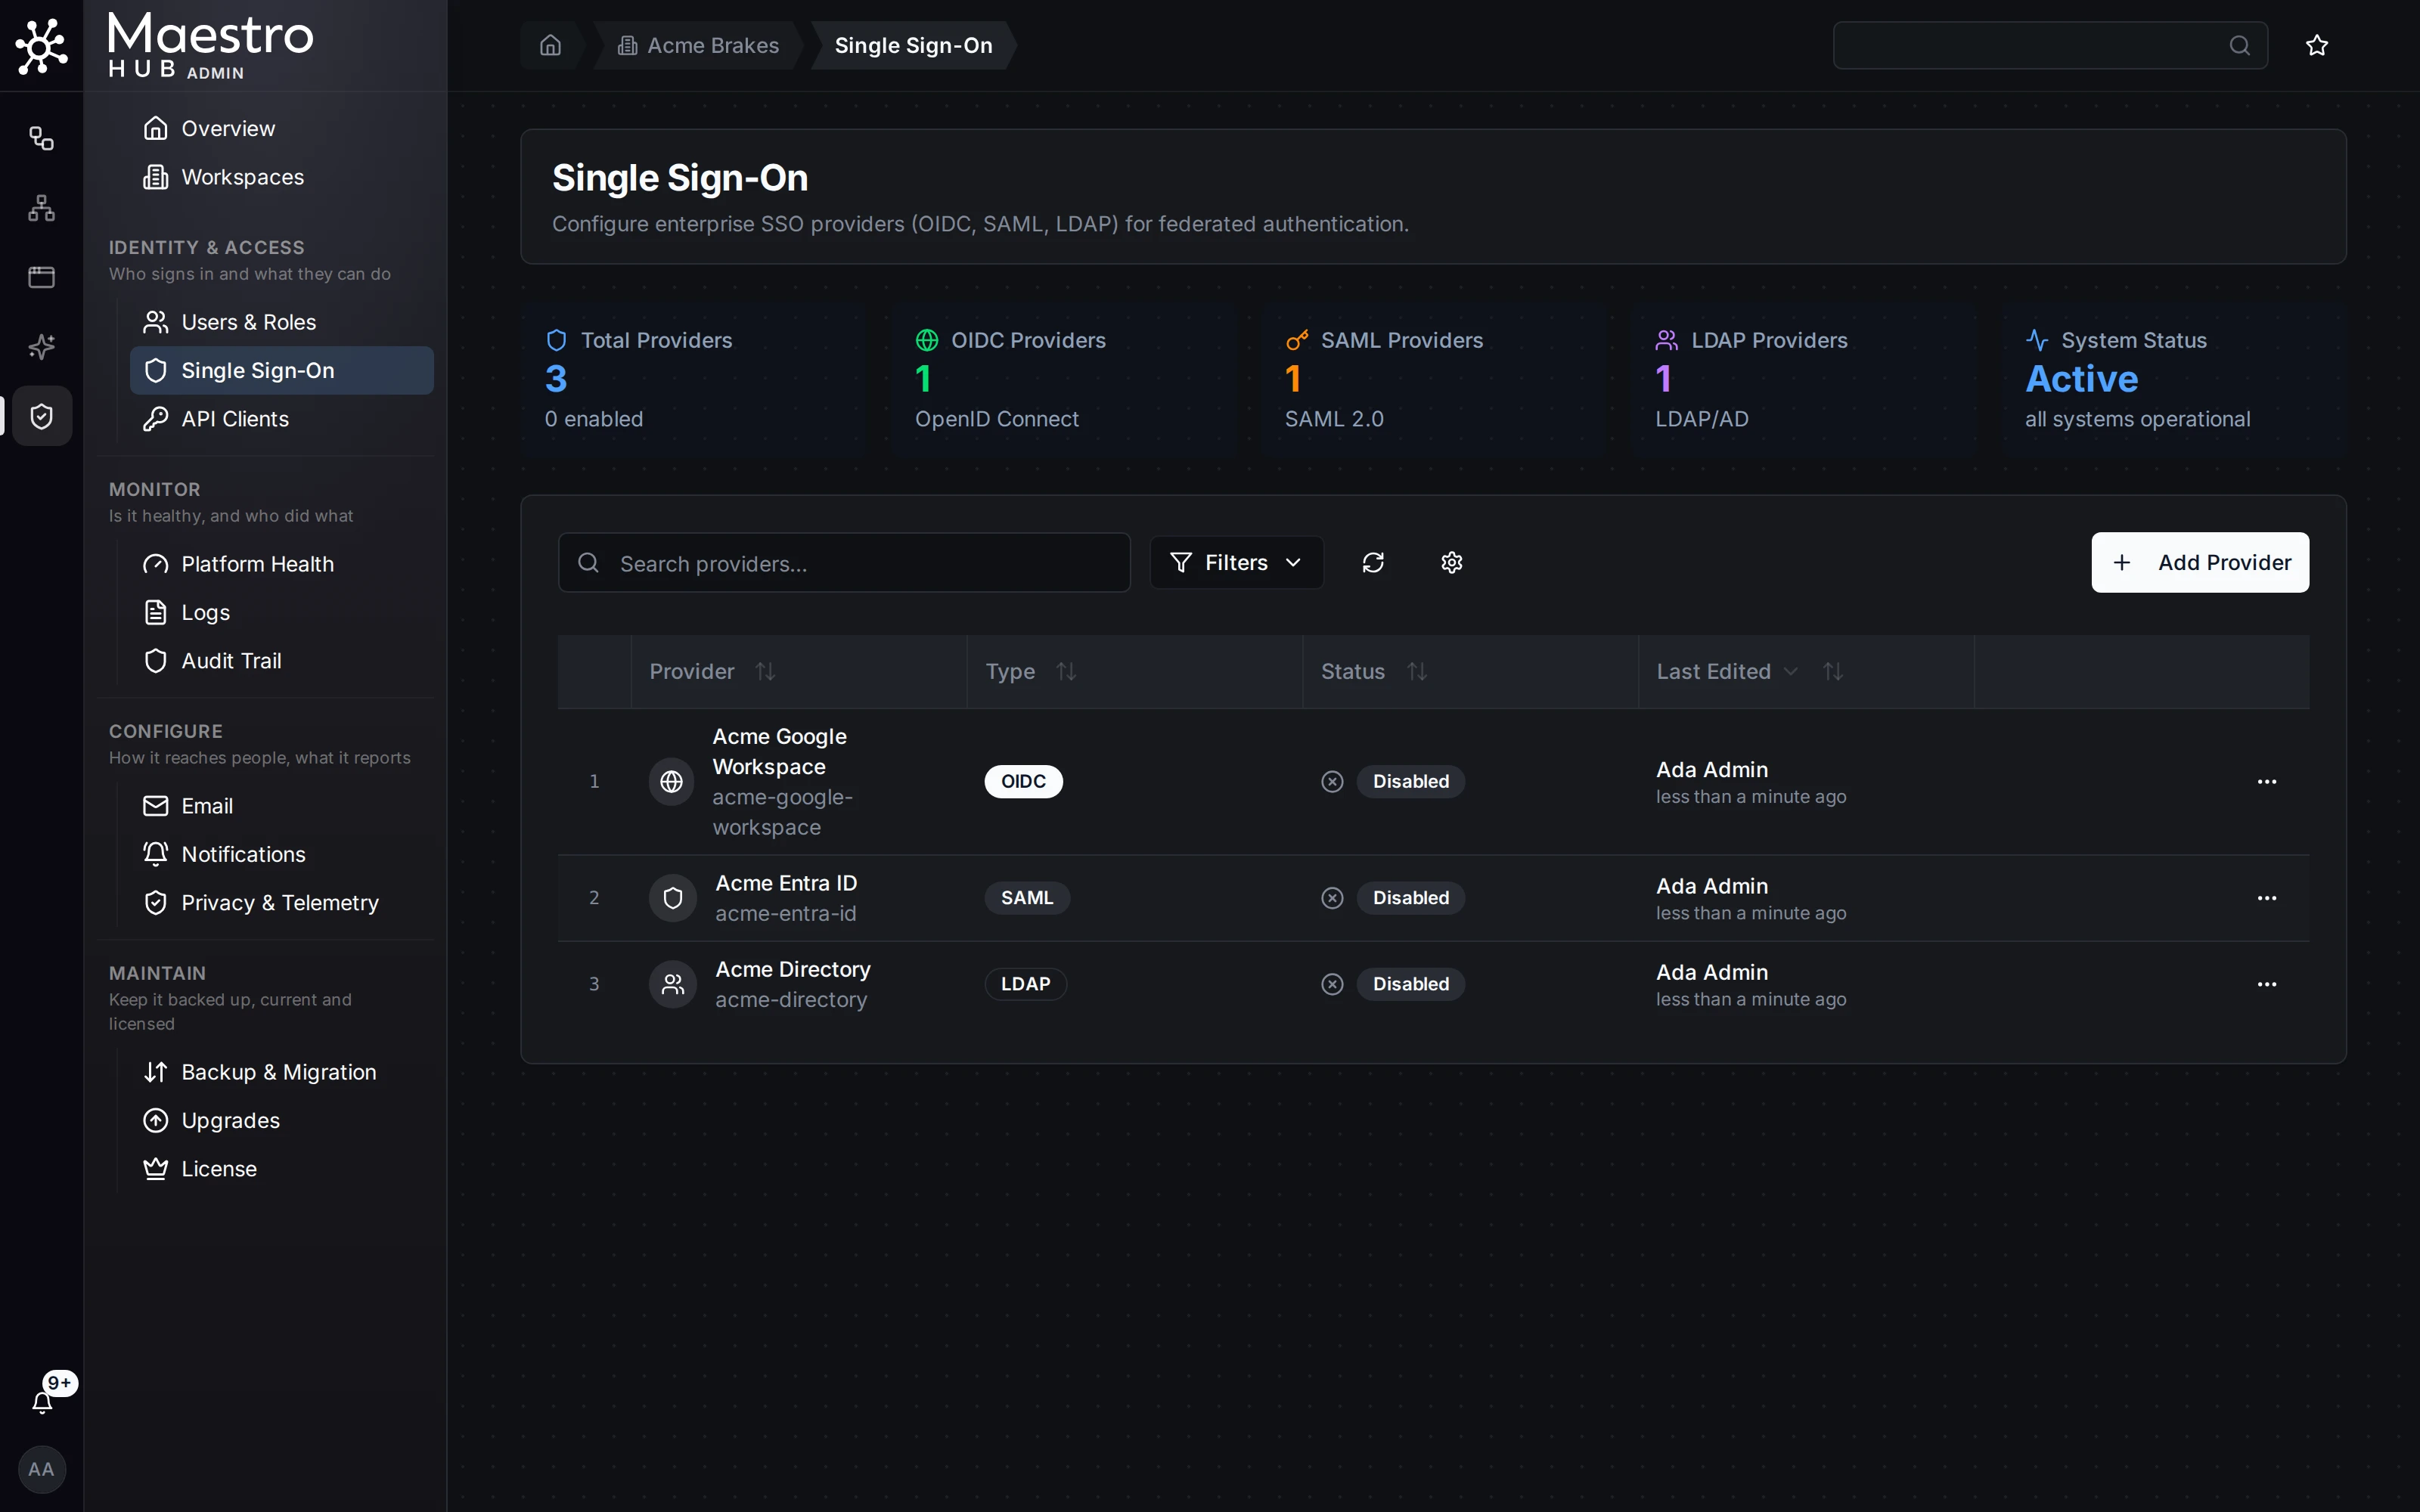
Connect an identity provider (Azure AD, Okta, Google Workspace, Keycloak) via SAML 2.0 or OIDC so users log in with corporate credentials.
SSO Provider List
Admin › Identity & Access › Single Sign-On lists the identity providers people can sign in with, with a count per type above the table.
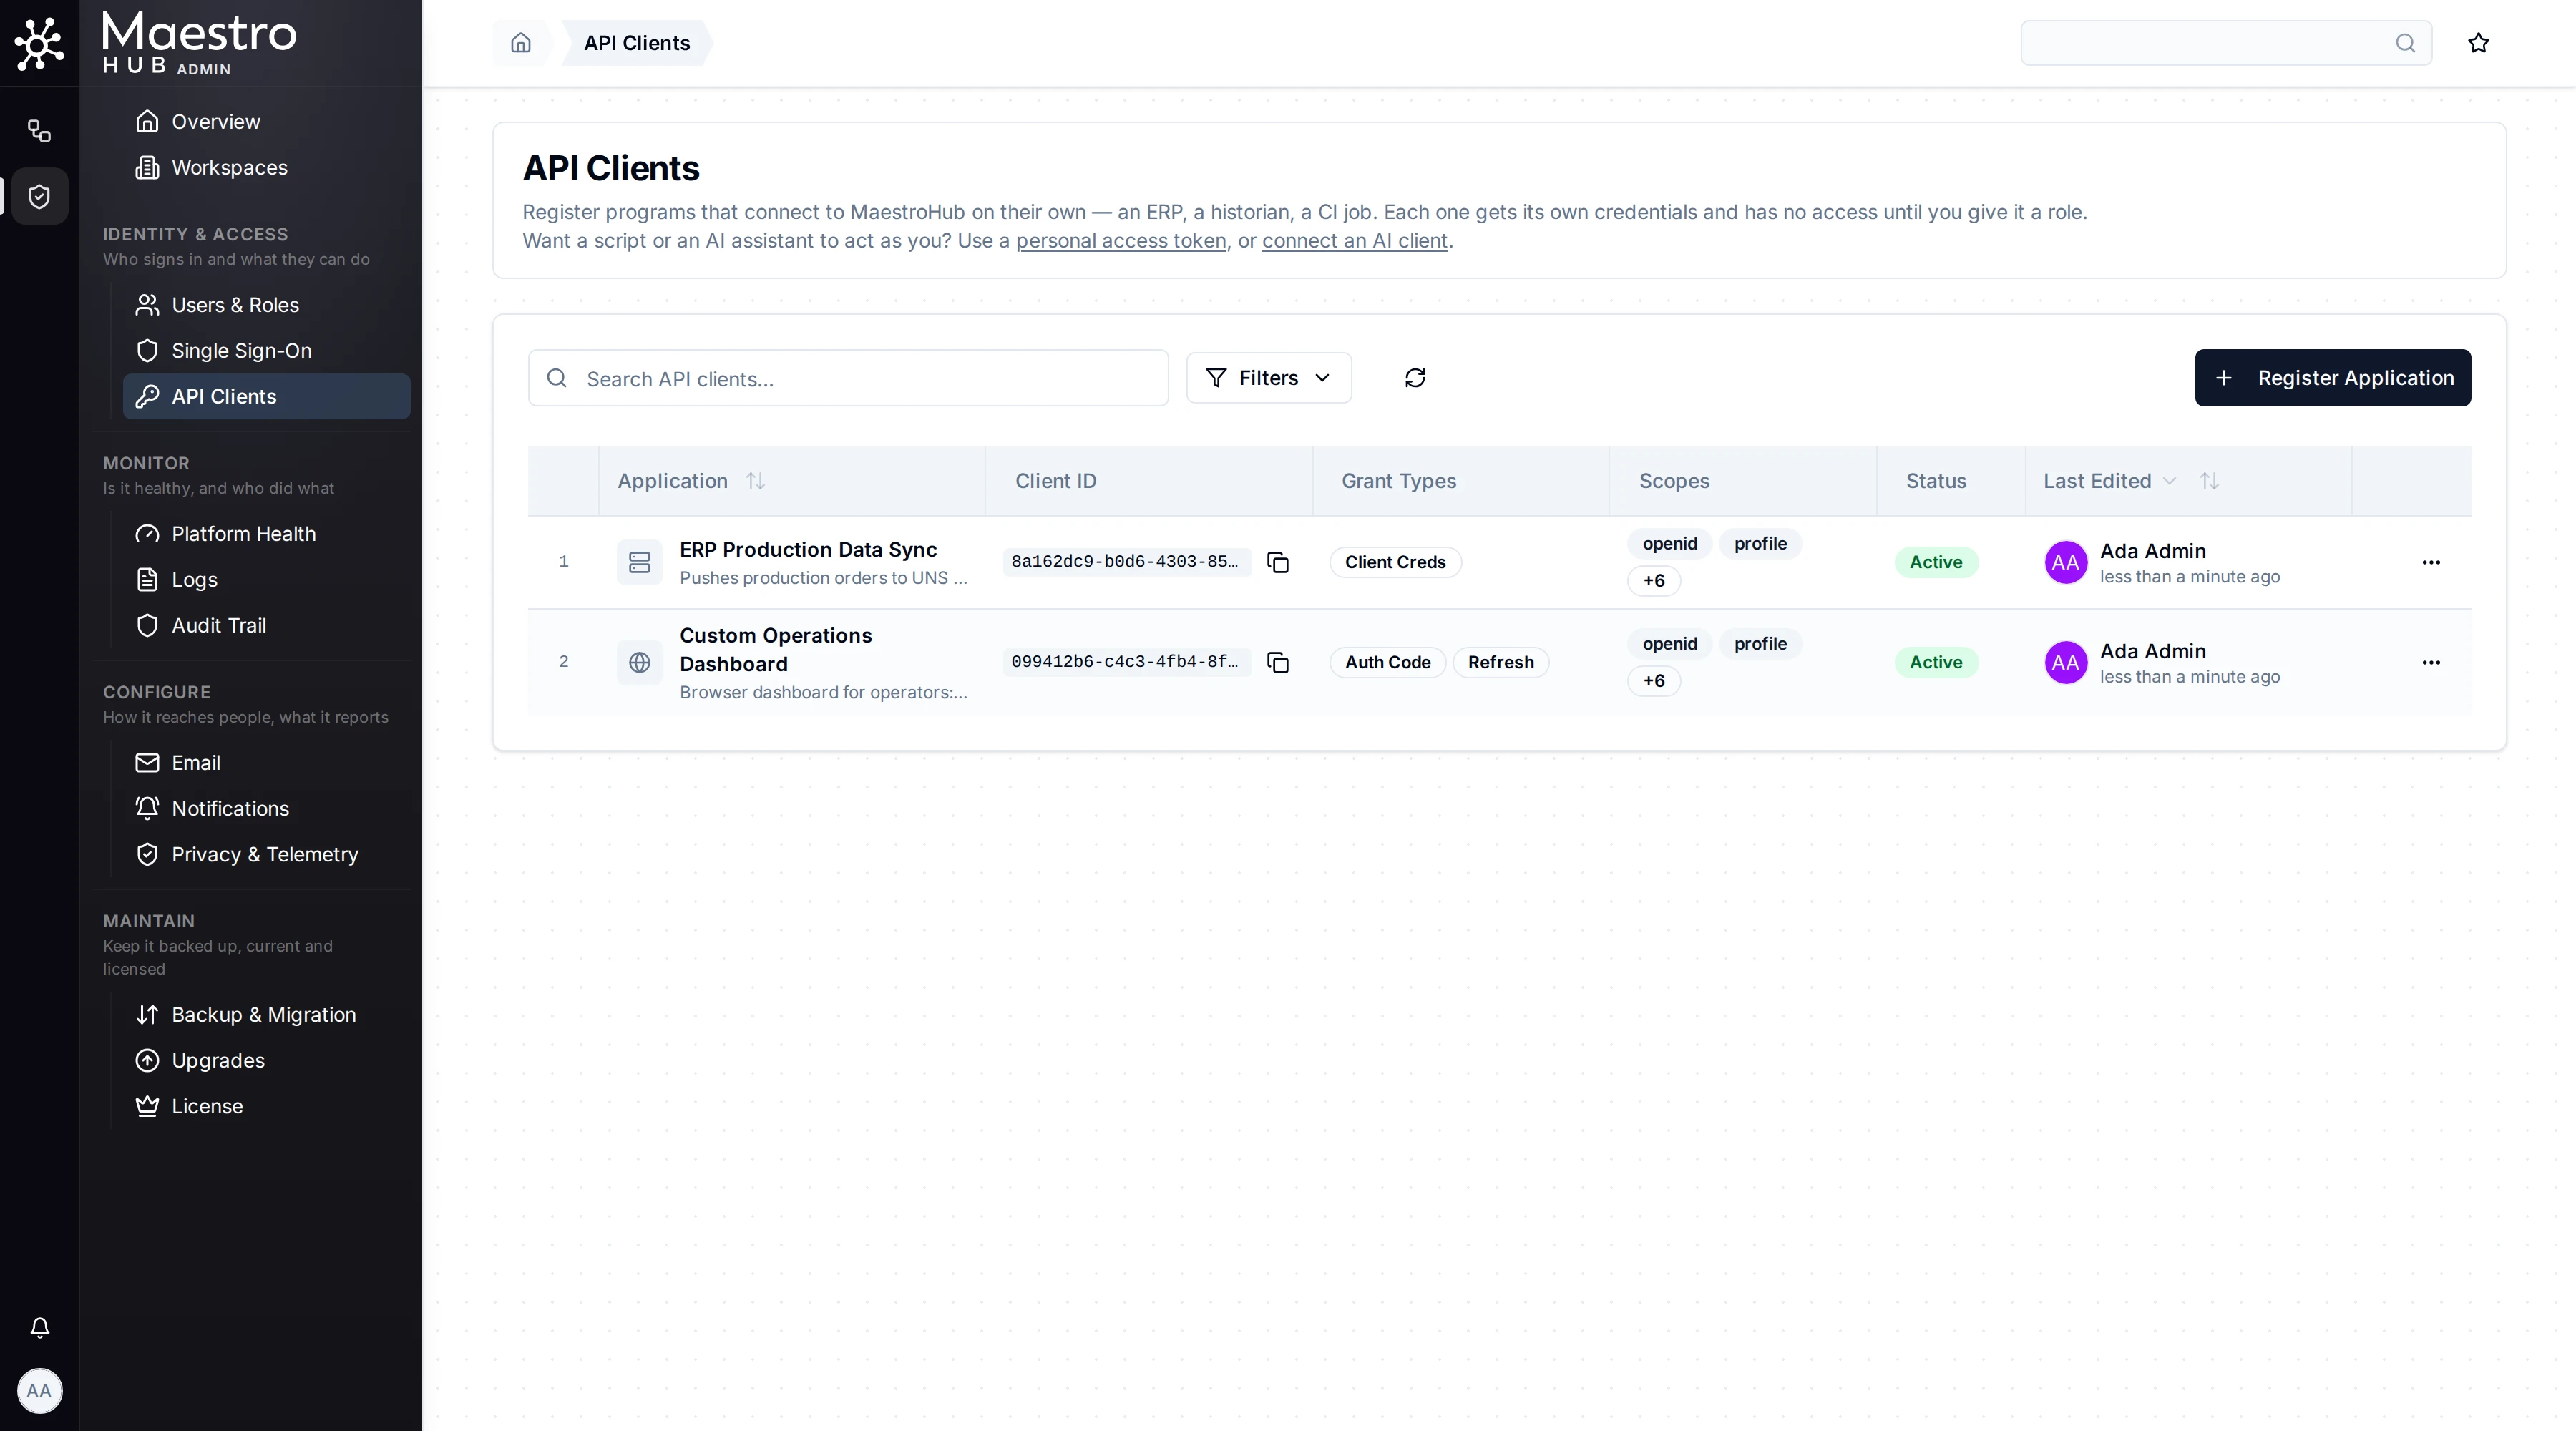
API Clients
Register OAuth2 applications for machine-to-machine access and create Personal Access Tokens for developer tooling and MCP integrations.
Browse Registered API Clients
Admin › Identity & Access › API Clients lists the external applications registered in this workspace that call MaestroHub's API through OAuth2.