Welcome. Let's build your first factory together.
You don't need a factory, a PLC or any experience with MaestroHub. We'll go one small step at a time, and we'll tell you what you should see after each one.
By the end you'll have a whole simulated production line streaming into MaestroHub, and a machine you connected, a pipeline you built and a dashboard you made, all live.
- You need
- A computer. No hardware.
- Time
- About 30 minutes
- First live data
- In step 3
- Prefer an AI assistant?
- Jump to the end
Here's where you're going
This is what you'll have on your screen in about ten minutes: a live OEE dashboard for a four-station brake caliper line, fed by real industrial protocols.
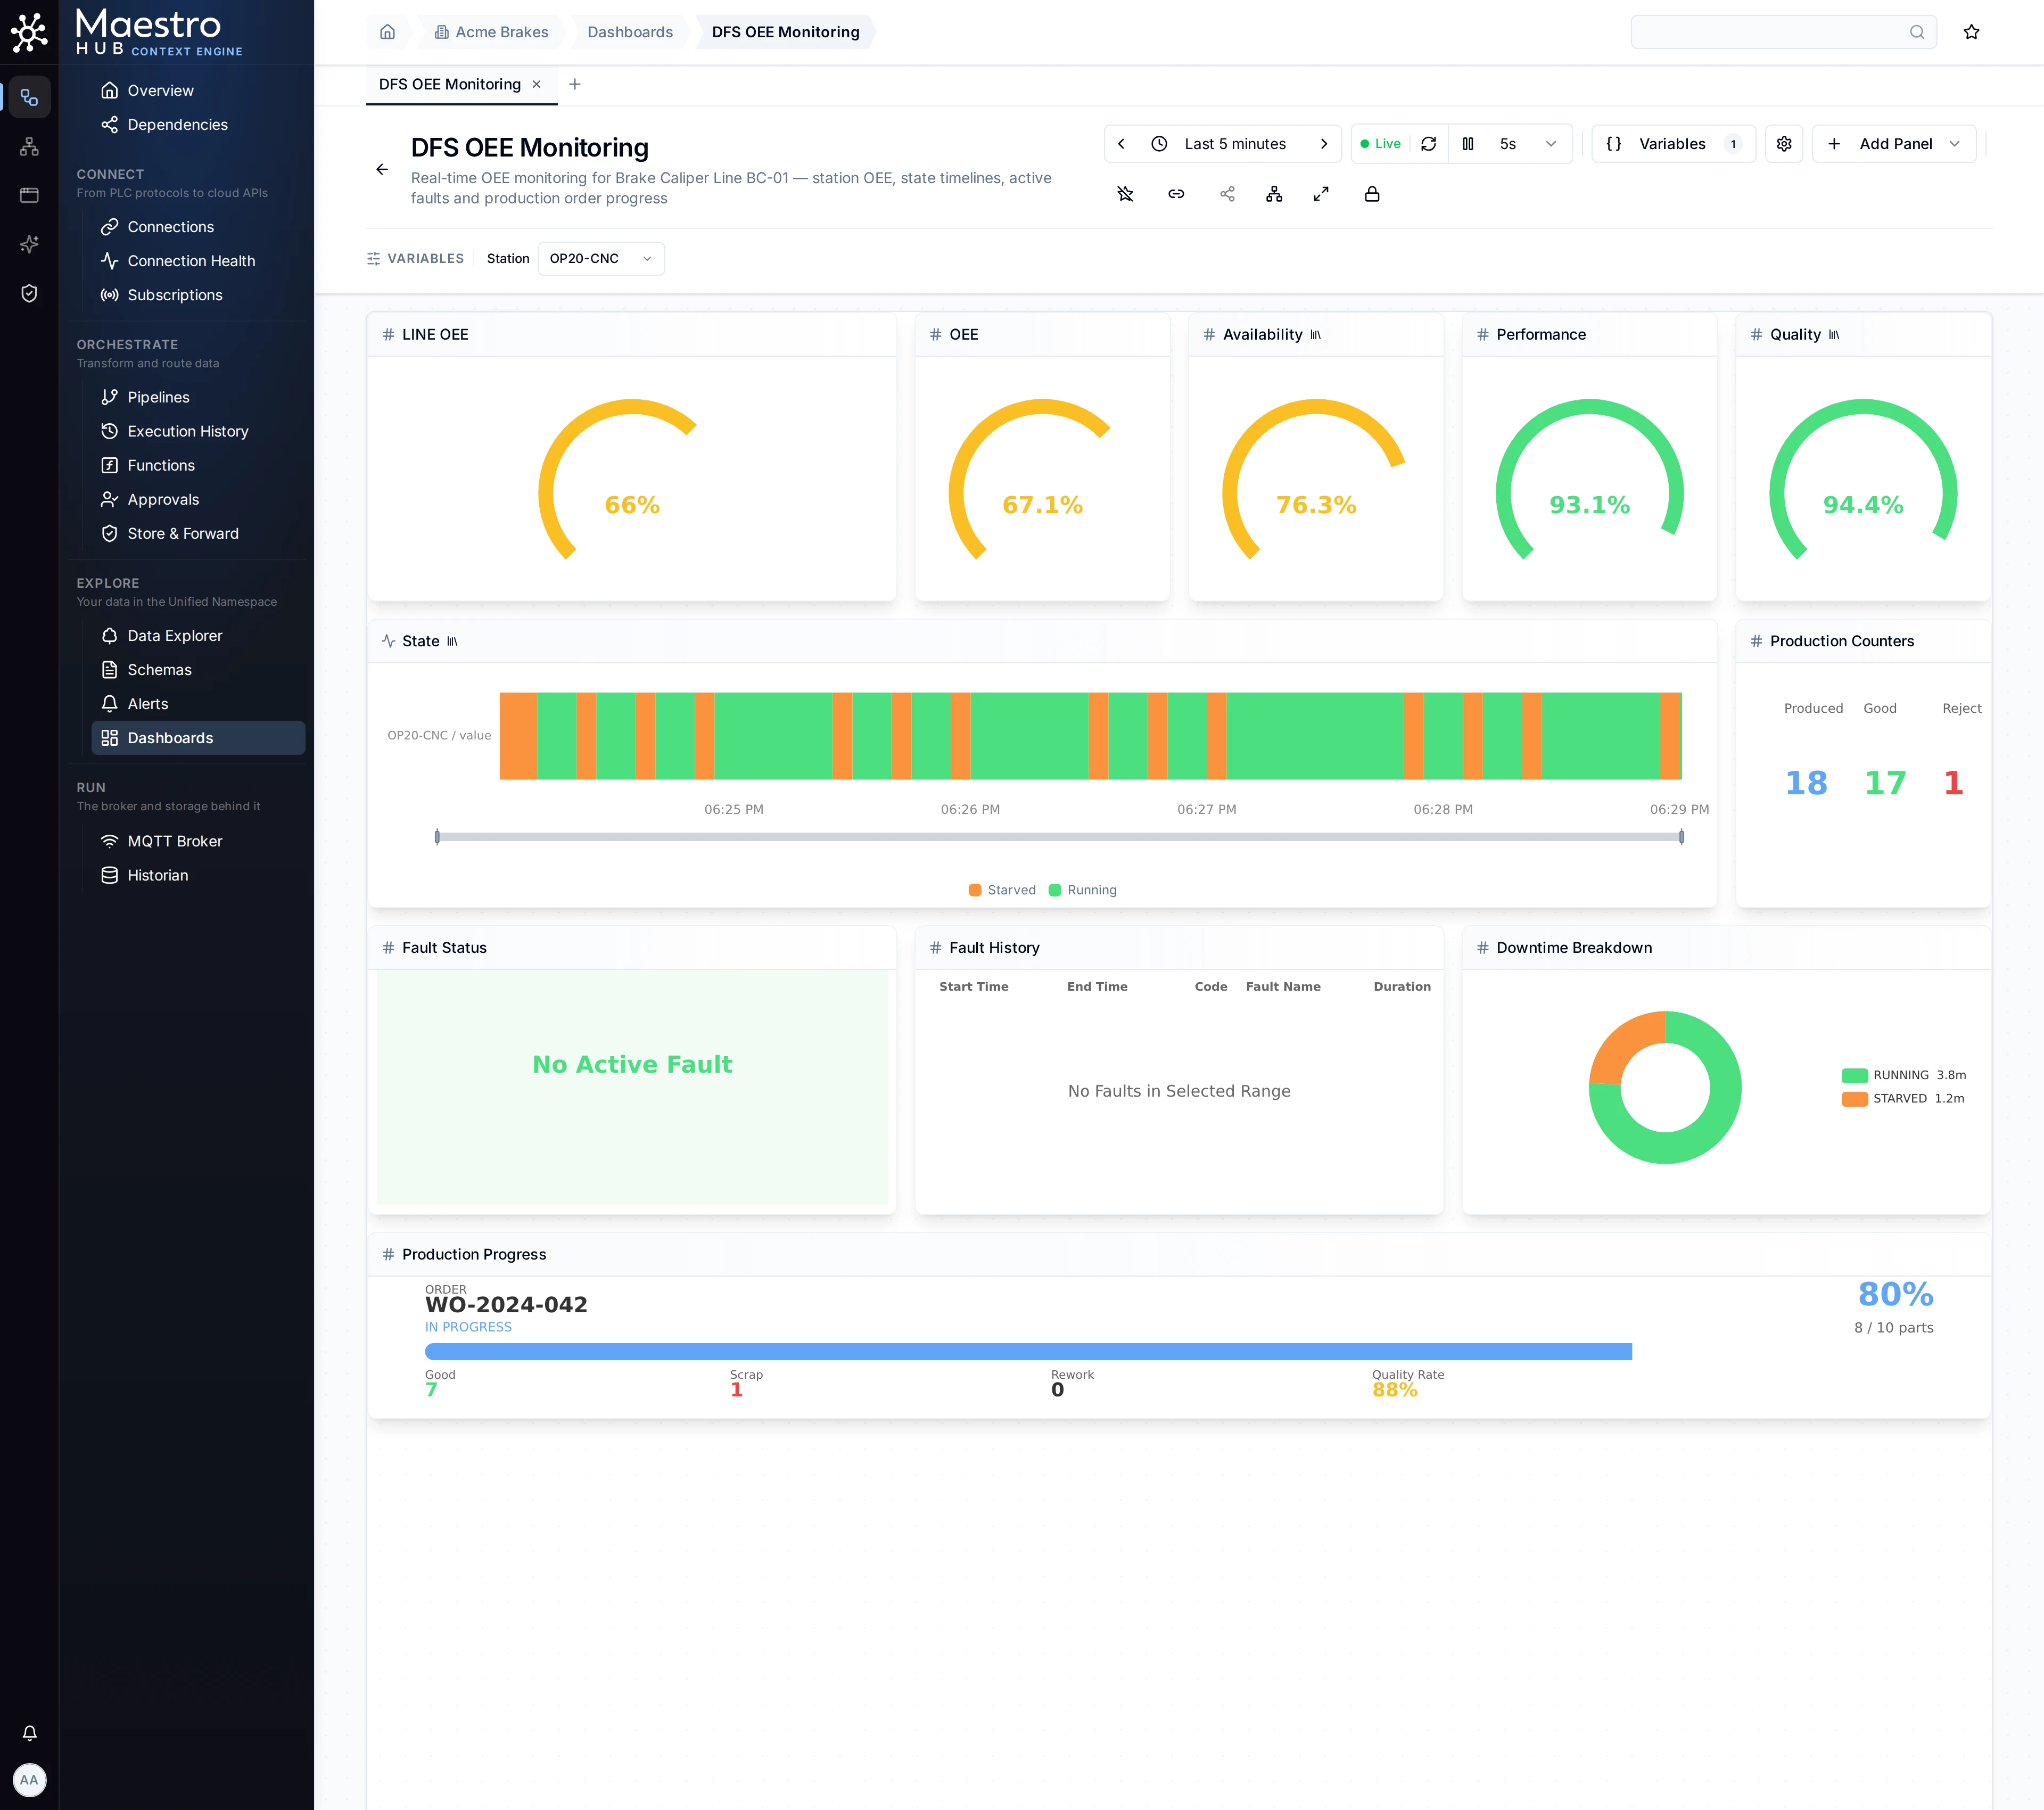
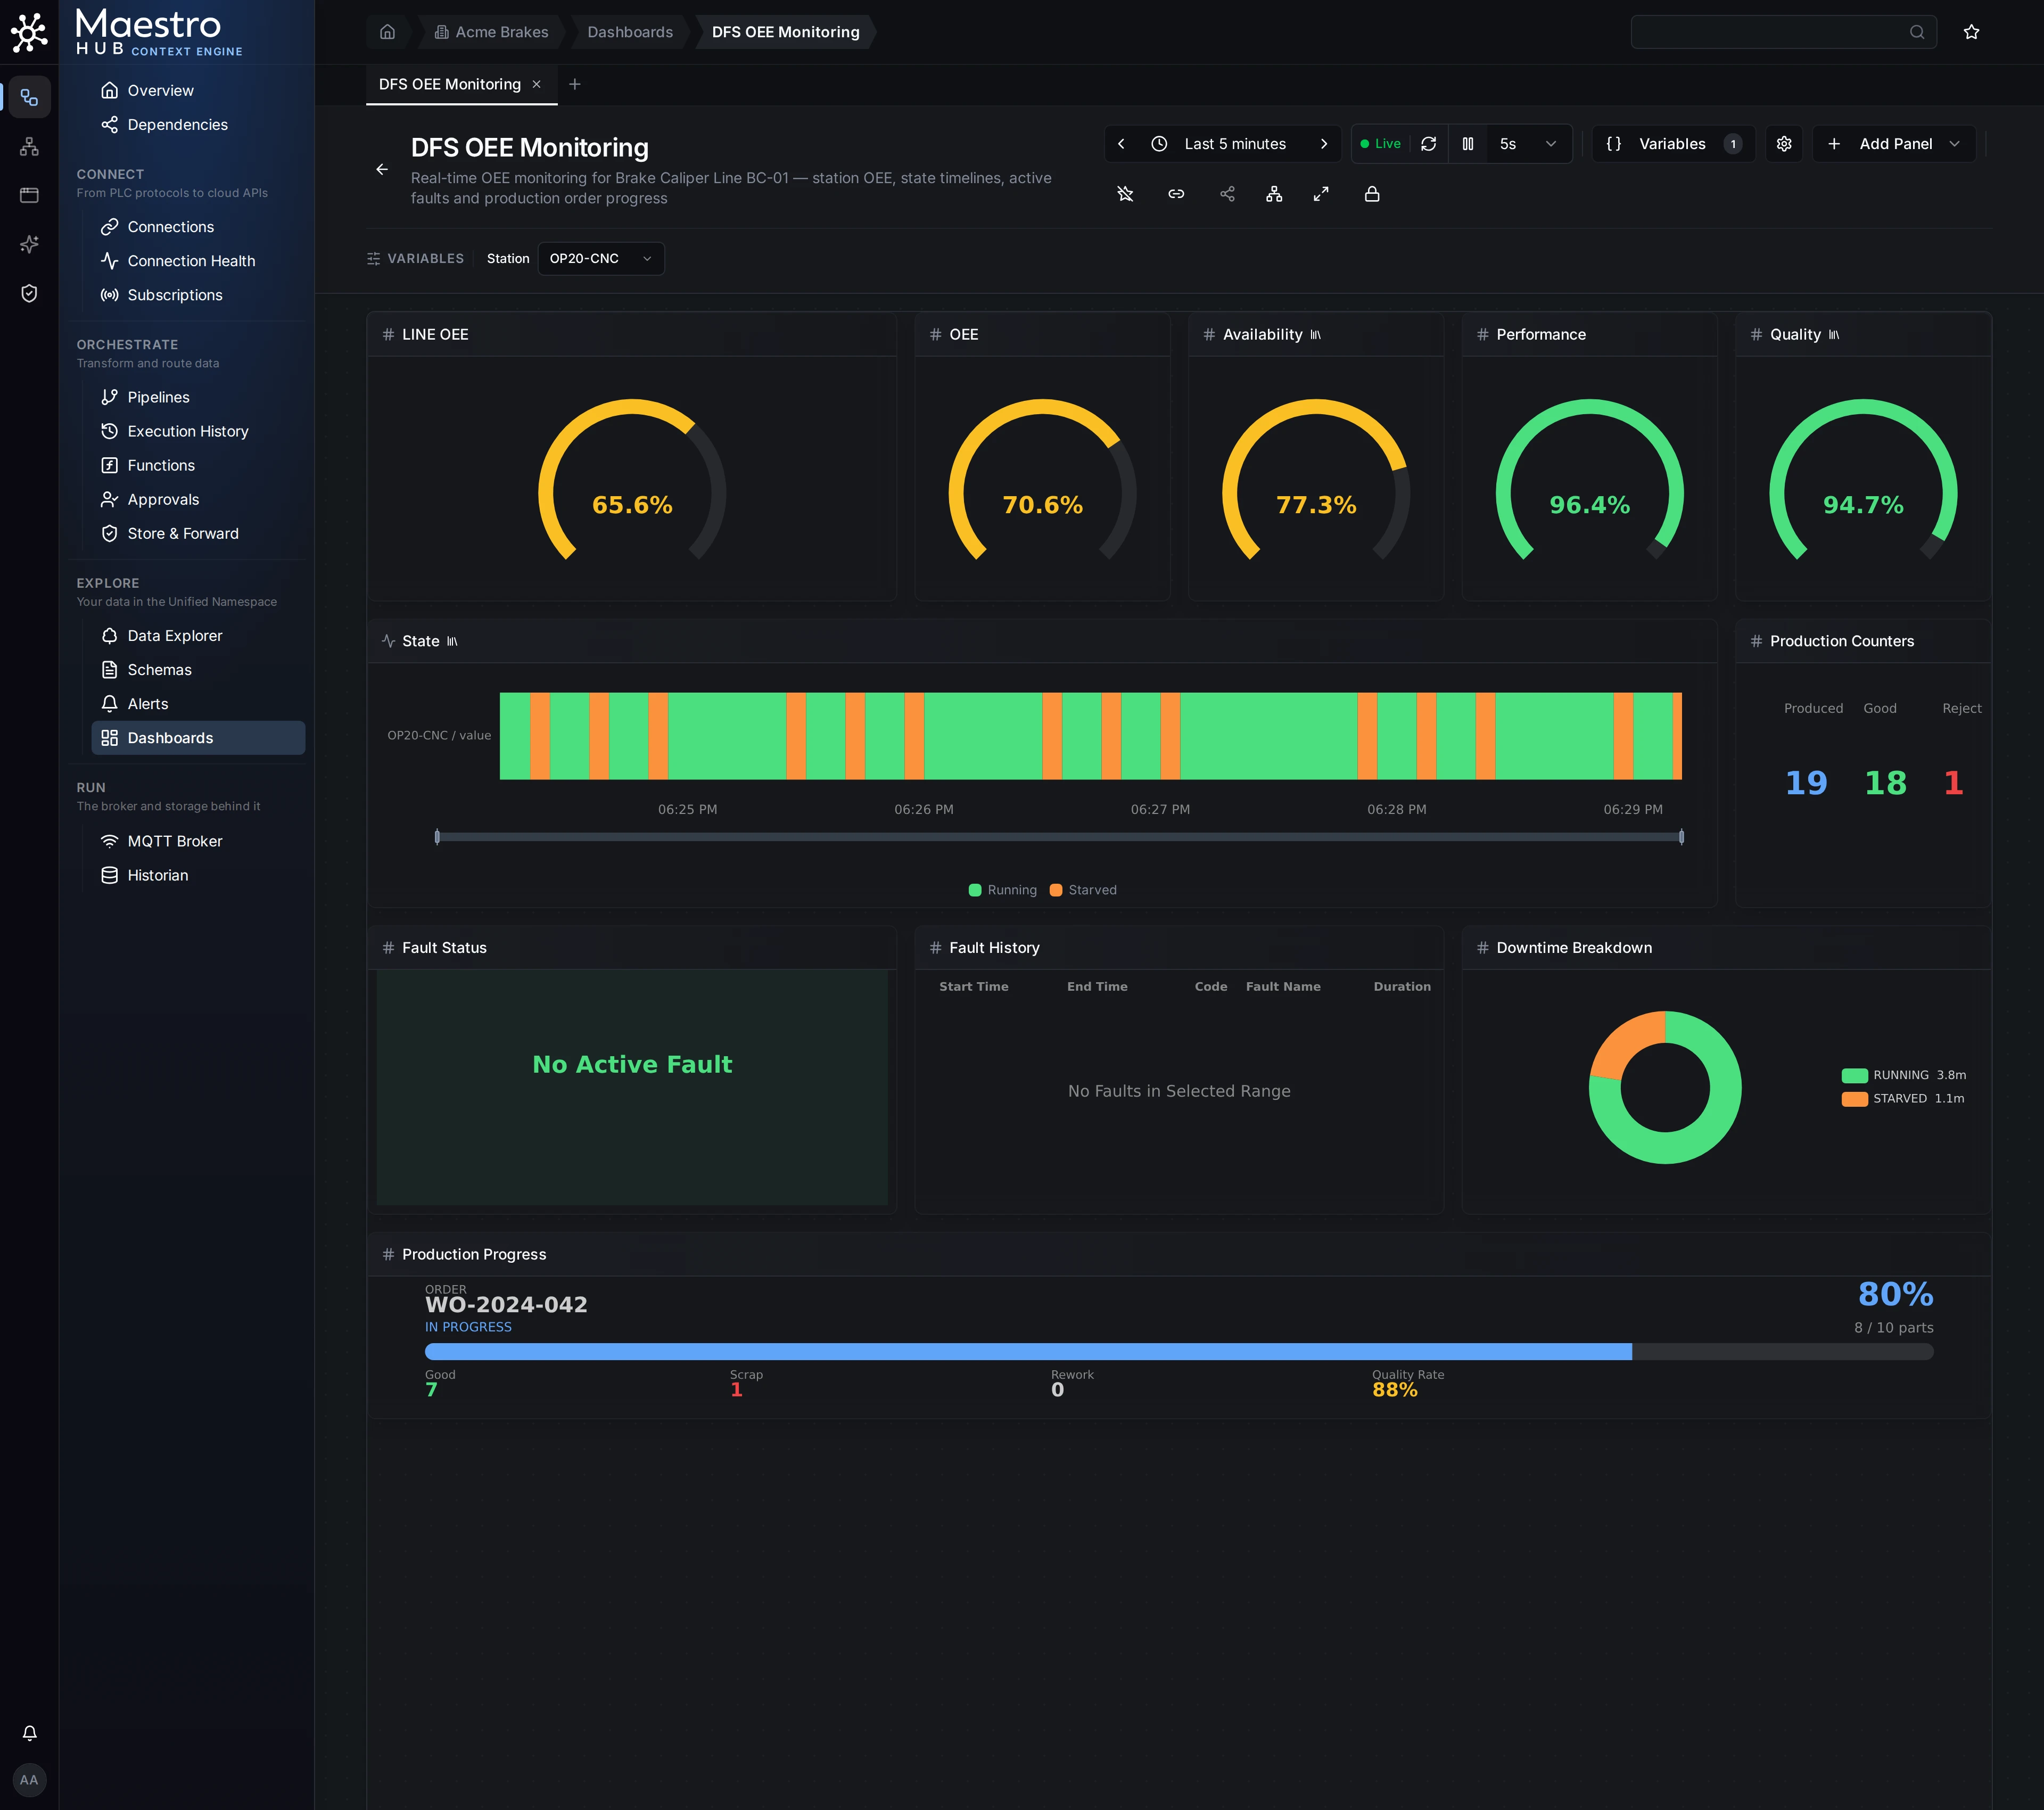
The DFS OEE Monitoring dashboard. It comes with the simulator's file, which you'll import in step 3.
Along the way you will:
- Start MaestroHub on your own machine. One download, nothing else to install.
- Start the Digital Factory Simulator, a pretend factory that speaks OPC UA, Modbus, MQTT and REST, just like a real one.
- Bring the whole factory in with one file. Nine connections, eight pipelines, three dashboards. You'll watch it come alive.
- Make it yours. Connect one machine by hand, read its values, build a pipeline and a dashboard. This is the part you'll use every day.
You can. MaestroHub works with Claude, Cursor, VS Code and other assistants. Do steps 1 and 2 here, then jump to Do it with an agent at the end of this page.
Start MaestroHub
Download MaestroHub for your computer from the MaestroHub Portal, unpack it, and start it:
- Windows
- macOS
- Linux
Extract the ZIP, open the context-platform_3.0.0_windows_amd64 folder and double-click starter.bat.
tar -xzf context-platform_*_darwin_arm64.tar.gz
cd context-platform_*_darwin_arm64
./context-platform
If macOS says the app is from an unidentified developer, open System Settings › Privacy & Security, find MaestroHub in the Security section and click Open Anyway.
tar -xzf context-platform_*_linux_amd64.tar.gz
cd context-platform_*_linux_amd64
./context-platform
On ARM64 (a Raspberry Pi 4 or 5, AWS Graviton), the file names end in linux_arm64 instead.
Your browser opens at http://localhost:6163 and asks you to create the first account. Enter your name, email and a password. This account is the administrator, so keep the password somewhere safe.
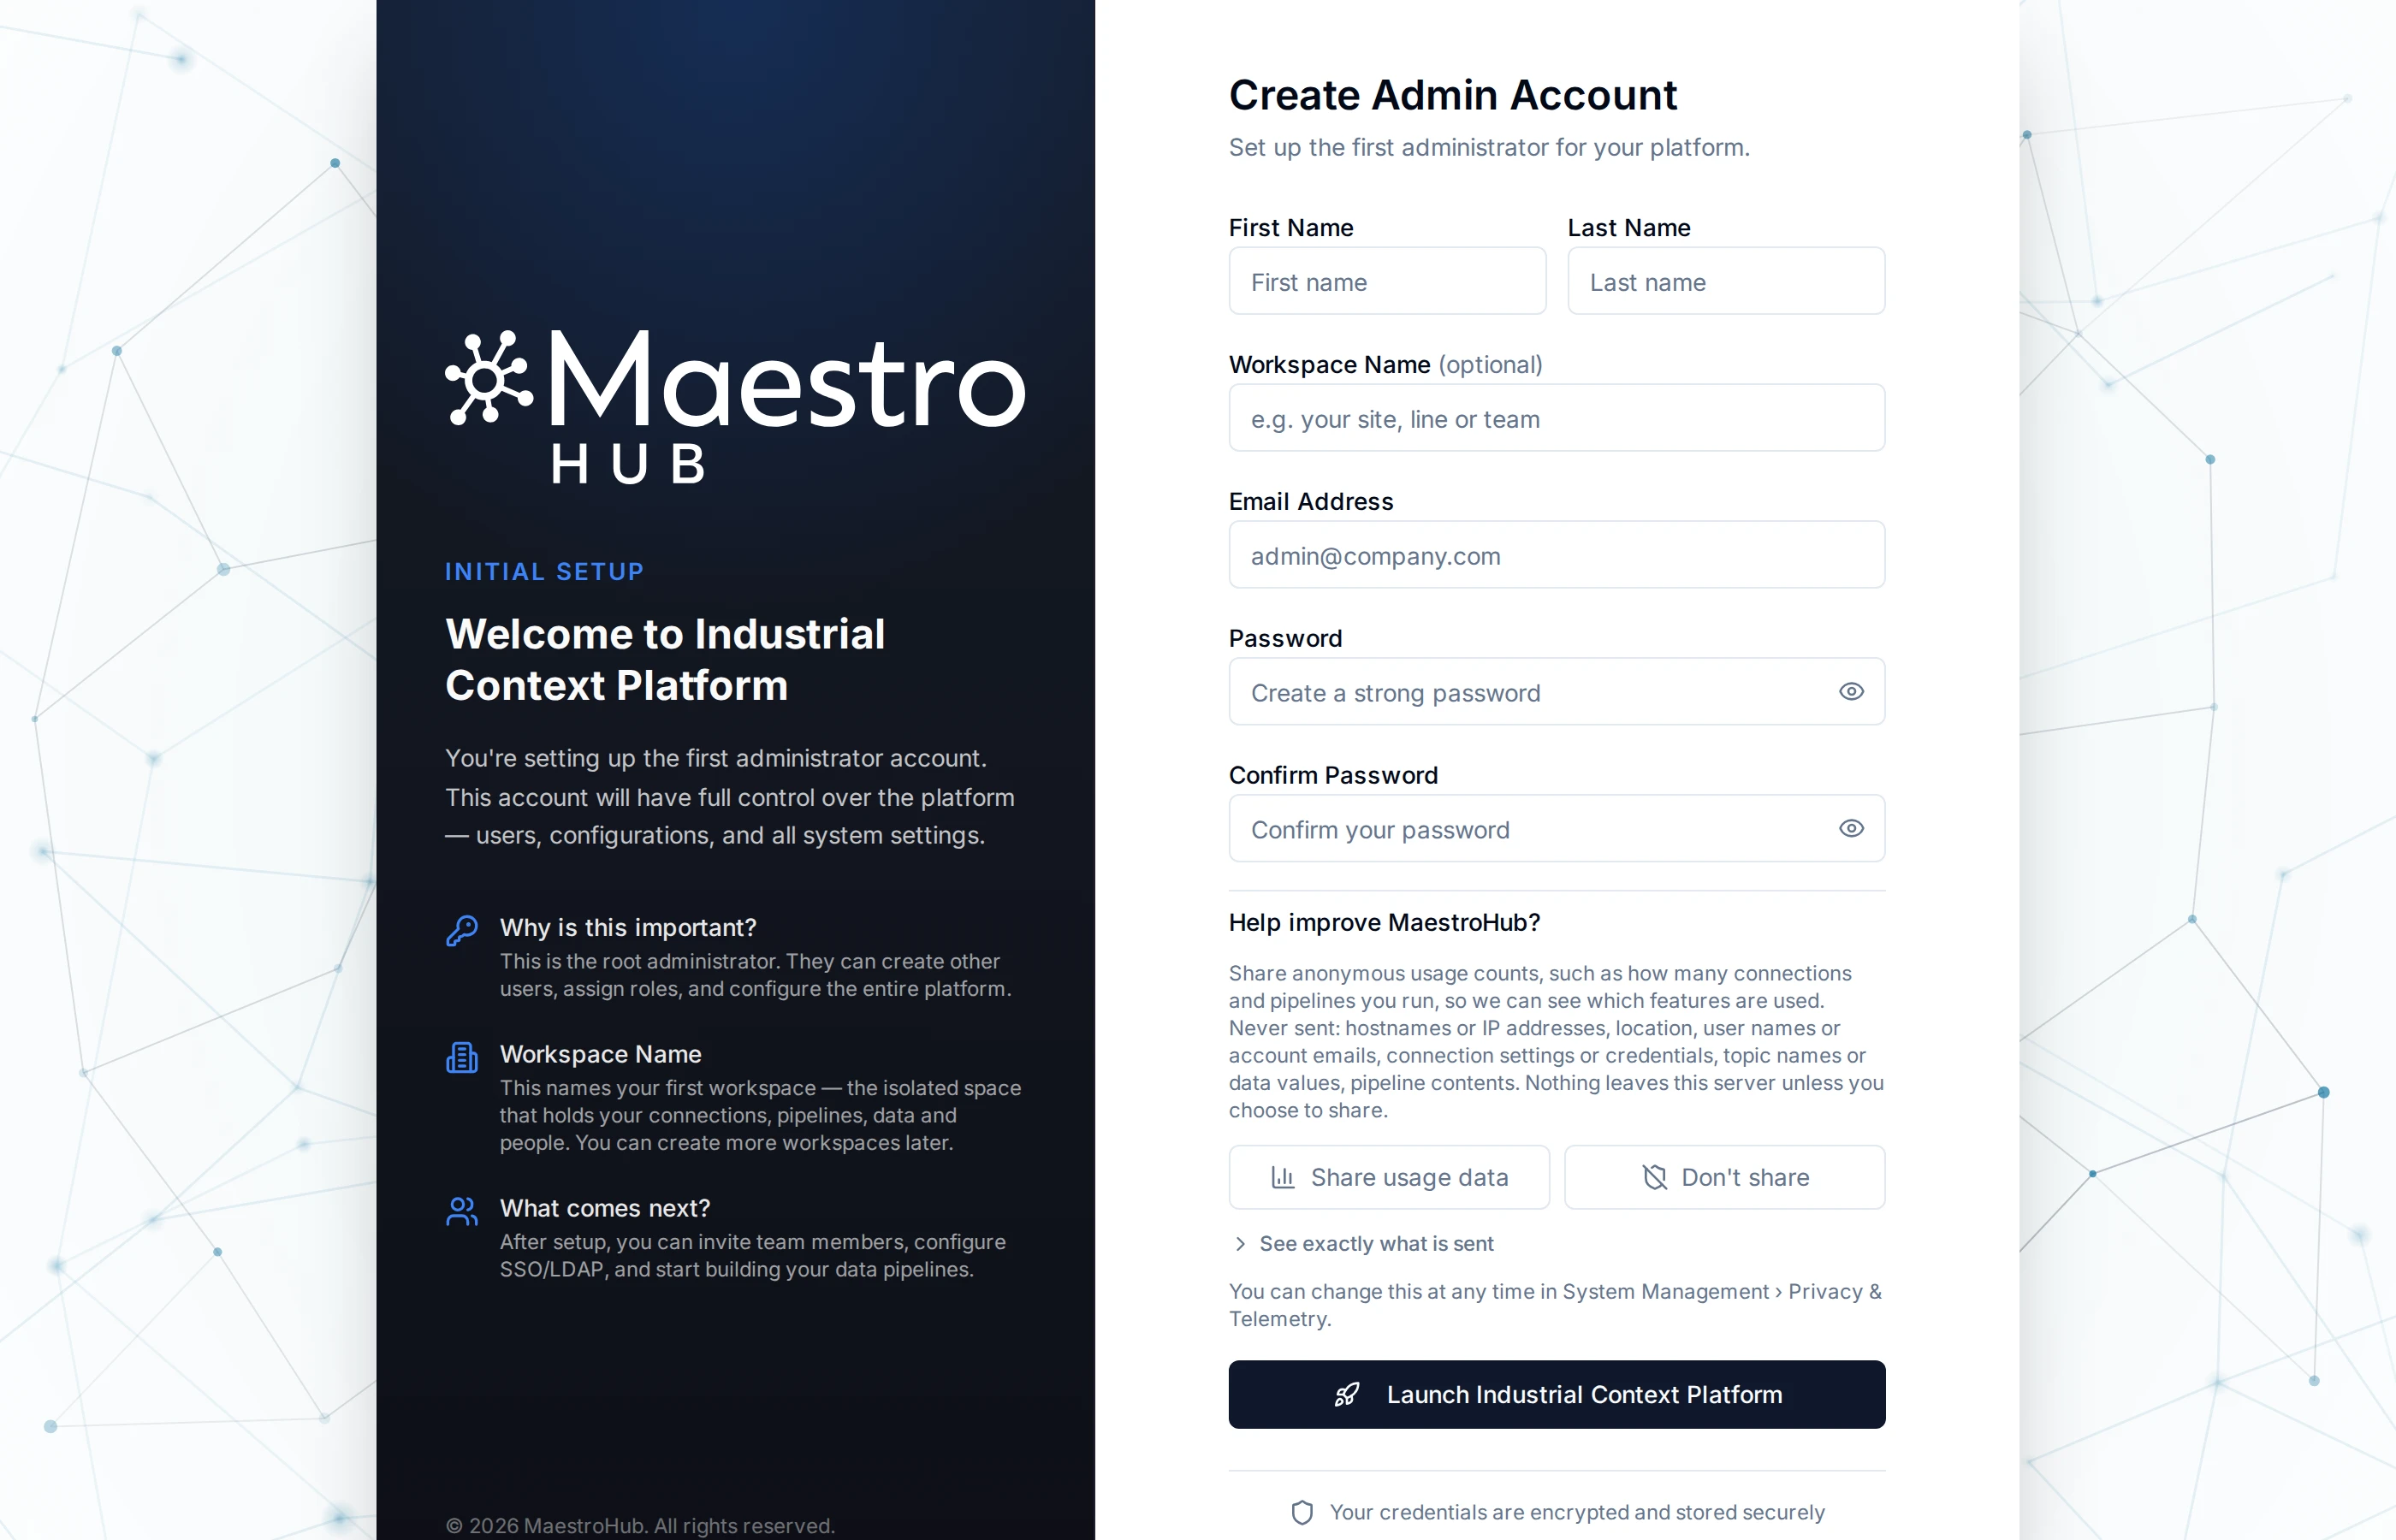
The first launch asks for one thing: your administrator account.
You'll know it worked when you're signed in and looking at your workspace's Overview. MaestroHub made that workspace for you.
Prefer Docker?
Download the Docker image for your architecture from the MaestroHub Portal, then:
unzip context-platform_3.0.0_docker_amd64.zip
docker load -i context-platform-amd/context-platform-amd64.tar.gz
docker volume create maestrohub-data
docker run -d --name maestrohub \
  -p 8080:8080 -p 1883:1883 -p 8083:8083 \
  -v maestrohub-data:/data \
  maestrohub/context-platform:3.0.0
On Apple Silicon, use the docker_arm64 zip and context-platform-arm/context-platform-arm64.tar.gz. Then open http://localhost:8080. Port 1883 is the MQTT broker and 8083 is MQTT over WebSocket.
Docker Compose, configuration and day-to-day commands are in Install and run.
Start the simulator
The Digital Factory Simulator plays the part of your factory: four stations making brake calipers, plus an MES, an ERP and a database. Download it from the MaestroHub Portal and start it:
- Windows
- macOS
- Linux
Extract the ZIP and double-click factory-launcher.exe.
tar -xzf factory-launcher_*_darwin_arm64.tar.gz
cd factory-launcher_*_darwin_arm64
./factory-launcher
tar -xzf factory-launcher_*_linux_amd64.tar.gz
cd factory-launcher_*_linux_amd64
chmod +x factory-launcher
./factory-launcher
You'll know it worked when a browser tab opens at http://localhost:13005 with the factory running in it. Leave it running; MaestroHub is about to talk to it.
Which address MaestroHub uses to reach the simulator
We'll call the simulator's address <DFS_HOST>. It depends on where each one runs:
| MaestroHub runs | The simulator runs | <DFS_HOST> |
|---|---|---|
| as a download, on this computer | on this computer | localhost |
| in Docker | on this computer | host.docker.internal |
| in the MaestroHub + DFS stack bundle | in the same bundle | digital-factory |
If you followed steps 1 and 2 as written, it's localhost and you don't need to do anything.
If MaestroHub runs in Docker, start the simulator with the variable MHUB_EXPORT_HOST set to host.docker.internal, so the file you download in the next step points at the right place. On macOS or Linux: MHUB_EXPORT_HOST=host.docker.internal ./factory-launcher. On Windows, in PowerShell: $env:MHUB_EXPORT_HOST="host.docker.internal"; .\factory-launcher.exe.
Bring the factory in
This is the fun part. The simulator hands you one file that describes everything MaestroHub needs: how to reach every machine, what to read from each, where to put the values and how to show them. You import it, and the factory appears.
First, get the file. In the simulator's browser tab, click API Docs in the top menu (or open http://localhost:13005/api-docs). The first box on the page is MaestroHub Quick Setup. Click Download .mhub.json. Your browser saves dfs_api_endpoints.mhub.json.
Then, import it. In MaestroHub:
- Open Admin › Maintain › Backup & Migration and click Start import.
- Click Choose .mhub.json, pick the file you just downloaded, and choose the workspace to fill. Click Preview.
- Read the preview. It lists what's about to be created. Nothing has been written yet.
- Tick I understand what this will write. and click Import.
- When the result screen appears, click Done.
- Open Orchestrate › Pipelines. Click ⋯ at the end of any pipeline's row and choose Select. Checkboxes appear: tick the one at the top to select every pipeline, then click Enable (8).
Why that last step? Imported pipelines arrive switched off, on purpose. Nothing starts talking to your machines until you say so.
Click a numbered pin on each picture to see what that part does:
Open Backup & Migration
Admin › Maintain › Backup & Migration. This is the door for whole setups, in and out.
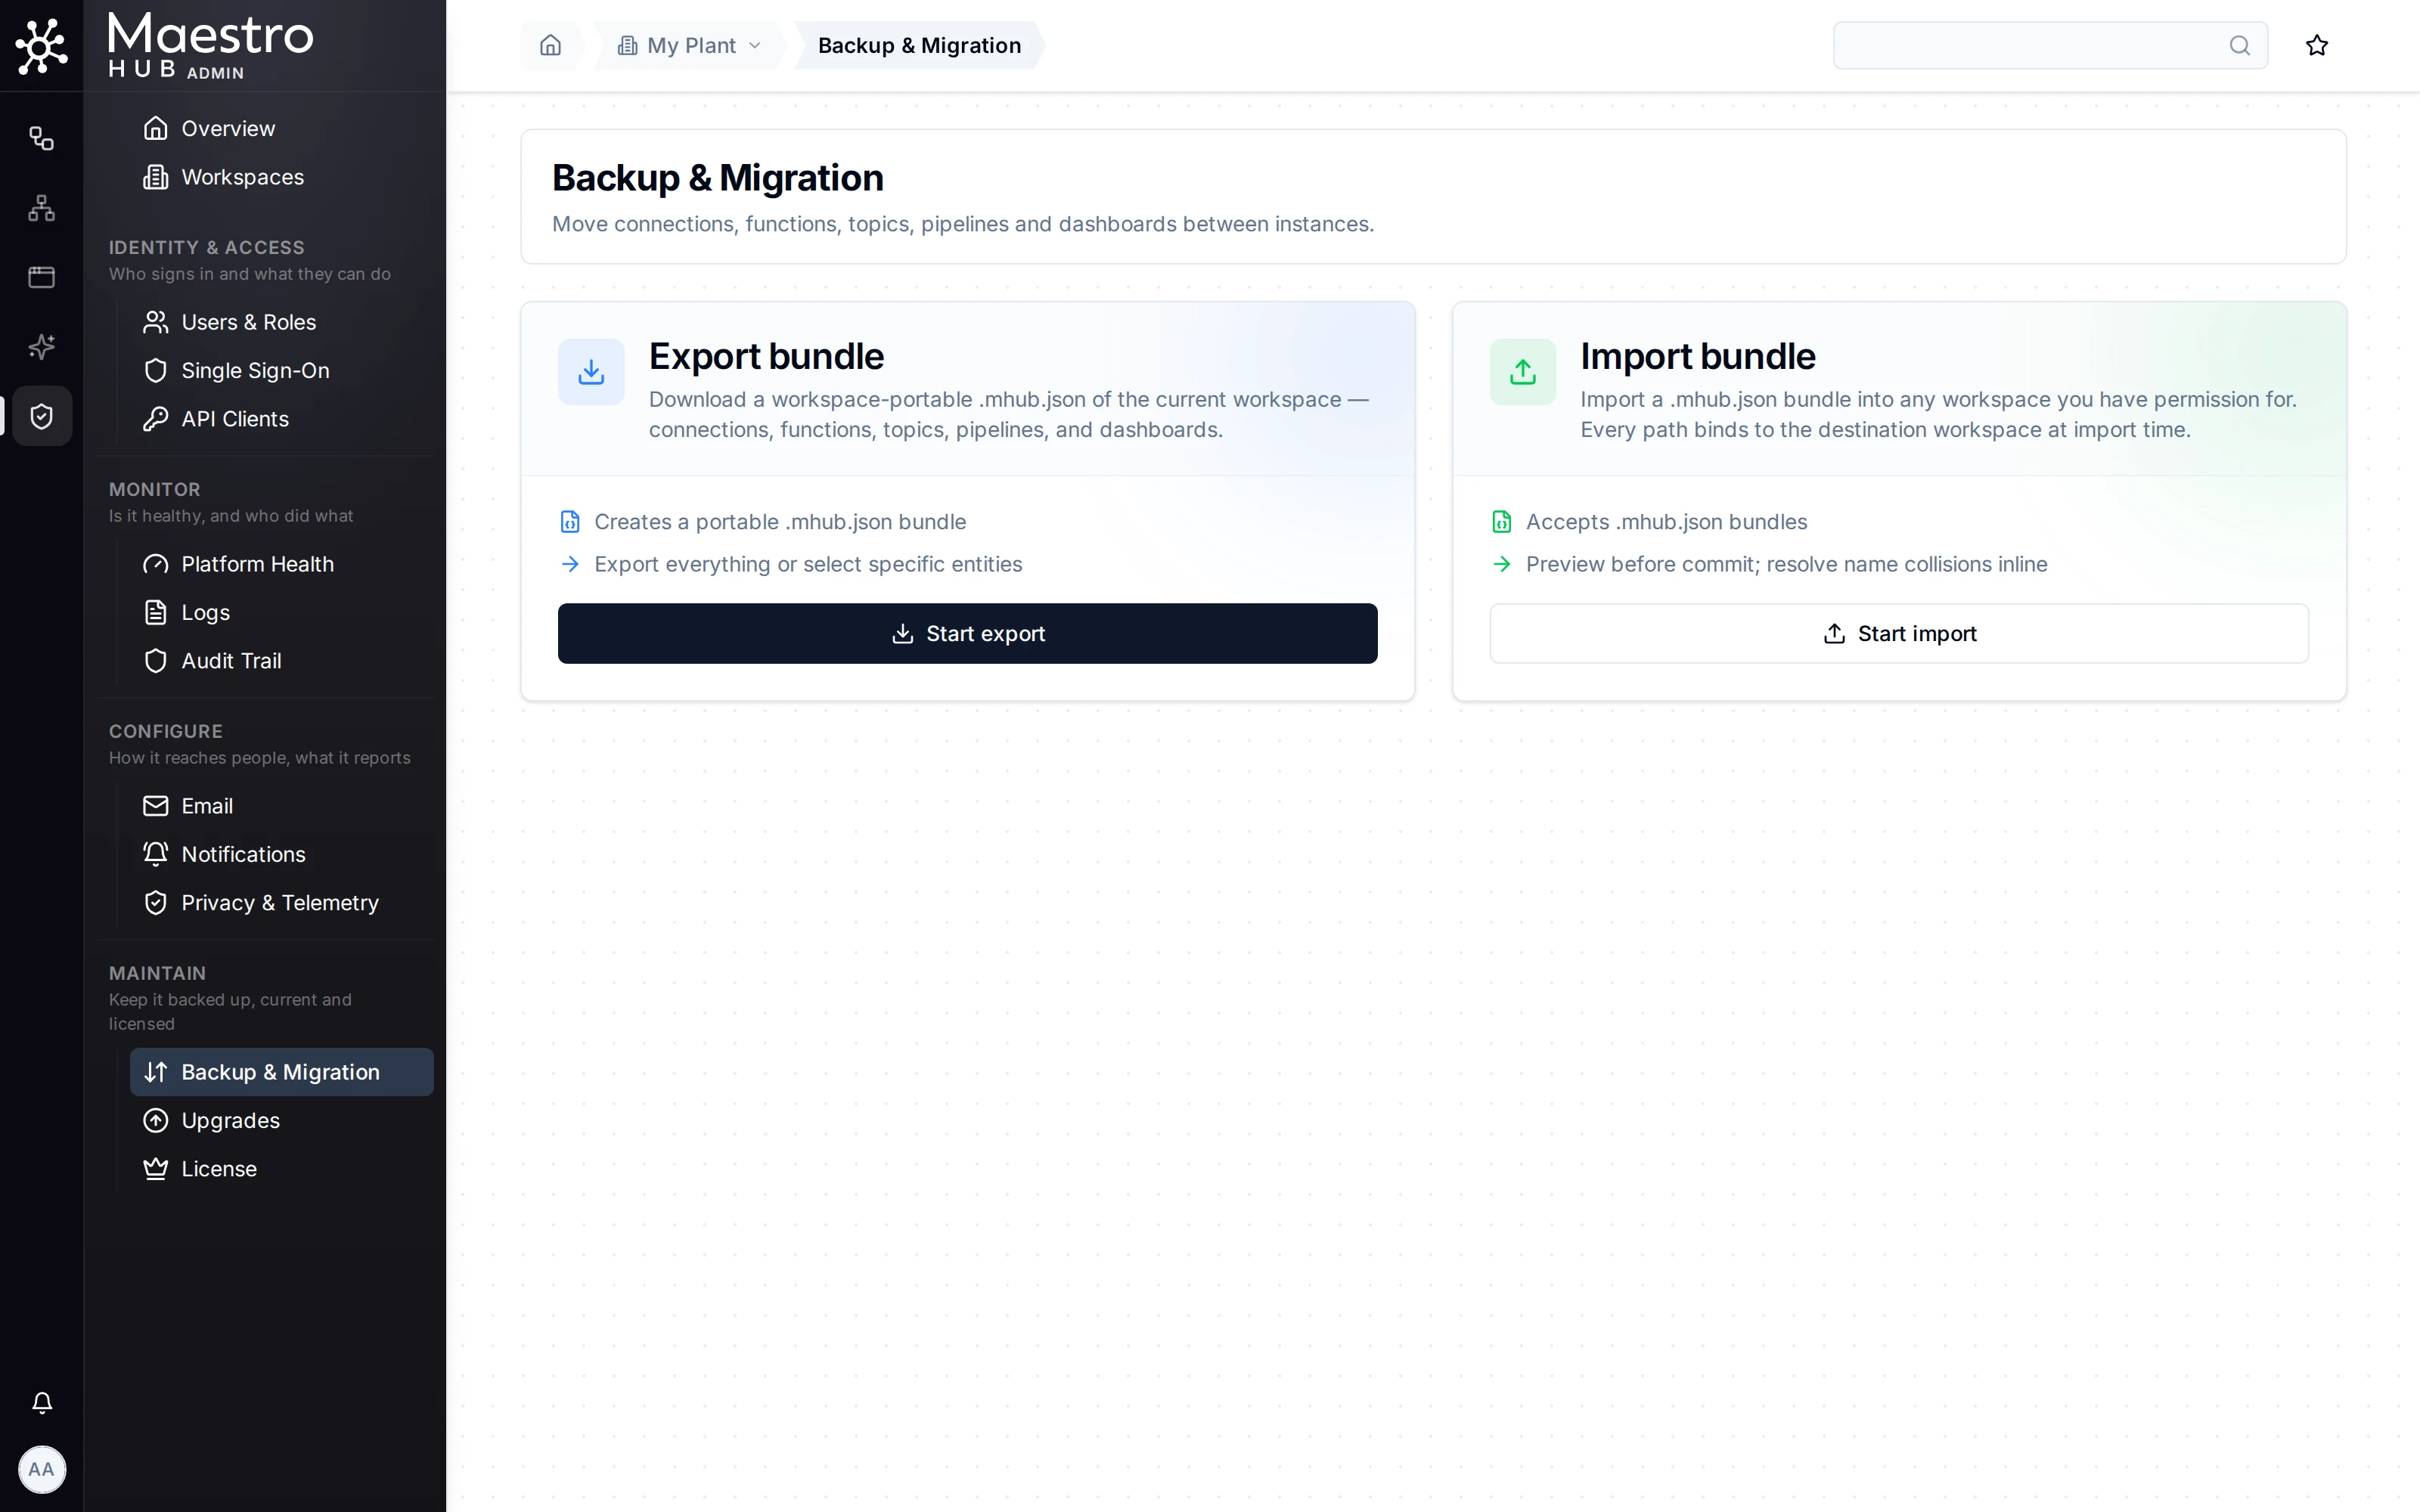
You'll know it worked when you open Explore › Dashboards › DFS OEE Monitoring and the numbers are moving. That's a whole production line, live, in your MaestroHub. Well done.
If you don't see it, give it ten seconds: the pipelines read every few seconds. Still empty? Open Connect › Connections. A connection that can't reach the simulator says so, with the reason. Most often the address is wrong: see which address to use.
Make it yours
The import showed you what's possible. Now you'll do it yourself, once, with one machine: OP20, the CNC finishing station. It speaks OPC UA, the standard most modern machines use. Everything you learn here works the same with your real equipment.
Connect to OP20
- Open Connect › Connections, click New Connection and pick OPC UA.
- Name it
OP20-CNC. Set Server Hostname to<DFS_HOST>(localhostif you followed along) and Port to14840. Leave security as it is. - Click Test Connection. When it says it connected, click Create Connection.
- Open the connection's Address Space tab. This is OP20 describing itself. Open Root › Objects › OP20-CNC.
- Click the arrow next to State, SpindleSpeed, SpindleLoad and CoolantTemp to add them to the Data Access View. Their values appear and change as the machine works.
- Click Add All. Rename each function to the value's name (
State,SpindleSpeed,SpindleLoad,CoolantTemp) and click Create 4 Functions.
Tell MaestroHub where OP20 is
Connect › Connections › New Connection, then pick OPC UA.
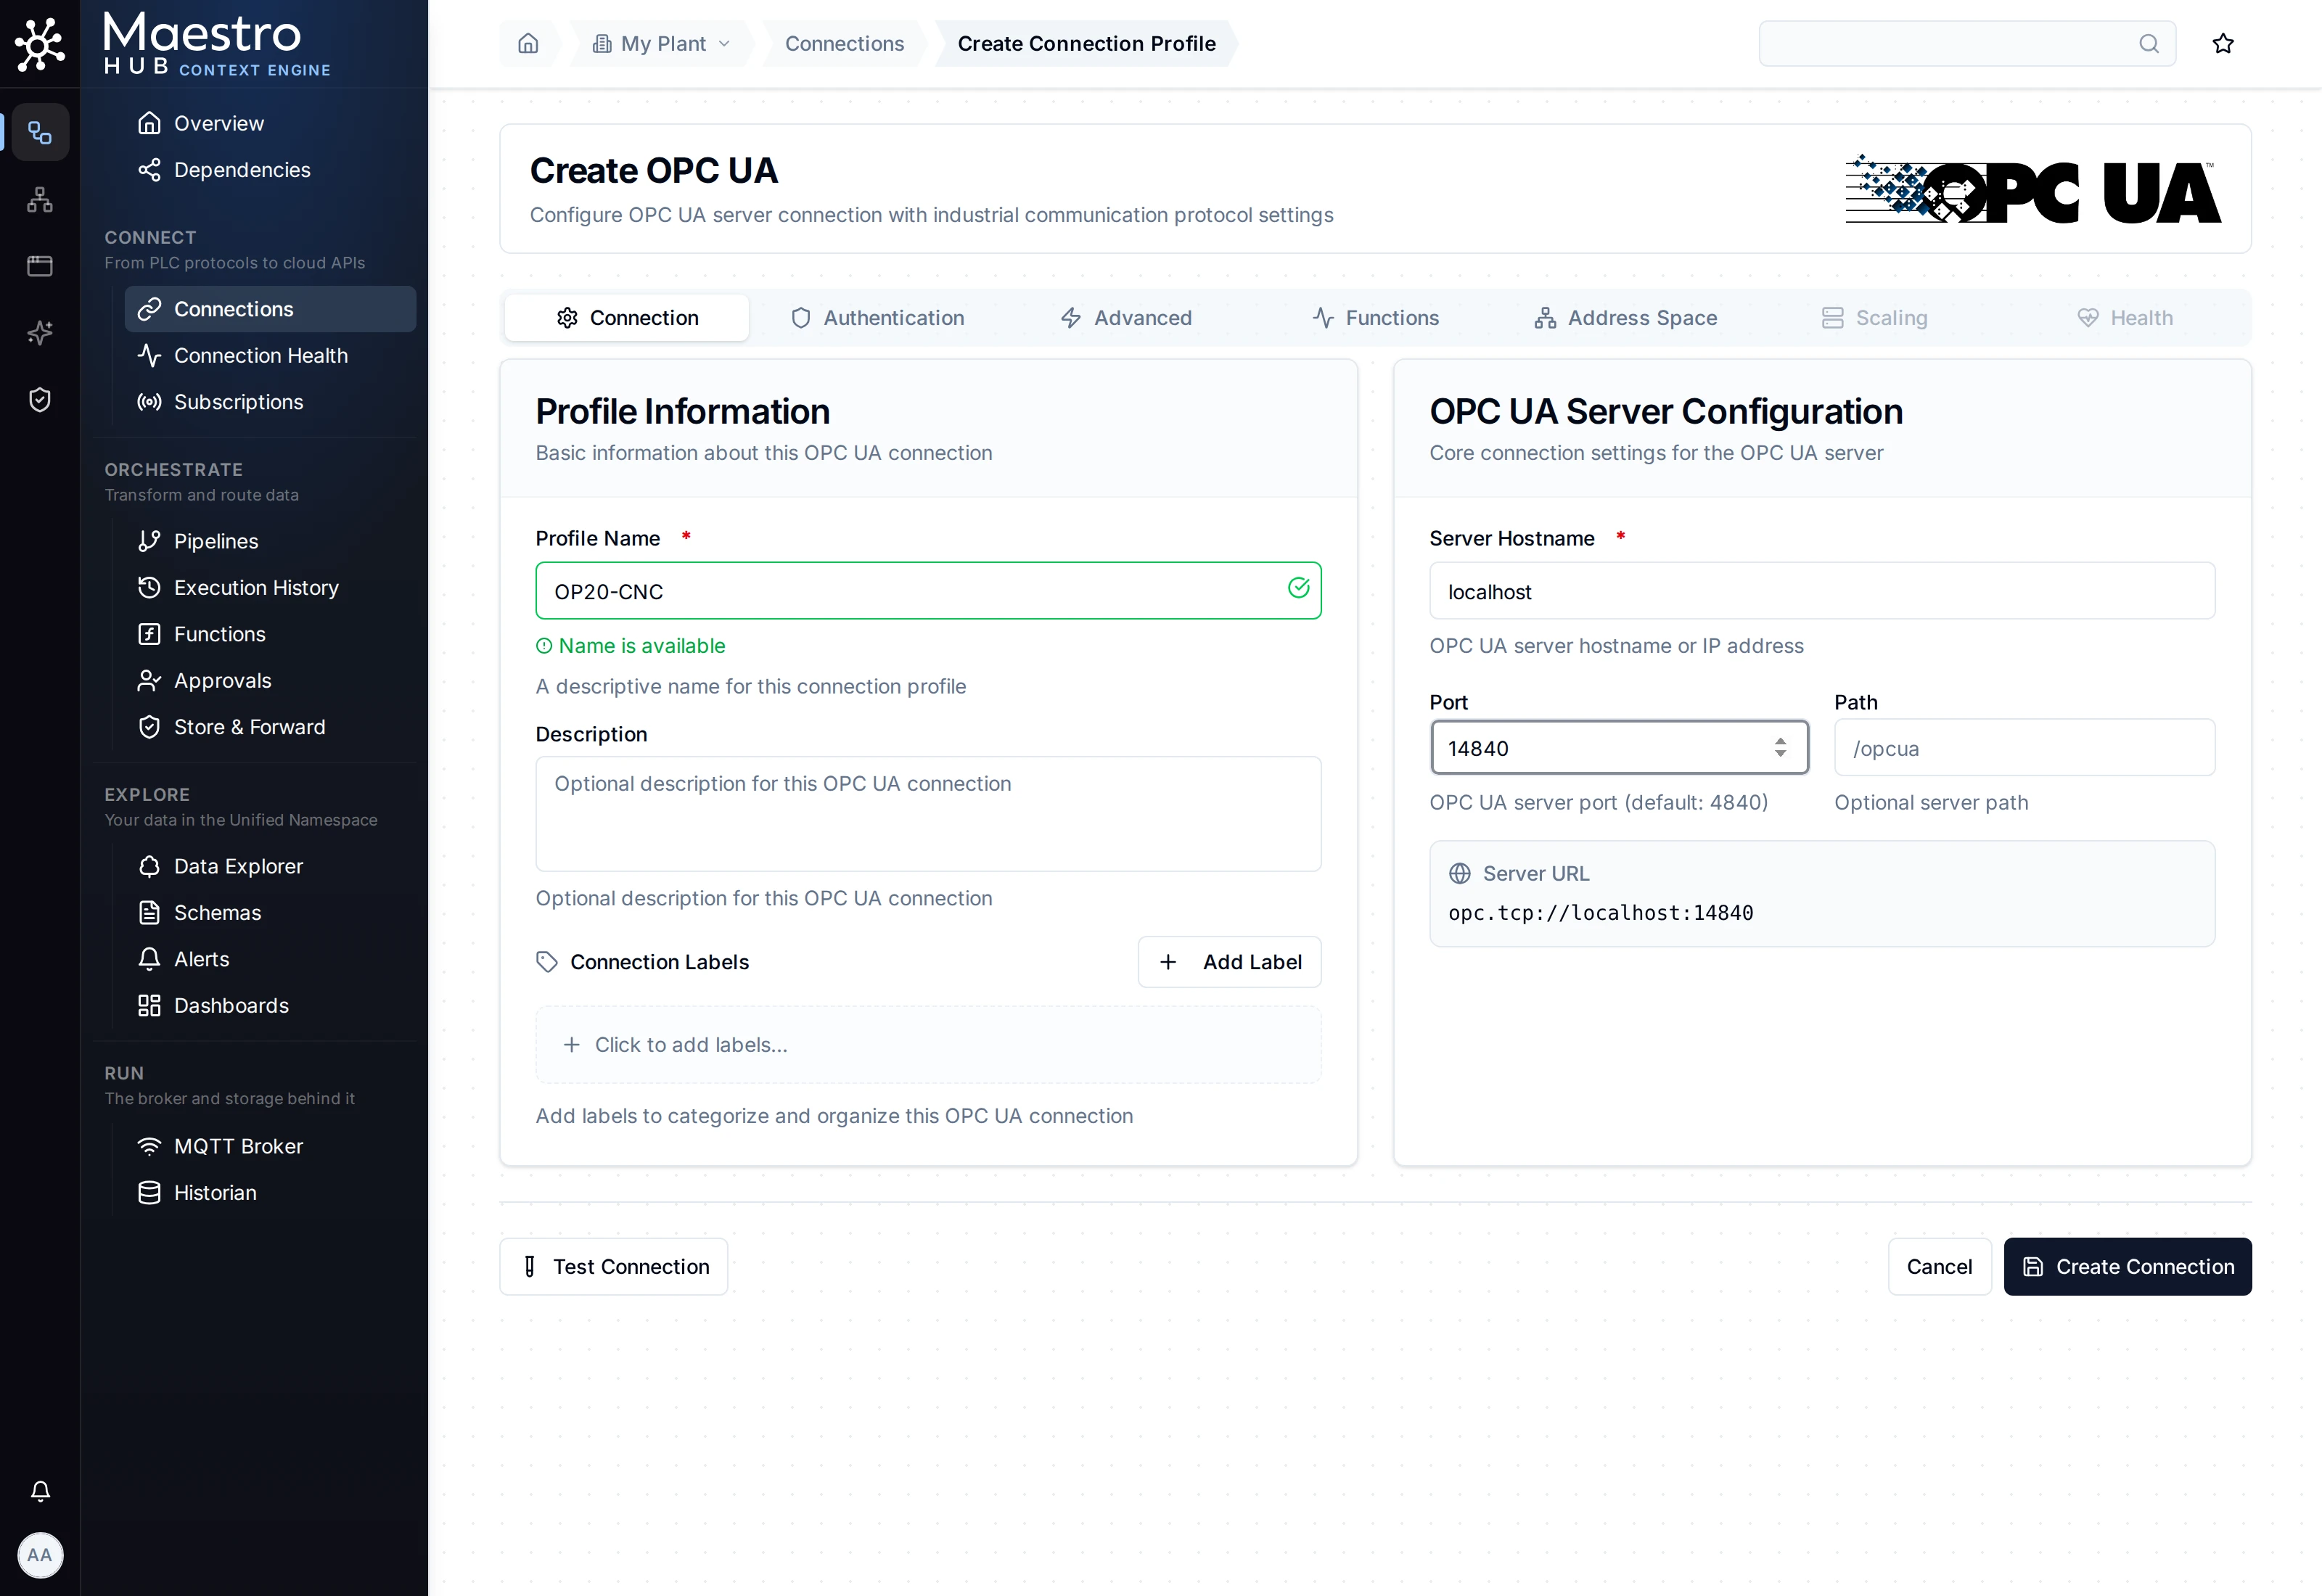
You'll know it worked when the connection's Functions tab lists your four functions.
If you don't see it: if Test Connection fails, check the address against the table in step 2, and that the simulator's tab is still open.
Build your first pipeline
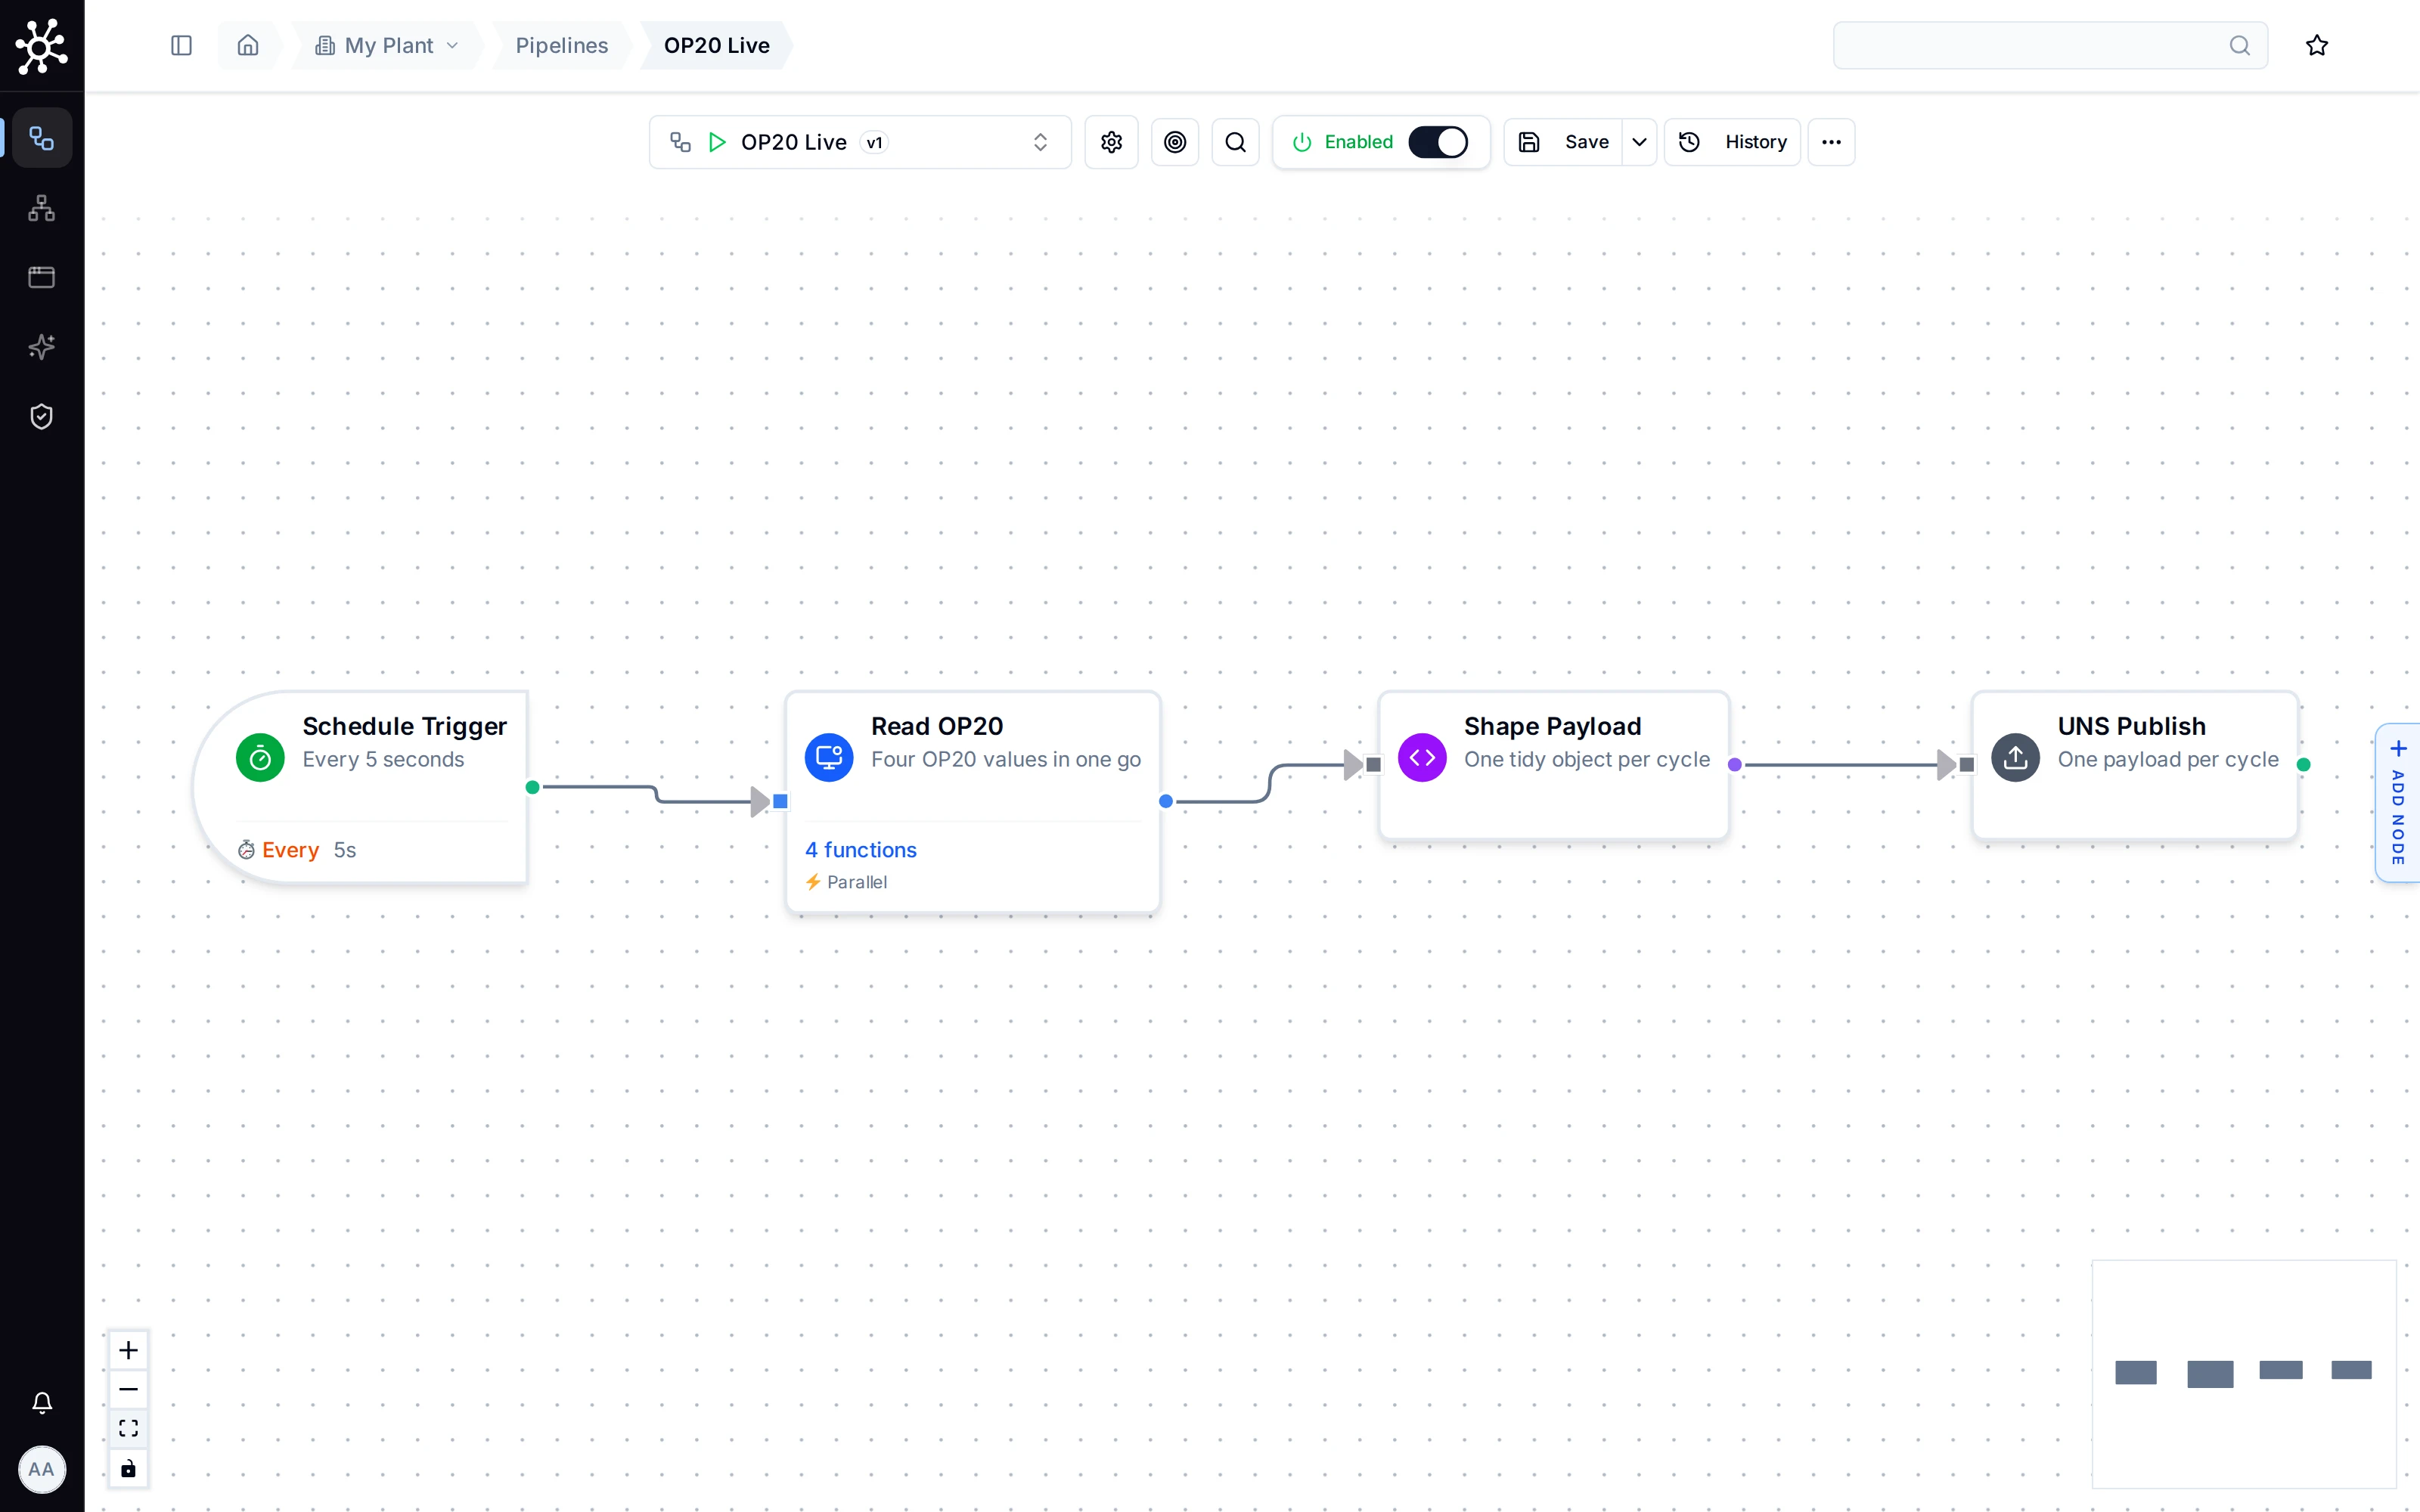
A pipeline is a small recipe: when to run, what to read, how to tidy it up and where to put it. Open Orchestrate › Pipelines, click Create Pipeline and name it OP20 Live. Then add four nodes and connect them left to right:
- A Schedule Trigger, with an interval of 5 seconds.
- An OPC-UA Read Group. Rename it
Read OP20, pick theOP20-CNCconnection and tick your four functions. - A JavaScript node. Rename it
Shape Payloadand paste:
// The Read Group's output: one entry per function, keyed by its name
const reads = $node["Read OP20"].result;

return {
  state: reads.State.value,
  spindle_speed: reads.SpindleSpeed.value,
  spindle_load: reads.SpindleLoad.value,
  coolant_temp: reads.CoolantTemp.value,
};
- A UNS Publish. Set UNS Topic to
acme/berlin/machining/line1/op20and Value to{{ $node["Shape Payload"].result }}.
Click Save, then switch the pipeline to Enabled.
Two ideas worth knowing. $node["Read OP20"] reads another node's output by the name on the canvas, which is why you renamed it. And the topic is an address in your Unified Namespace: company, site, area, line, machine. Everything in your plant gets one place, and everyone finds it there.
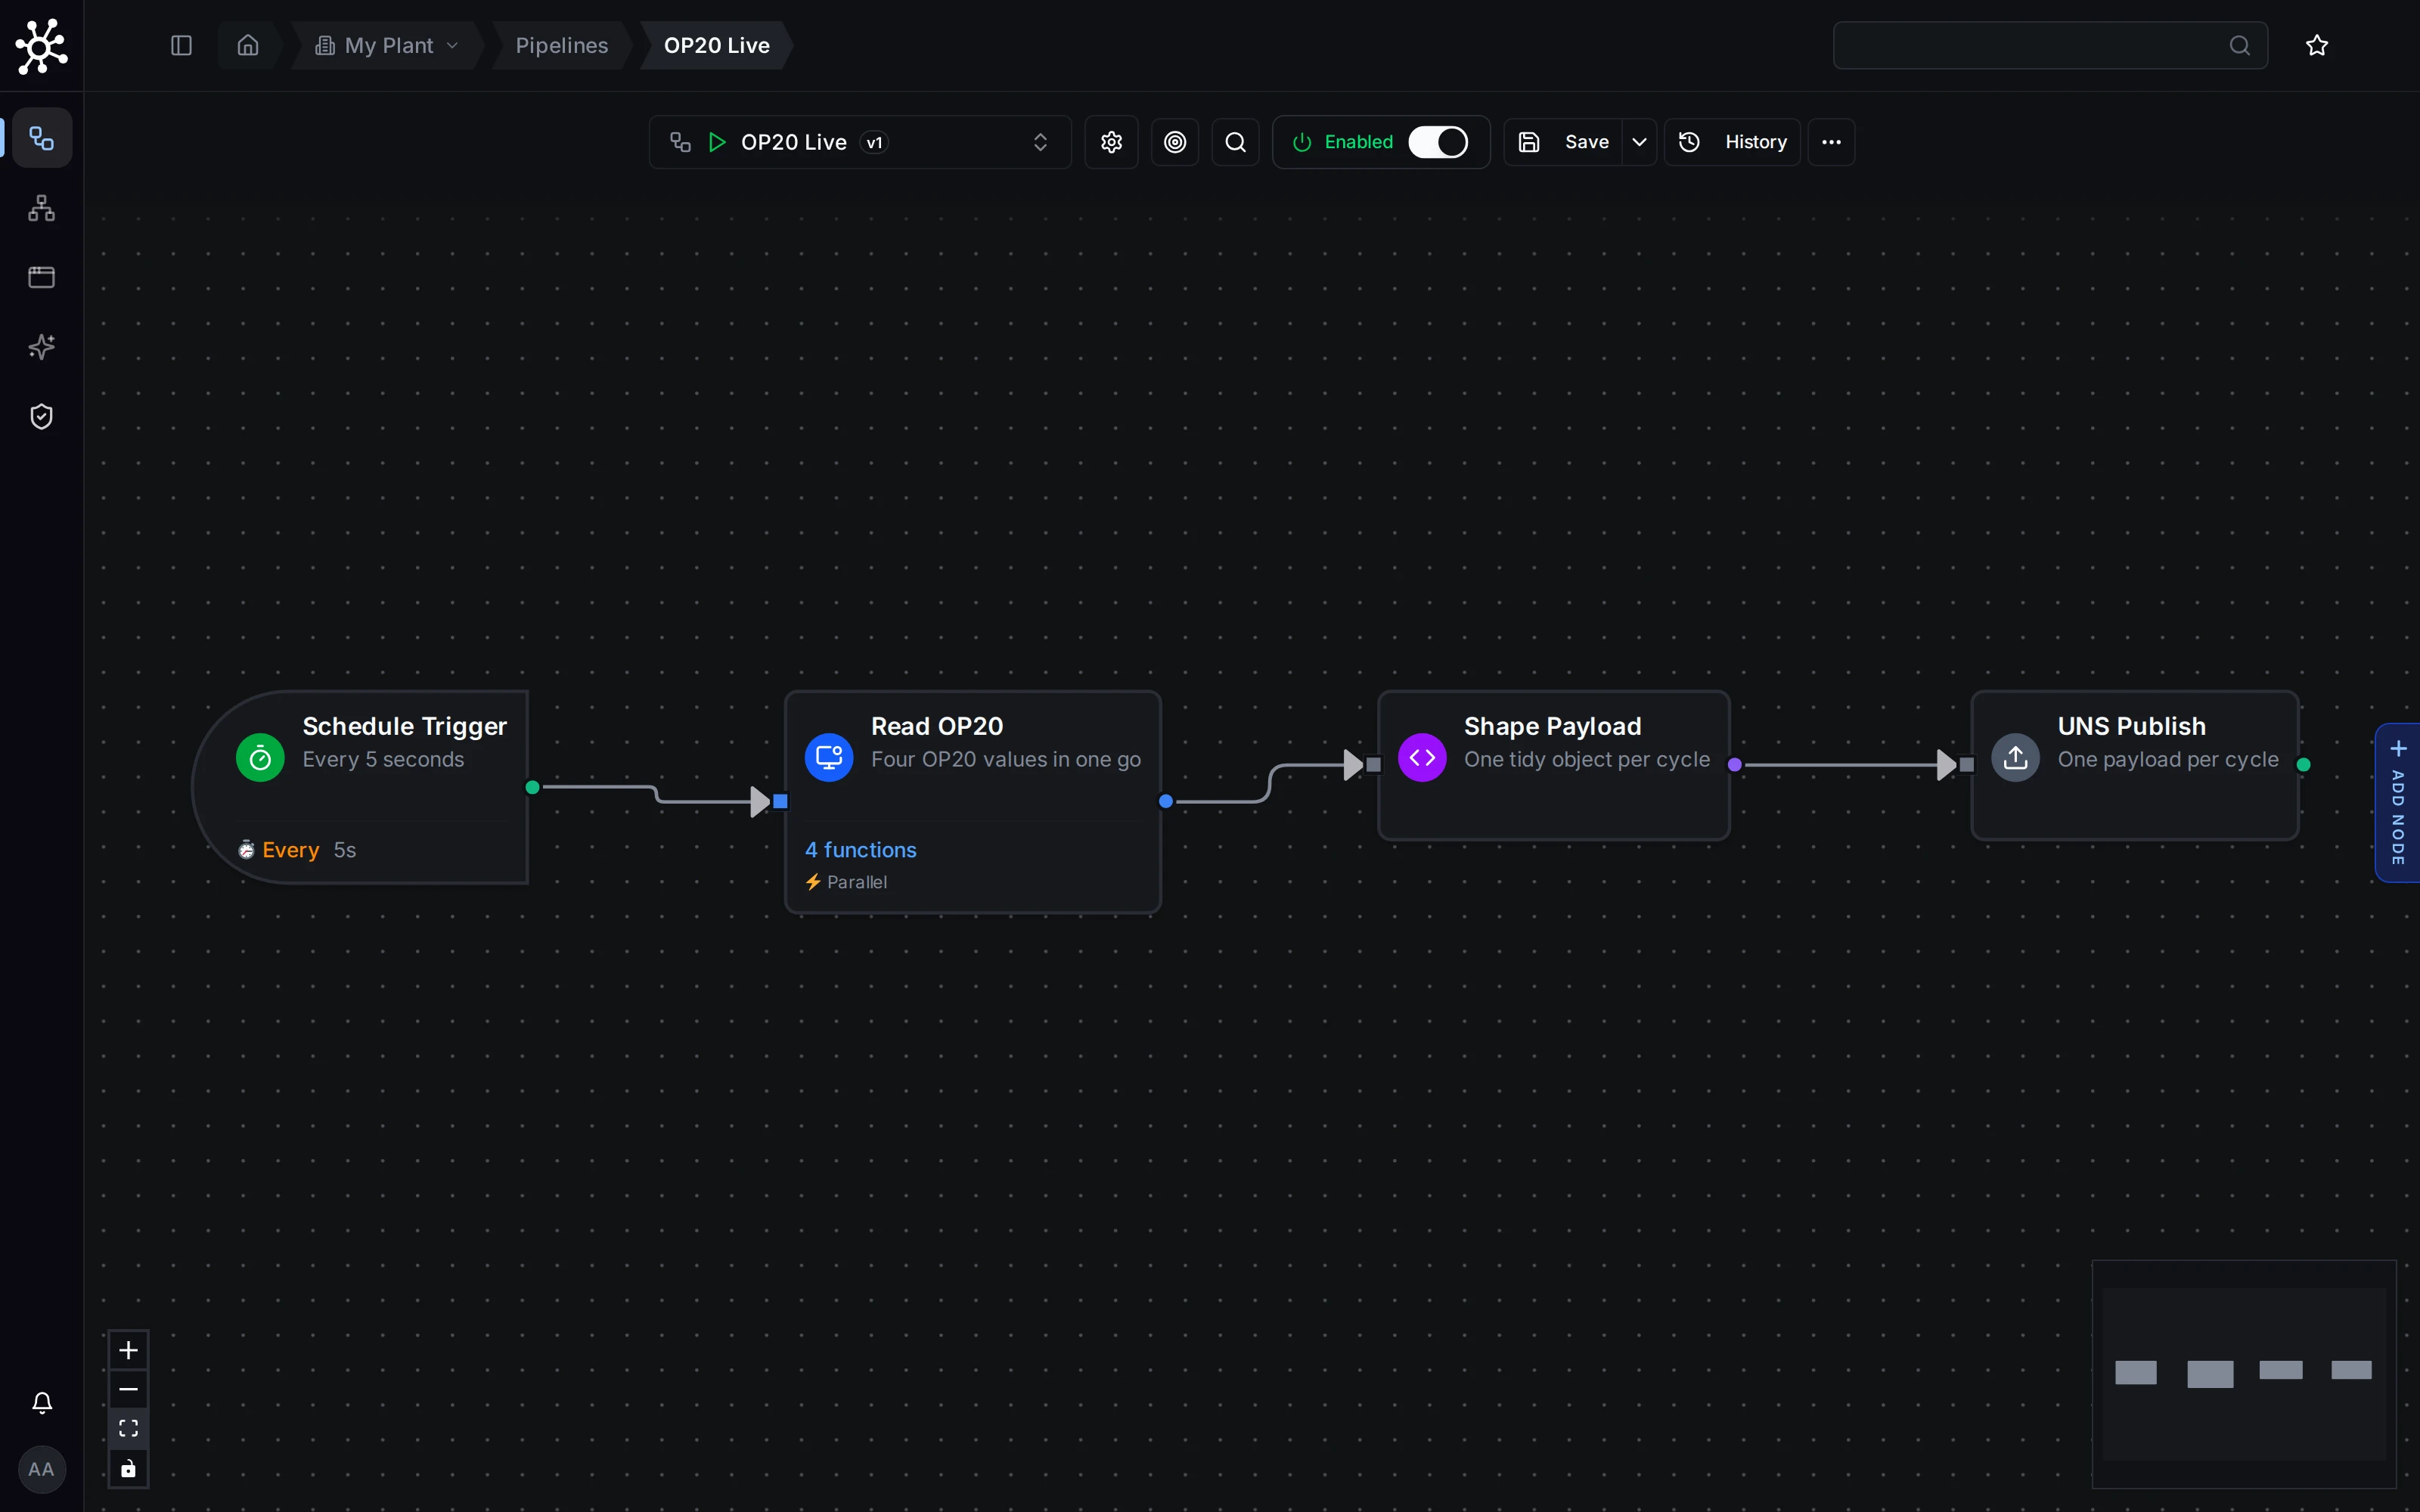
Four nodes, left to right
OP20 Live: a Schedule Trigger, an OPC-UA Read Group, a JavaScript node and a UNS Publish.
You'll know it worked when Explore › Data Explorer shows op20 under acme/berlin/machining/line1, and a new payload arrives every 5 seconds. That's data you moved yourself. Take a moment.
If you don't see it: on any node, Test Node in Live mode shows exactly what that node returns. Start with Read OP20 and move right until a step looks wrong.
Build your first dashboard
- Open Explore › Dashboards, click New Dashboard and name it
My OP20. - Click Add Panel › New Panel, then Add Query. Search for
line1/op20and tickspindle_speed. - Pick Line Chart and click Add Panel.
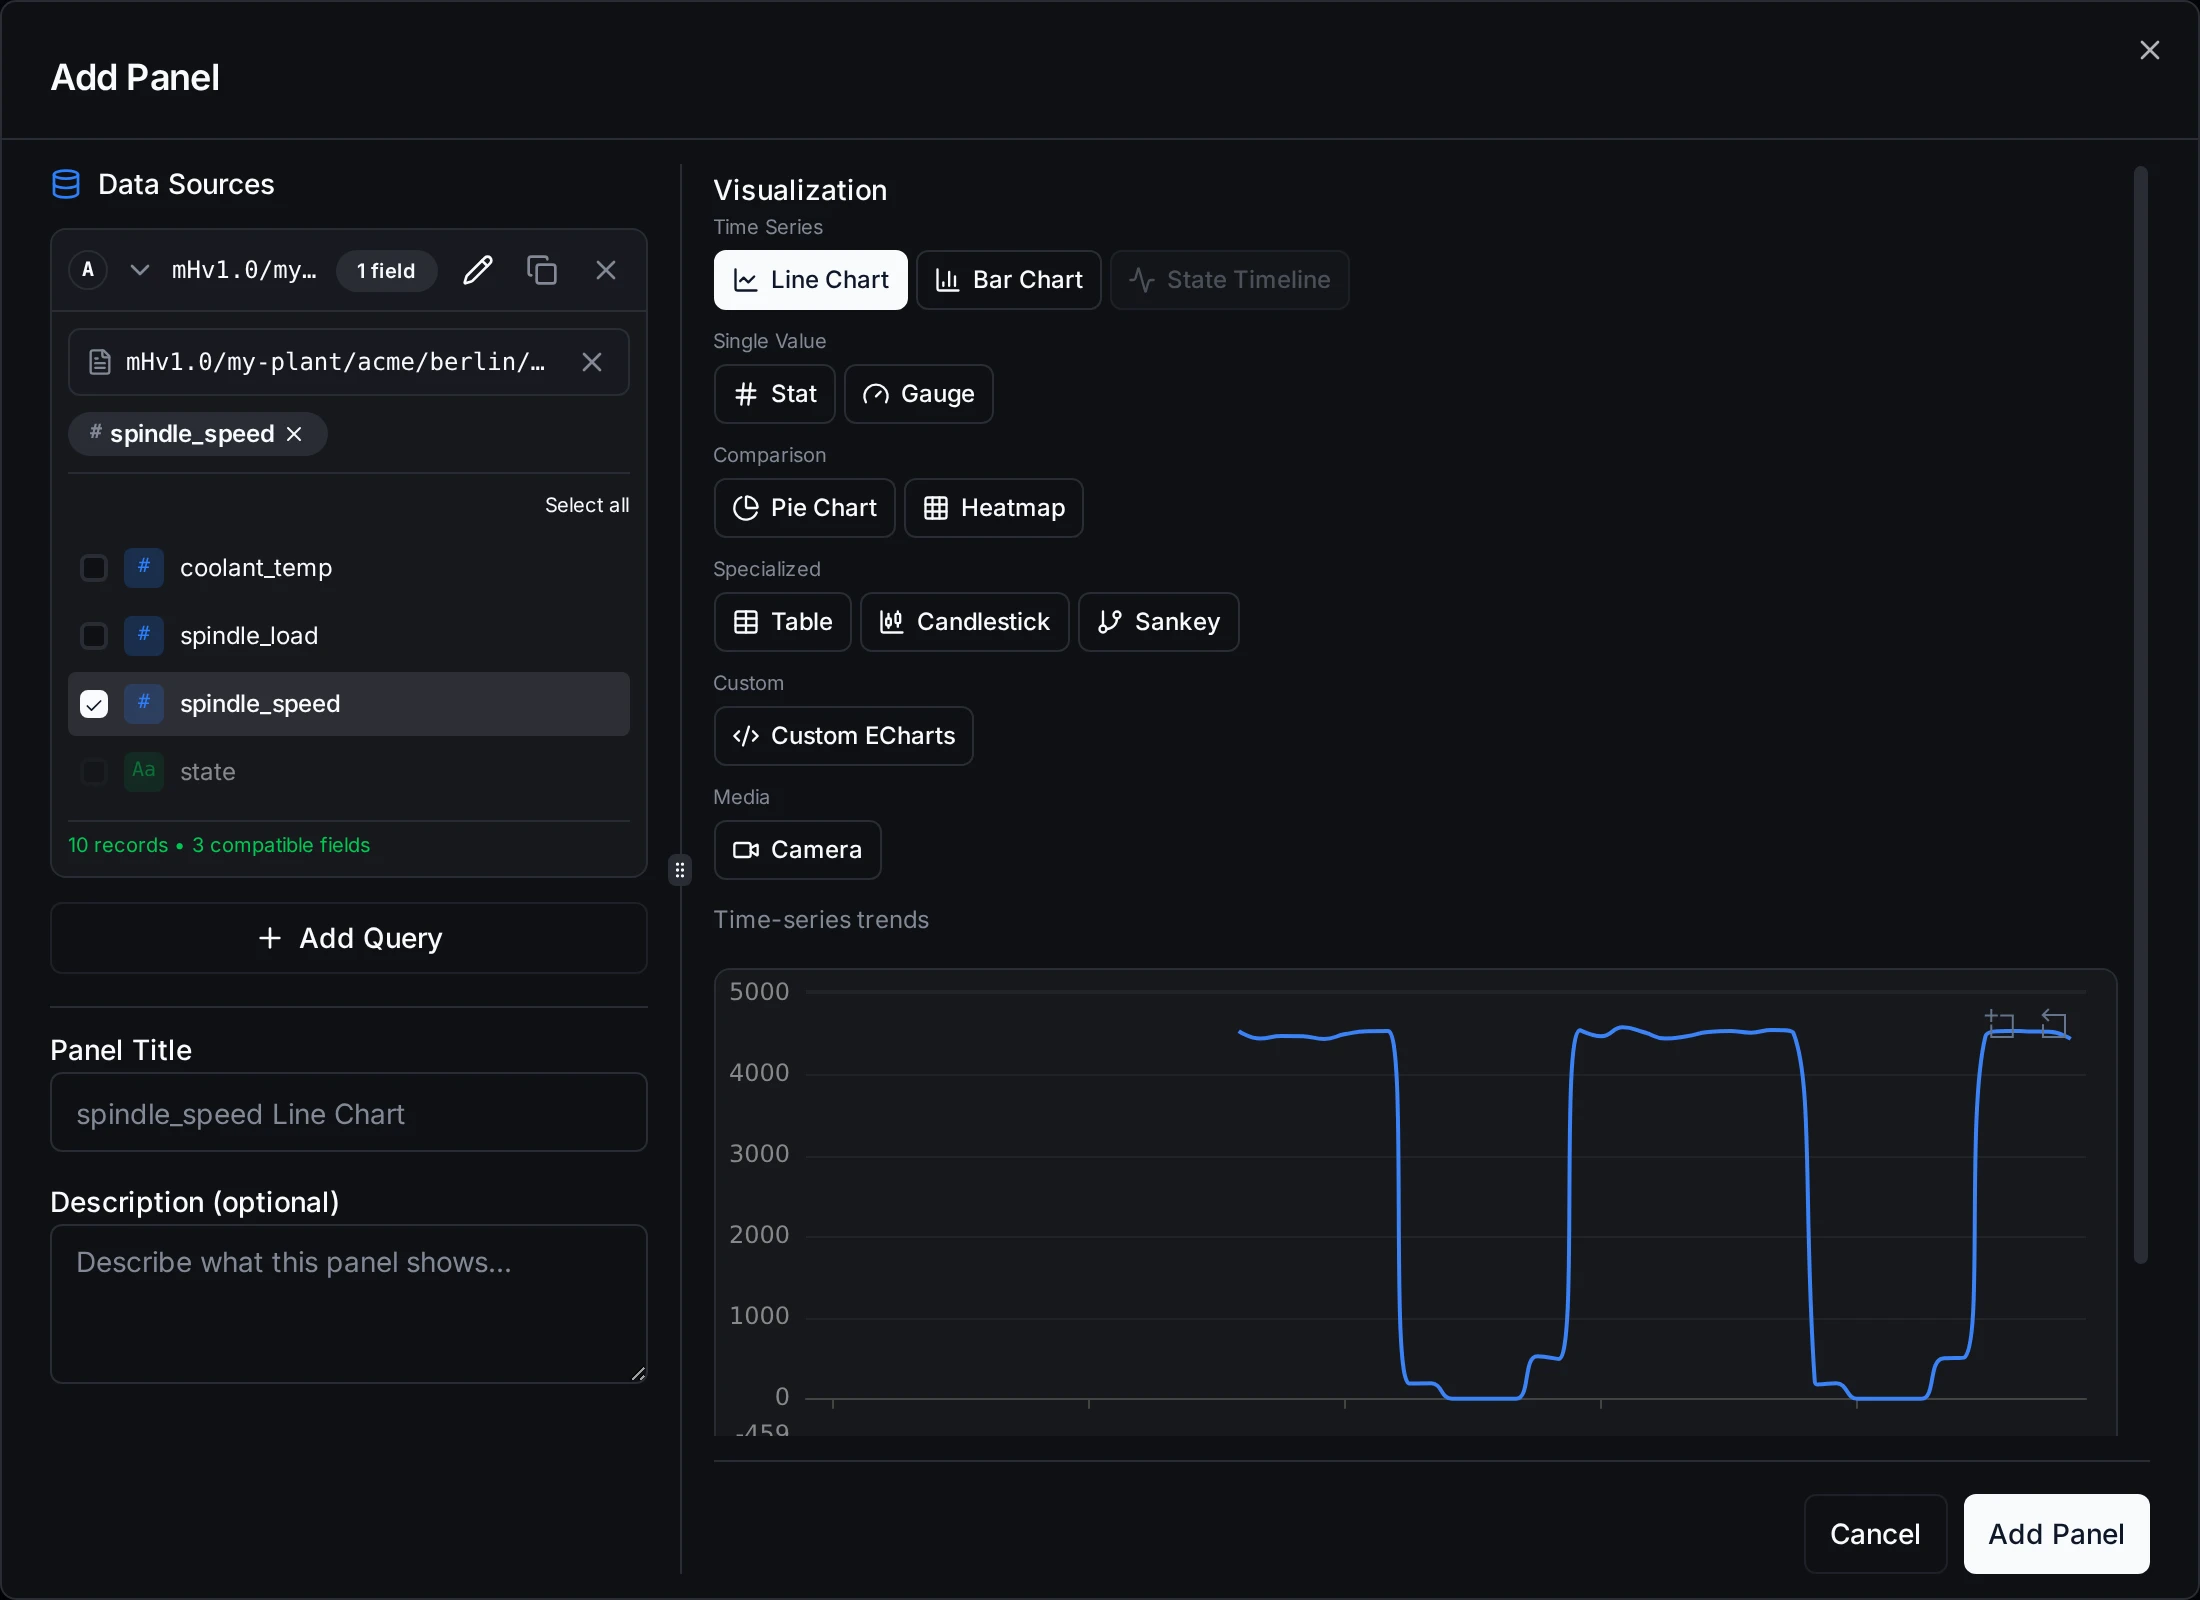
Add a panel
Explore › Dashboards › New Dashboard, then Add Panel › New Panel.
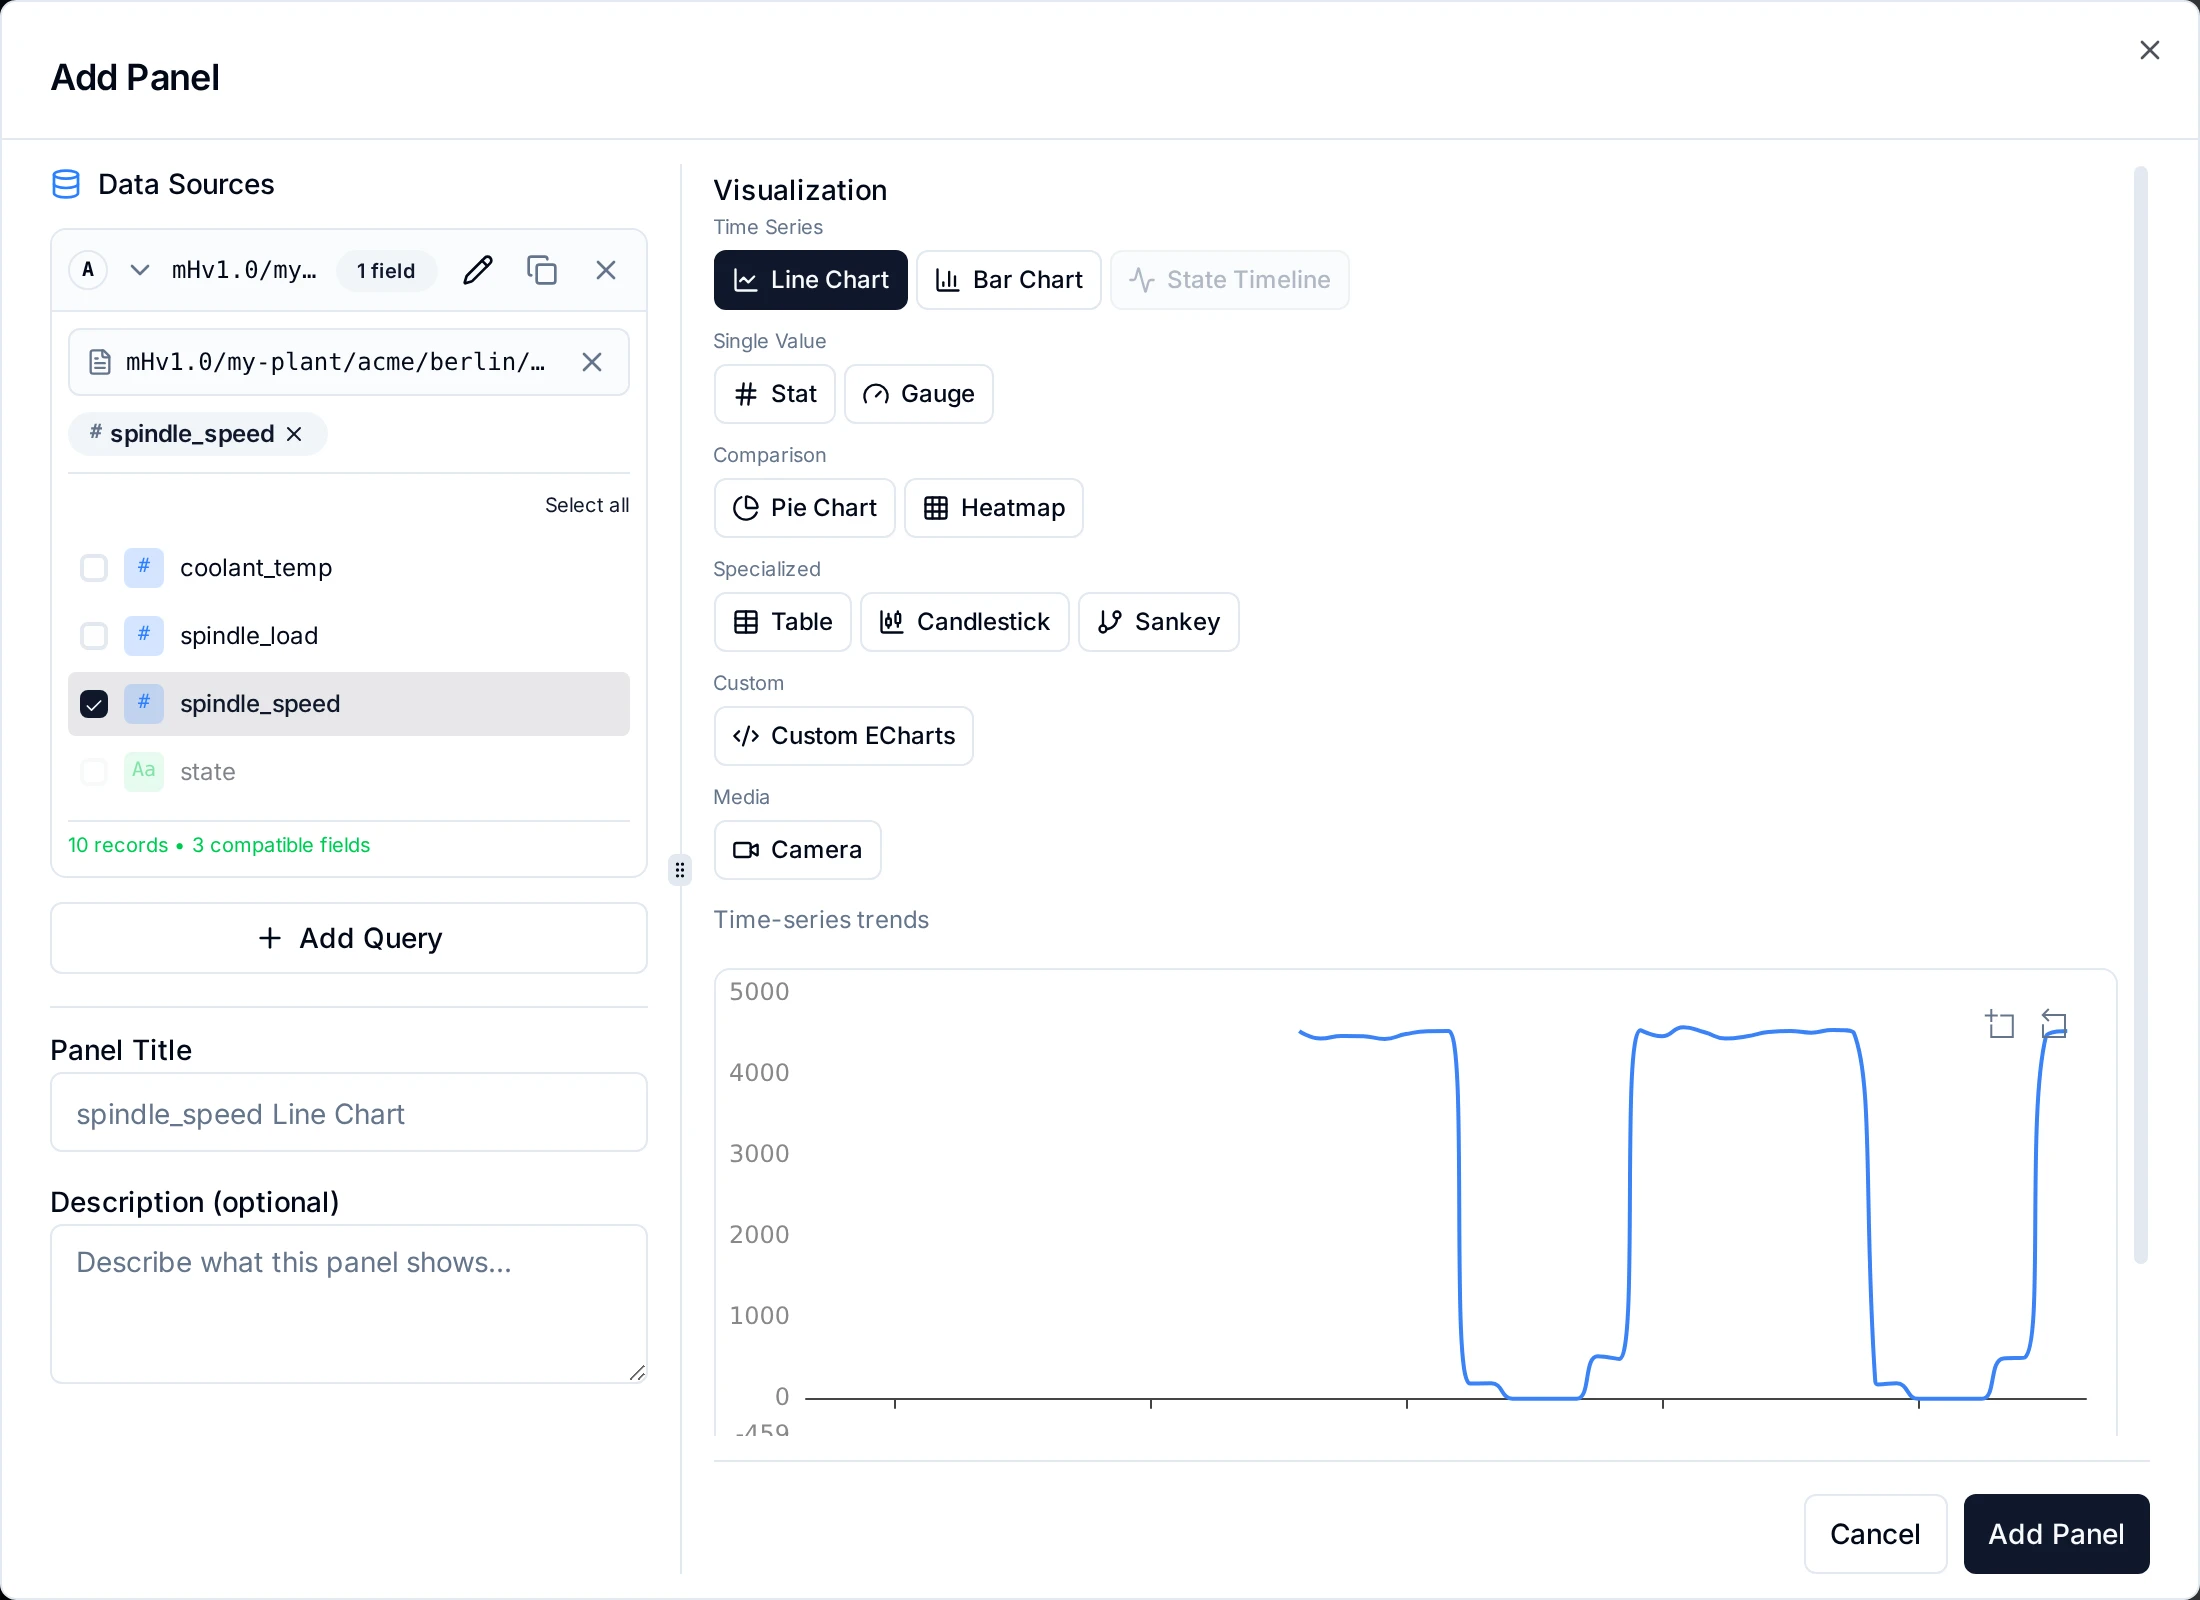
You'll know it worked when the line moves as the spindle speeds up and slows down. A new dashboard shows the last hour, and your pipeline has only been running for a few minutes, so your line starts near the right edge. Click Last 1 hour at the top and pick Last 15 minutes to see it up close. Add a panel for coolant_temp or spindle_load the same way, and drag a corner to resize.
If you don't see it: the fields come from what your pipeline has already published, so make sure it's enabled and Data Explorer shows payloads.
You did it
You started a platform, brought a factory in with one file, connected a machine, moved its data and put it on a dashboard. That's the whole loop, and every real MaestroHub deployment is built from it. Here's where to go from here:
Explore the simulated factory
All four stations, the MES and the ERP, the OEE and energy dashboards, and factory profiles from world class to struggling.
Learn more →Build richer pipelines
Fifty-plus node types: conditions, loops, databases, messages, scripts. Browse them all.
Learn more →Shape your namespace
Organise topics, give them a meaning so every value has a unit and one alarm, and get alerts when one is off.
Learn more →Back on the Overview, your setup now offers one more step, Give your data meaning. It's optional: it gives every temperature or spindle speed one unit and one alarm. The 10-minute tutorial shows how.
Want a guided look at every screen? Take the Platform Tour.
Do it with an agent
Everything above can also be done by an AI assistant, through the same API the screens use. MaestroHub runs an MCP server, an open standard that Claude, Cursor, VS Code and other assistants speak. The assistant uses a personal access token you create, and it can never do more than your own role allows.
- Connect your assistant once. In MaestroHub, open the profile menu and choose Connect an AI client; the MCP Integration guide walks you through it.
- Send it this, with your
<DFS_HOST>:
Connect MaestroHub to OP20 on opc.tcp://<DFS_HOST>:14840 (OPC UA, no security,
anonymous). Name the connection OP20-CNC.

Create four read functions on it, named State, SpindleSpeed, SpindleLoad and
CoolantTemp, for the nodes ns=1;s=OP20-CNC.State, ns=1;s=OP20-CNC.SpindleSpeed,
ns=1;s=OP20-CNC.SpindleLoad and ns=1;s=OP20-CNC.CoolantTemp. Test them.

Then create a pipeline called "OP20 Live" that runs every 5 seconds, reads the
four functions with an OPC-UA Read Group named "Read OP20", and publishes one
payload with state, spindle_speed, spindle_load and coolant_temp to the UNS
topic acme/berlin/machining/line1/op20. Enable it.

Finally, create a dashboard called "My OP20" with a line chart of
spindle_speed from that topic.
- Open Explore › Data Explorer and the dashboard to see what it built. It's the same result as step 4, and you can open and change every piece of it by hand.
The MCP examples have more to try.