Monitor and troubleshoot
Find what is wrong from the Overview, then dig in with system logs, pipeline execution history and replay, and connection health.
- Logs
- Admin › Monitor › Logs
- Runs kept
- 24 hours by default
- Log results
- First 10,000 records
- Connection history
- Up to 7 days
This guide walks you through the monitoring and diagnostic tools available in MaestroHub. Each kind of problem has its own section:
| To find out | Open |
|---|---|
| What needs attention right now | the Overview |
| Why a pipeline run failed | Execution History and Execution Replay |
| Whether a connection is working, and how often it drops | Connection Status and Connection Health |
| Who changed what, and when | Audit Trail |
| What MaestroHub's own services are doing | System Logs |
Start with the Overview
Navigation: Overview (sidebar), then open your workspace
The Overview pages are the first screens you see after signing in, and the quickest way to find out whether something is wrong. For troubleshooting, three parts matter most.
Needs attention
Your workspace's Overview opens with one sentence: either that nothing needs you, or how many things do. Below it, Needs attention lists every open problem in the workspace, worst first: connections that are failing, dropped or struggling, pipeline runs that are failing, readings that stopped arriving, and data that could not be held for an unreachable destination. Each row says what happened, gives the fix on a second line, and links to the page where you can act on it.
Rows clear themselves when the problem goes away. There is nothing to tick off.
Runs rejected by a validation rule
When a validation rule rejects a value a pipeline publishes (a topic's meaning set to enforce, or a value of the wrong type), the pipeline did its job and MaestroHub refused the value, with the reason. Such a run is not counted as a pipeline failure:
- The failed-runs and failing-pipeline warnings count only real failures. N pipeline executions failed, finished with errors and N pipelines failing leave out runs a validation rule rejected. A rejected run neither starts nor ends a failing streak. Their Investigate failed runs link opens Execution History filtered to real failures only, and the page says the rejected runs are hidden.
- A note of its own. The Overview shows N pipeline runs rejected by validation rules in the last 15 min, followed by up to three of the pipelines, most rejected first (and 2 more for the rest). It is a note, not a warning: it is not counted under Needs attention and it never notifies anyone. Open Violations opens the Violations tab of Alerts, where each rejected value is listed with the rule that rejected it. The device sending the value, or the rule, needs correcting.
- A pipeline that delivers nothing still raises a warning. When a pipeline's runs keep being rejected, so nothing reaches any destination, the no output warning fires as for any pipeline that sends nothing, and notifies as that warning does. Its remediation says the values are being rejected by a validation rule; its link opens that pipeline's runs, and each run's badge leads to the rejected values.
The run itself still ends Failed (or Completed with Errors), and Pipeline Metrics and the Activity charts still count it as one. The Overview's own figures do not: the run counts beside the headline and the Clean runs tile show such runs as rejected by rules, apart from failures, and the clean share leaves them out; the tile's link opens Violations. On the instance Overview the note is not counted as an issue. In Execution History it carries the badge Rejected by a validation rule; see Execution History.
With Maestro, which is in release 3.0 as Beta (early access on request), each warning and critical row also has Explain & fix: it asks Maestro what went wrong and what to do, and Maestro changes nothing without your yes. The instance Overview has no such button. See Explain & fix.
On the instance Overview (the Overview item in the sidebar), the same problems from every workspace you can see are gathered into one list, ranked by severity. With several workspaces, each one is a row sorted worst first, with a colored edge (red, amber, green or grey) and either its number of open issues or a status word: Down, Degraded, Flowing or Not set up. Click a row to open its map of connections, pipelines and the Unified Namespace, with that workspace's issues listed underneath.
Activity
The Activity section of the workspace Overview shows four numbers (runs per minute, runs in progress, average runtime, and the share of clean runs over the last 24 hours) and three charts on one shared time axis, in the order your data travels. Pick 15m, 1h or 24h. Hovering one chart shows the same minute on all three, so you can see whether pipeline failures lined up with connection errors or with a drop in stored messages.
| Chart | What it plots | What to look for |
|---|---|---|
| Connections | Messages moved per minute, with a strip showing when connections were down | Red marks under the chart are connector errors at that minute. |
| Pipelines | How long the slowest runs take (p95) | Red flags are failed runs; amber flags are runs that completed with errors. |
| Namespace | Messages stored per minute | Amber marks mean delivery was lagging or signals arrived late. |
When the share of clean runs drops below 95%, it turns amber. It turns red only when more than a fifth of the runs failed outright: runs that completed with errors keep it amber. It then links to the failed runs and the runs that completed with errors, and says how many of each there were.
The in-memory · 24 h chip is a reminder that these charts live in MaestroHub's memory: a restart empties them, and they never hold more than 24 hours. When there is less history than the range you picked, a note above the charts says so.
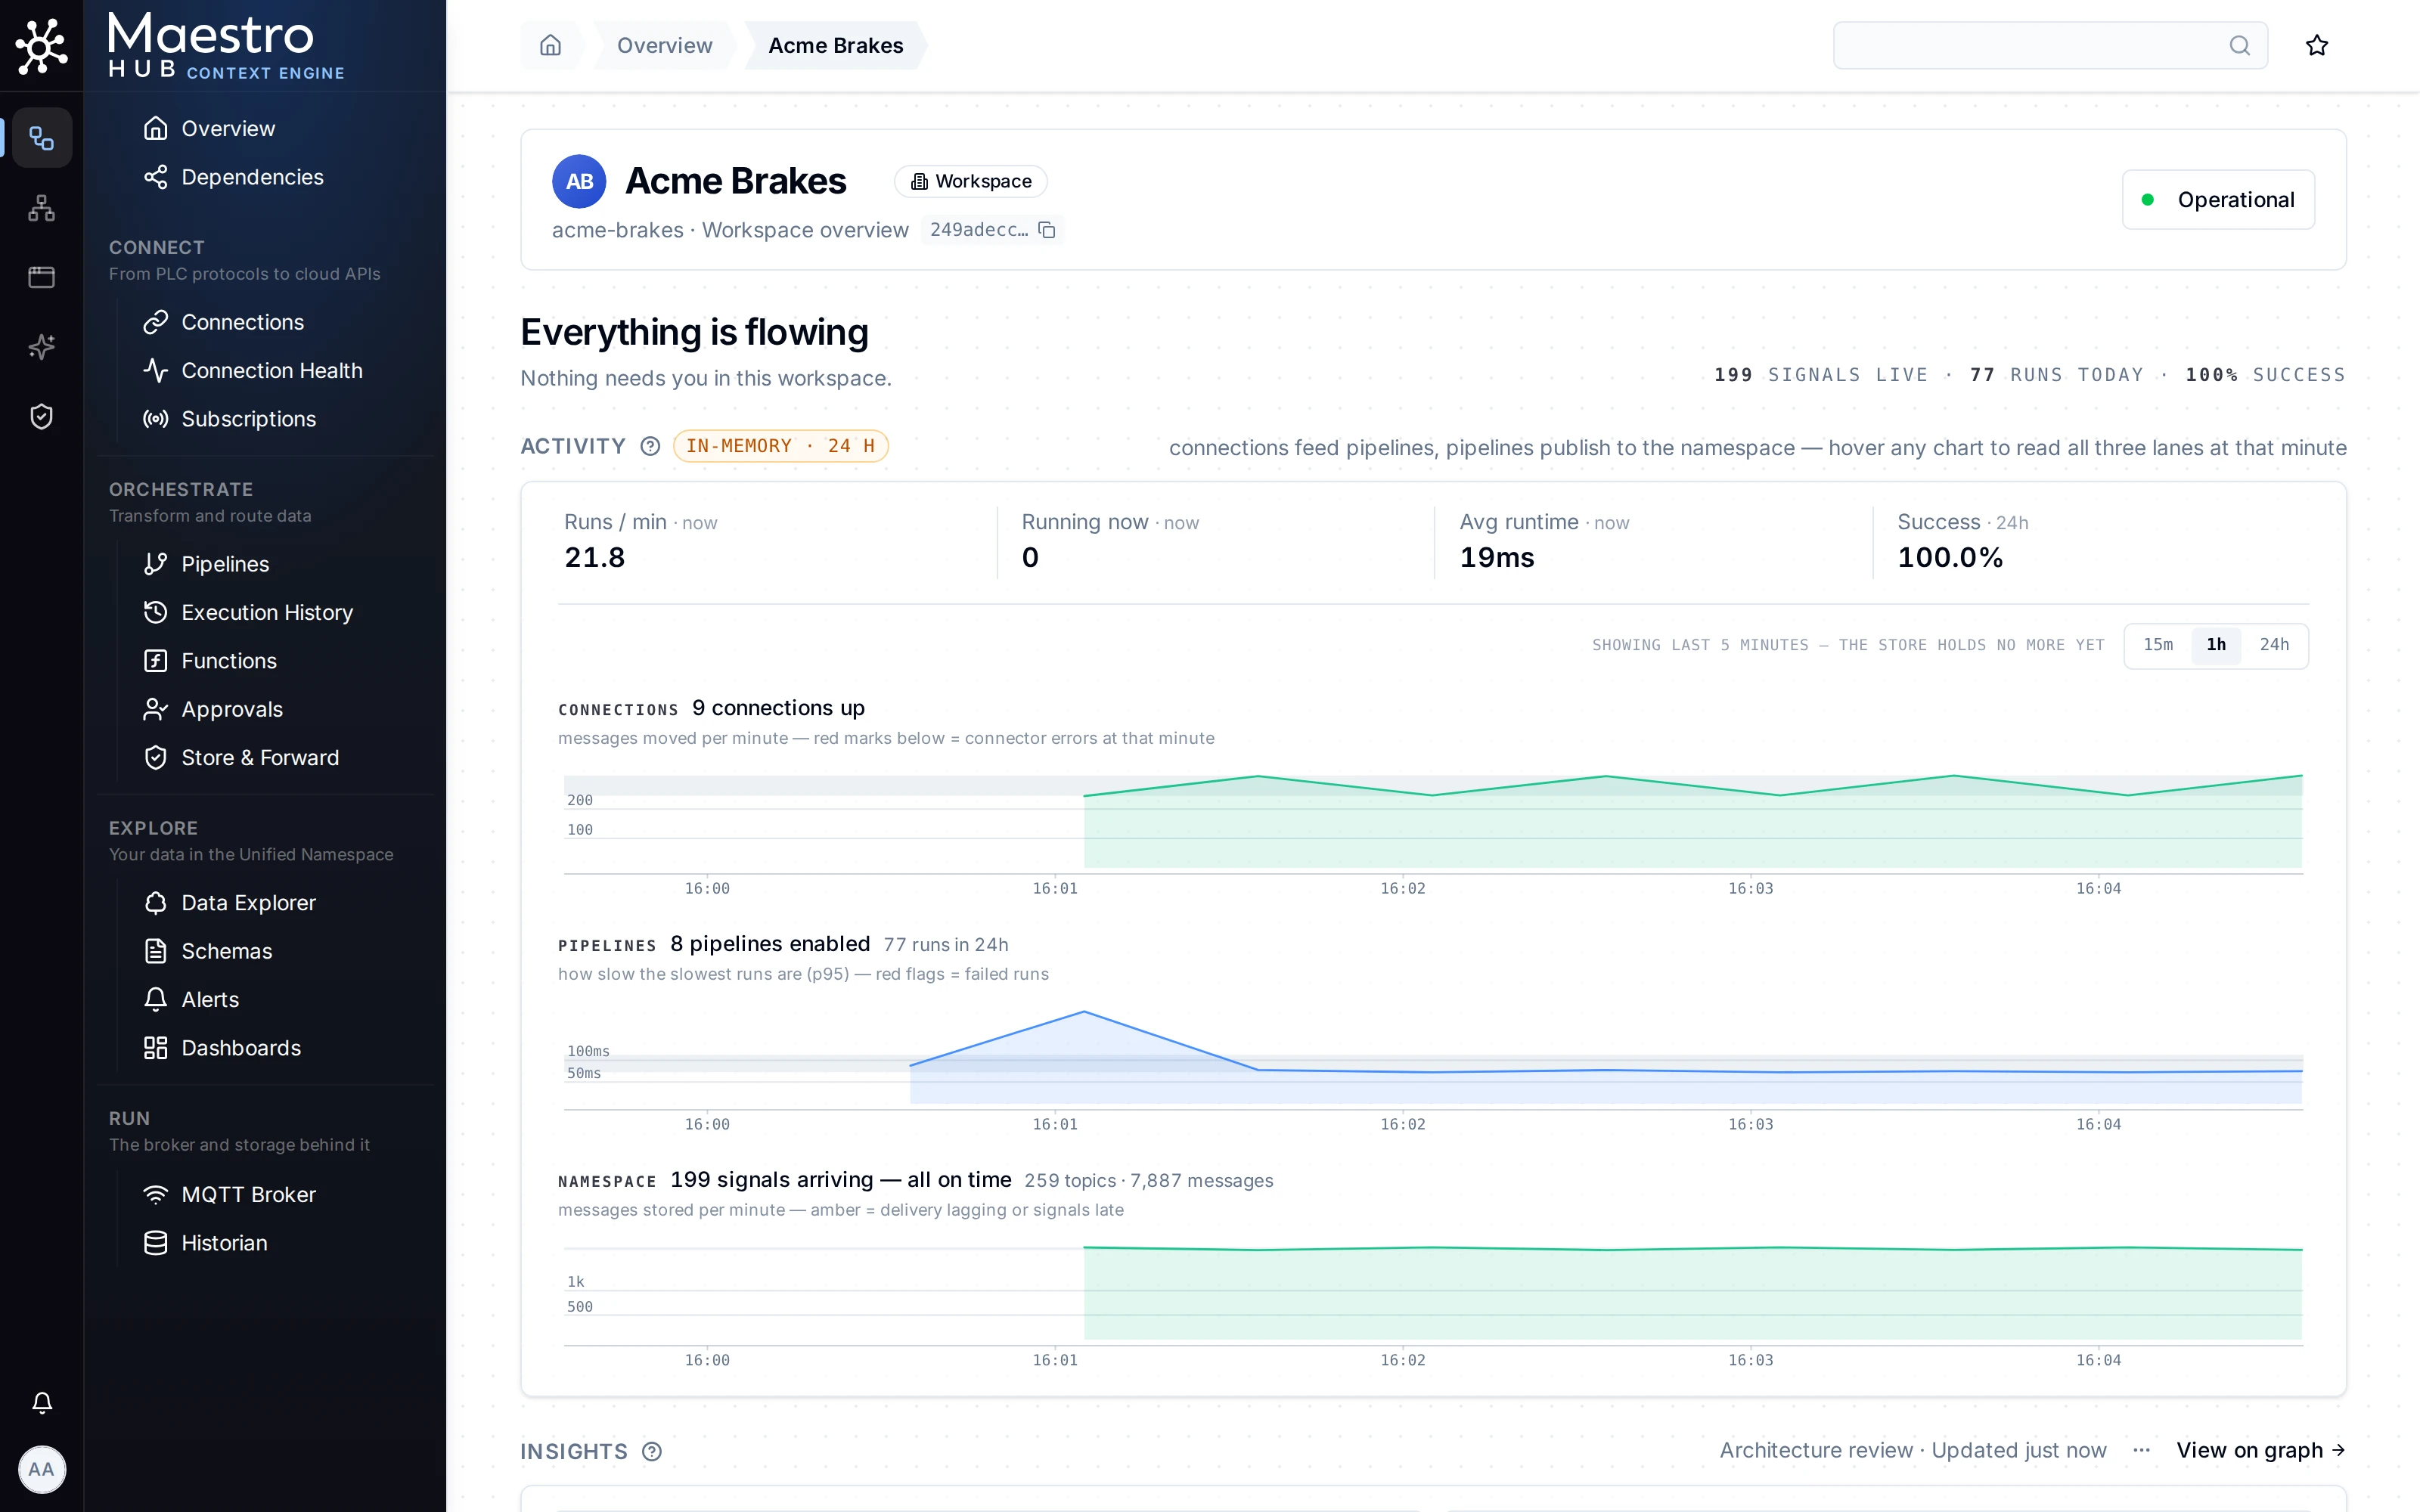
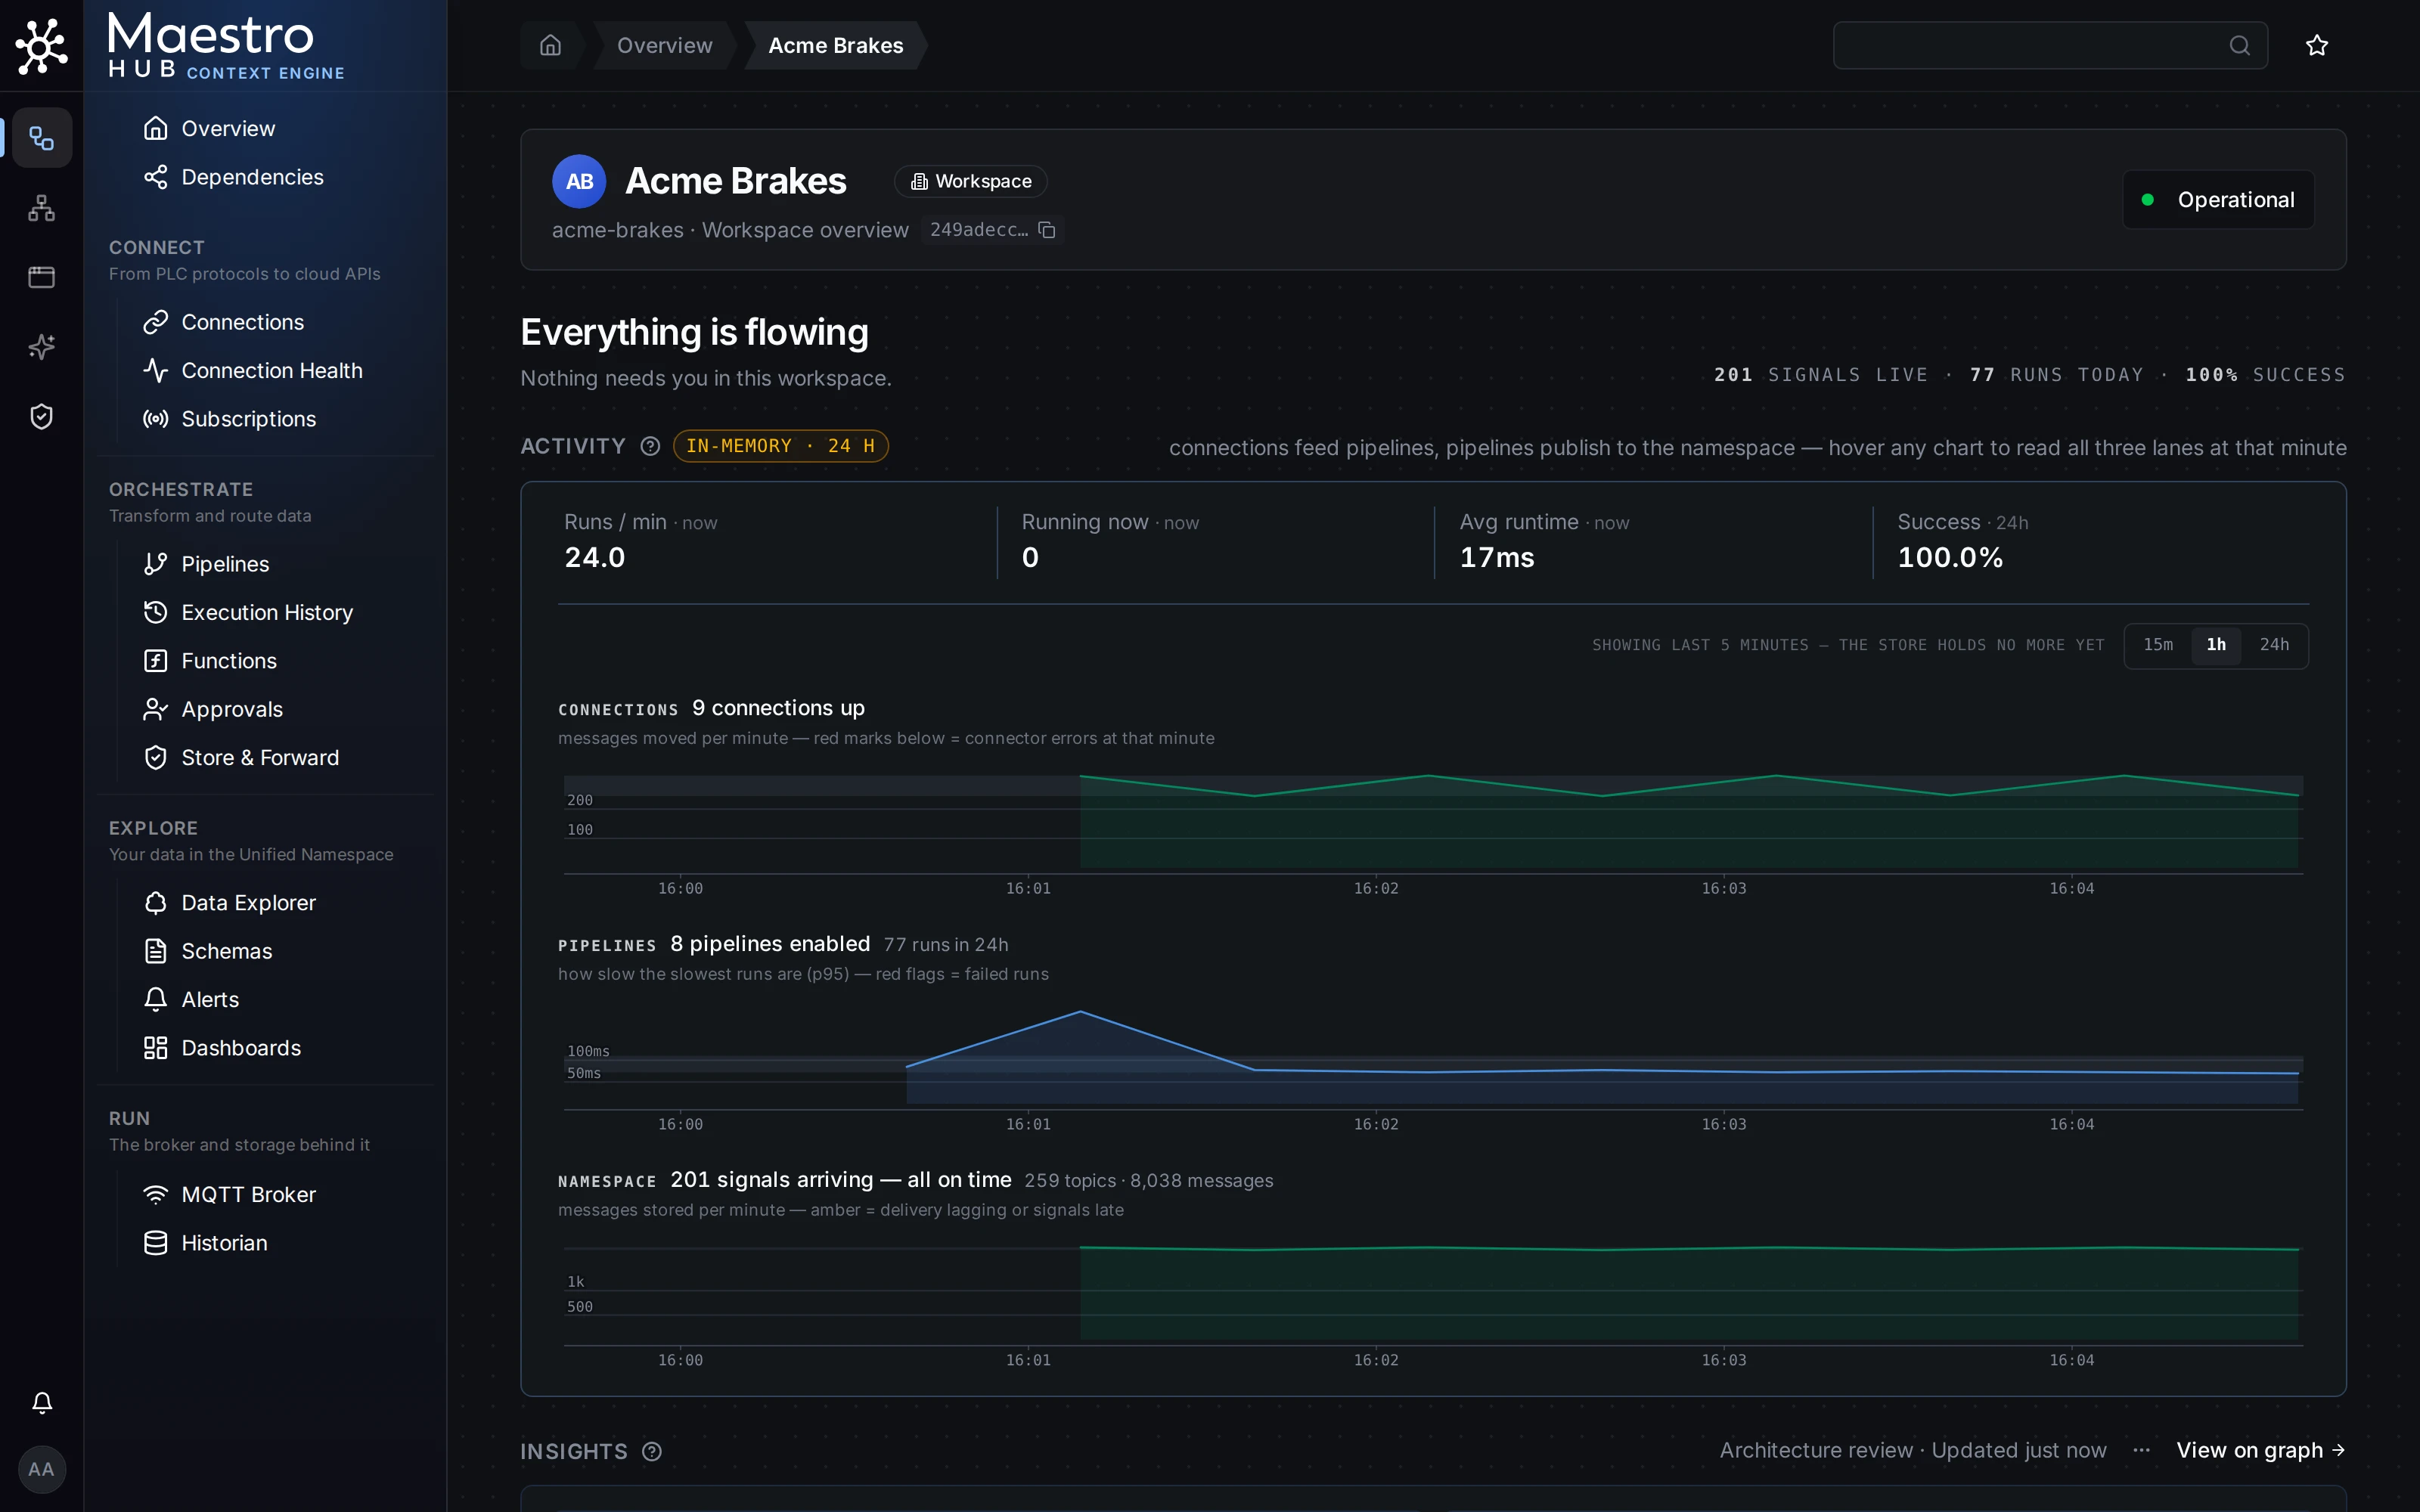
A workspace Overview with nothing needing attention, and its Activity charts on the 1h range
Deployments whose monitoring runs on Prometheus (monitoring providerType: prometheus, as in the Enterprise deployment configurations) show a different workspace Overview: a status bar sums up the cluster, connections, message broker, historian and services, and Connections, Pipelines and Unified Namespace cards take the place of Needs attention, Activity and Insights.
Insights
Insights lists parts of your setup worth a look, grouped by urgency: Now (silent breakage: something is likely failing without raising an error), Soon (structural risk) and Later (hygiene, such as a connection nothing uses). A disabled pipeline that other parts still depend on, or a dashboard that reads topics whose publishing pipelines are all disabled, shows up under Now. Click View on graph to open them in Dependencies.
MQTT broker and historian health
The health of the MQTT broker, the historian and MaestroHub's own resources is not on the Overview. It is on Admin → Monitor → Platform Health, which shows:
- Core services: MQTT Broker and Historian (when the Unified Namespace is licensed), Live Updates (the connection from your browser), and Fleet Manager (when this instance is linked to one). A service that is down shows what to check and a link to its settings.
- System Resources: CPU, memory and disk usage. On a Kubernetes deployment, cluster and node figures come first and this section, renamed Application Process, covers the MaestroHub process itself.
- Workload & Messaging: the execution queue, communication between MaestroHub's modules, and the JavaScript program cache.
The instance Overview also shows a one-line platform status at the top that links to Platform Health. Both need the monitoring.metrics:read permission.
When CPU, memory or disk are flagged
The platform status and the resource rings follow the same rules, so a ring is amber or red only when the status line says so. Each replica is judged separately.
| Resource | Noted ("running warm"; the status stays green) | Warning (amber) | Critical (red) |
|---|---|---|---|
| CPU (15-minute average) | 70% | 90%, or work waiting for a core | Work waiting a minute or more for a core |
| Memory (15-minute average) | 70% | 90%; tasks stalled waiting for memory more than 10% of the time; or steady growth that reaches 95% within 24 hours | 95%, or tasks stalled more than 40% of the time |
| Disk (by when it is full) | Full within 7 days at the current rate | Full within 24 hours, or free space below twice the floor | Full within 4 hours, or at the floor (new values are refused) |
- Inside a container (Docker, Kubernetes), CPU and memory are measured against the container's own CPU and memory limits, not the host's.
- Spikes don't count. A reading must hold across the 15-minute average. A level is only left once the reading falls 5 points below its line, so a reading sitting on a line does not flip the status back and forth.
- Notifications: a warning or critical level also sends a notification to everyone with
monitoring.metrics:read, and sends another if it worsens from warning to critical (for example, the disk is now hours from full instead of a day). A "running warm" note never sends one. Each issue sends a "Resolved" notification once it clears. - Disk is judged by time, not percent. The forecast follows the last 6 hours (the last 24 hours for the 7-day note). A large disk at 94% that is not filling up is fine; a small one filling fast is flagged early.
Every line can be changed under modules.monitoring.resourceLevels in config.yaml. A line set to 0 is off.
modules:
  monitoring:
    resourceLevels:
      window: 15m
      cpu: { info: 70, warning: 90 }
      memory: { info: 70, warning: 90, critical: 95 }
      memoryPressure: { warning: 10, critical: 40 }
      memoryGrowthWithin: 24h
      disk: { infoWithin: 168h, warningWithin: 24h, criticalWithin: 4h }
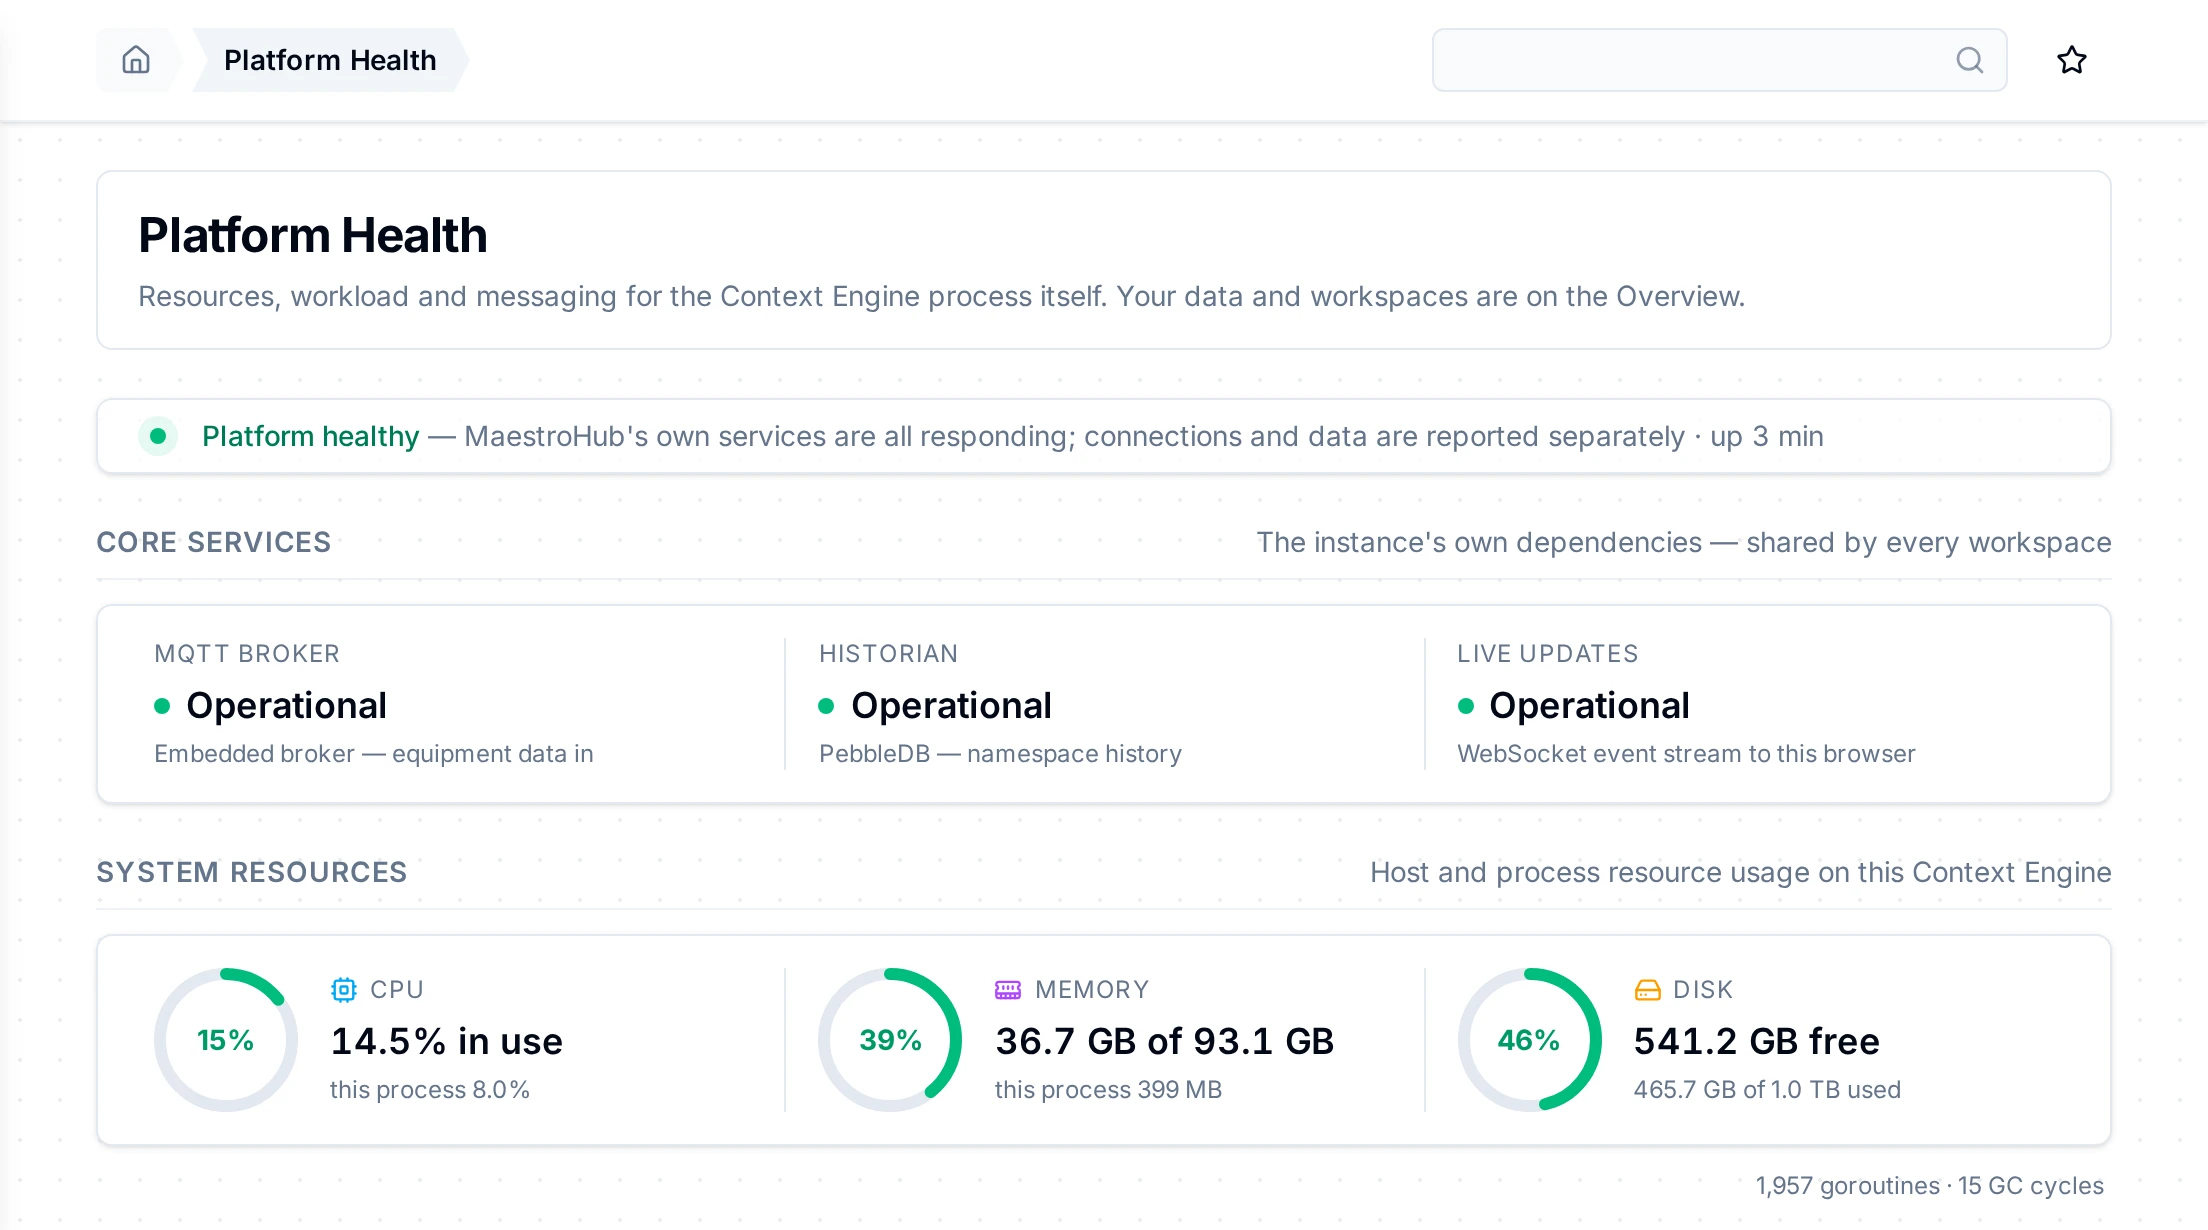
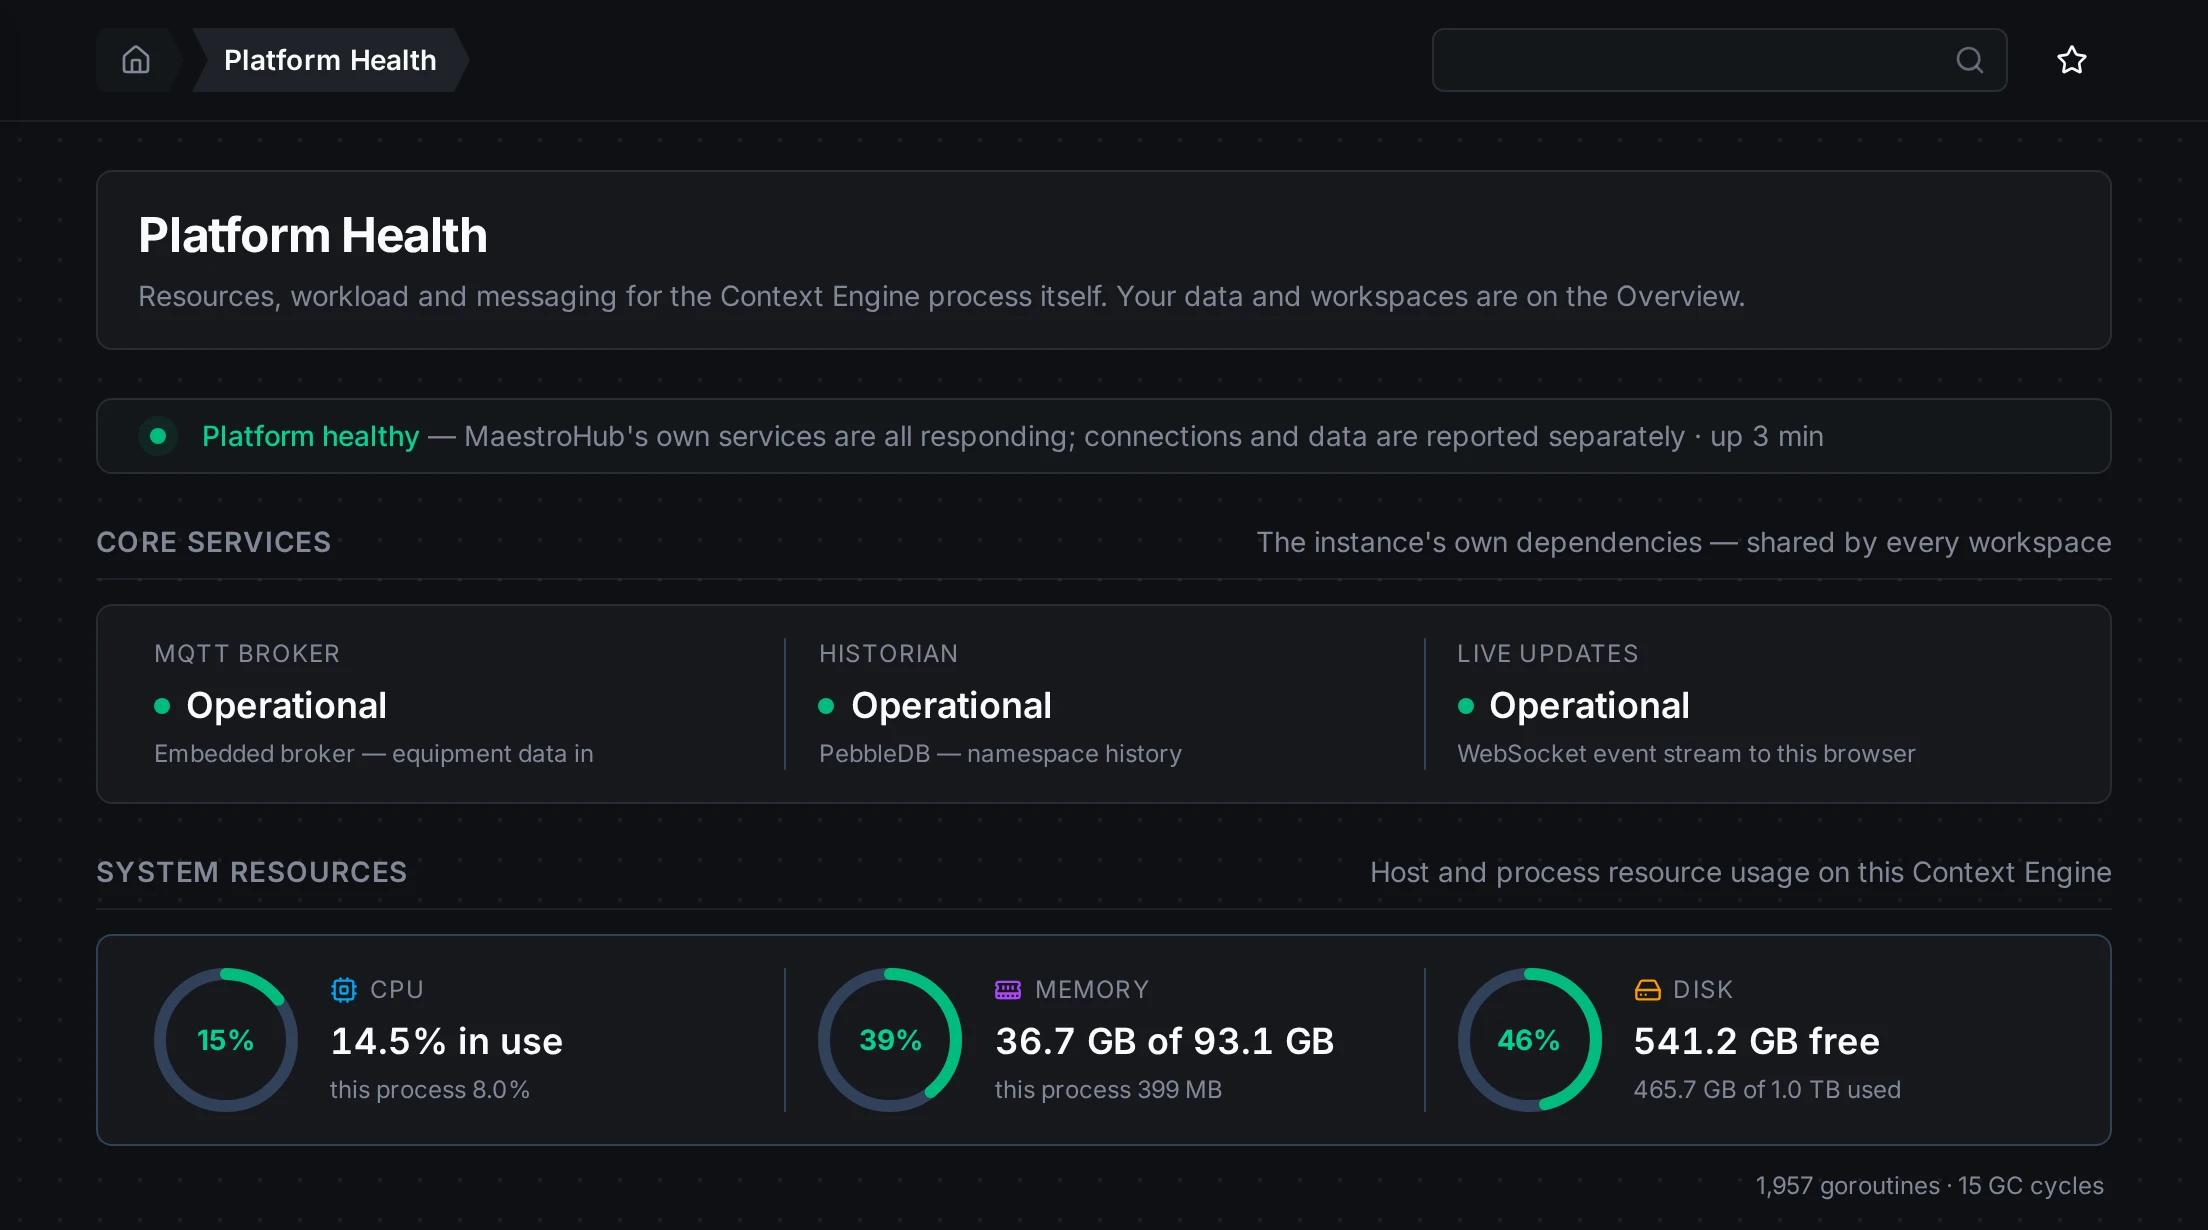
Admin › Monitor › Platform Health: core services and system resources
System Logs
Navigation: Admin → Monitor → Logs
Overview
The System Logs page shows the log records of MaestroHub's own services: startup, the modules, storage, the message broker and the historian. Open it when the platform itself misbehaves, or when support asks for the lines around a problem. A failed pipeline run is explained in Execution History, a dropped connection in Connection Health, and a change someone made in the Audit Trail.
Reading logs needs the log:read permission. Platform administrators see every line. A Workspace Administrator, or any role that grants log:read within a workspace, sees only that workspace's lines; the page then says that platform-wide lines (startup and system services) and other workspaces' lines are left out.
The badges next to Refresh show whether the log store is reachable (Healthy or Unhealthy) and which store the page reads.
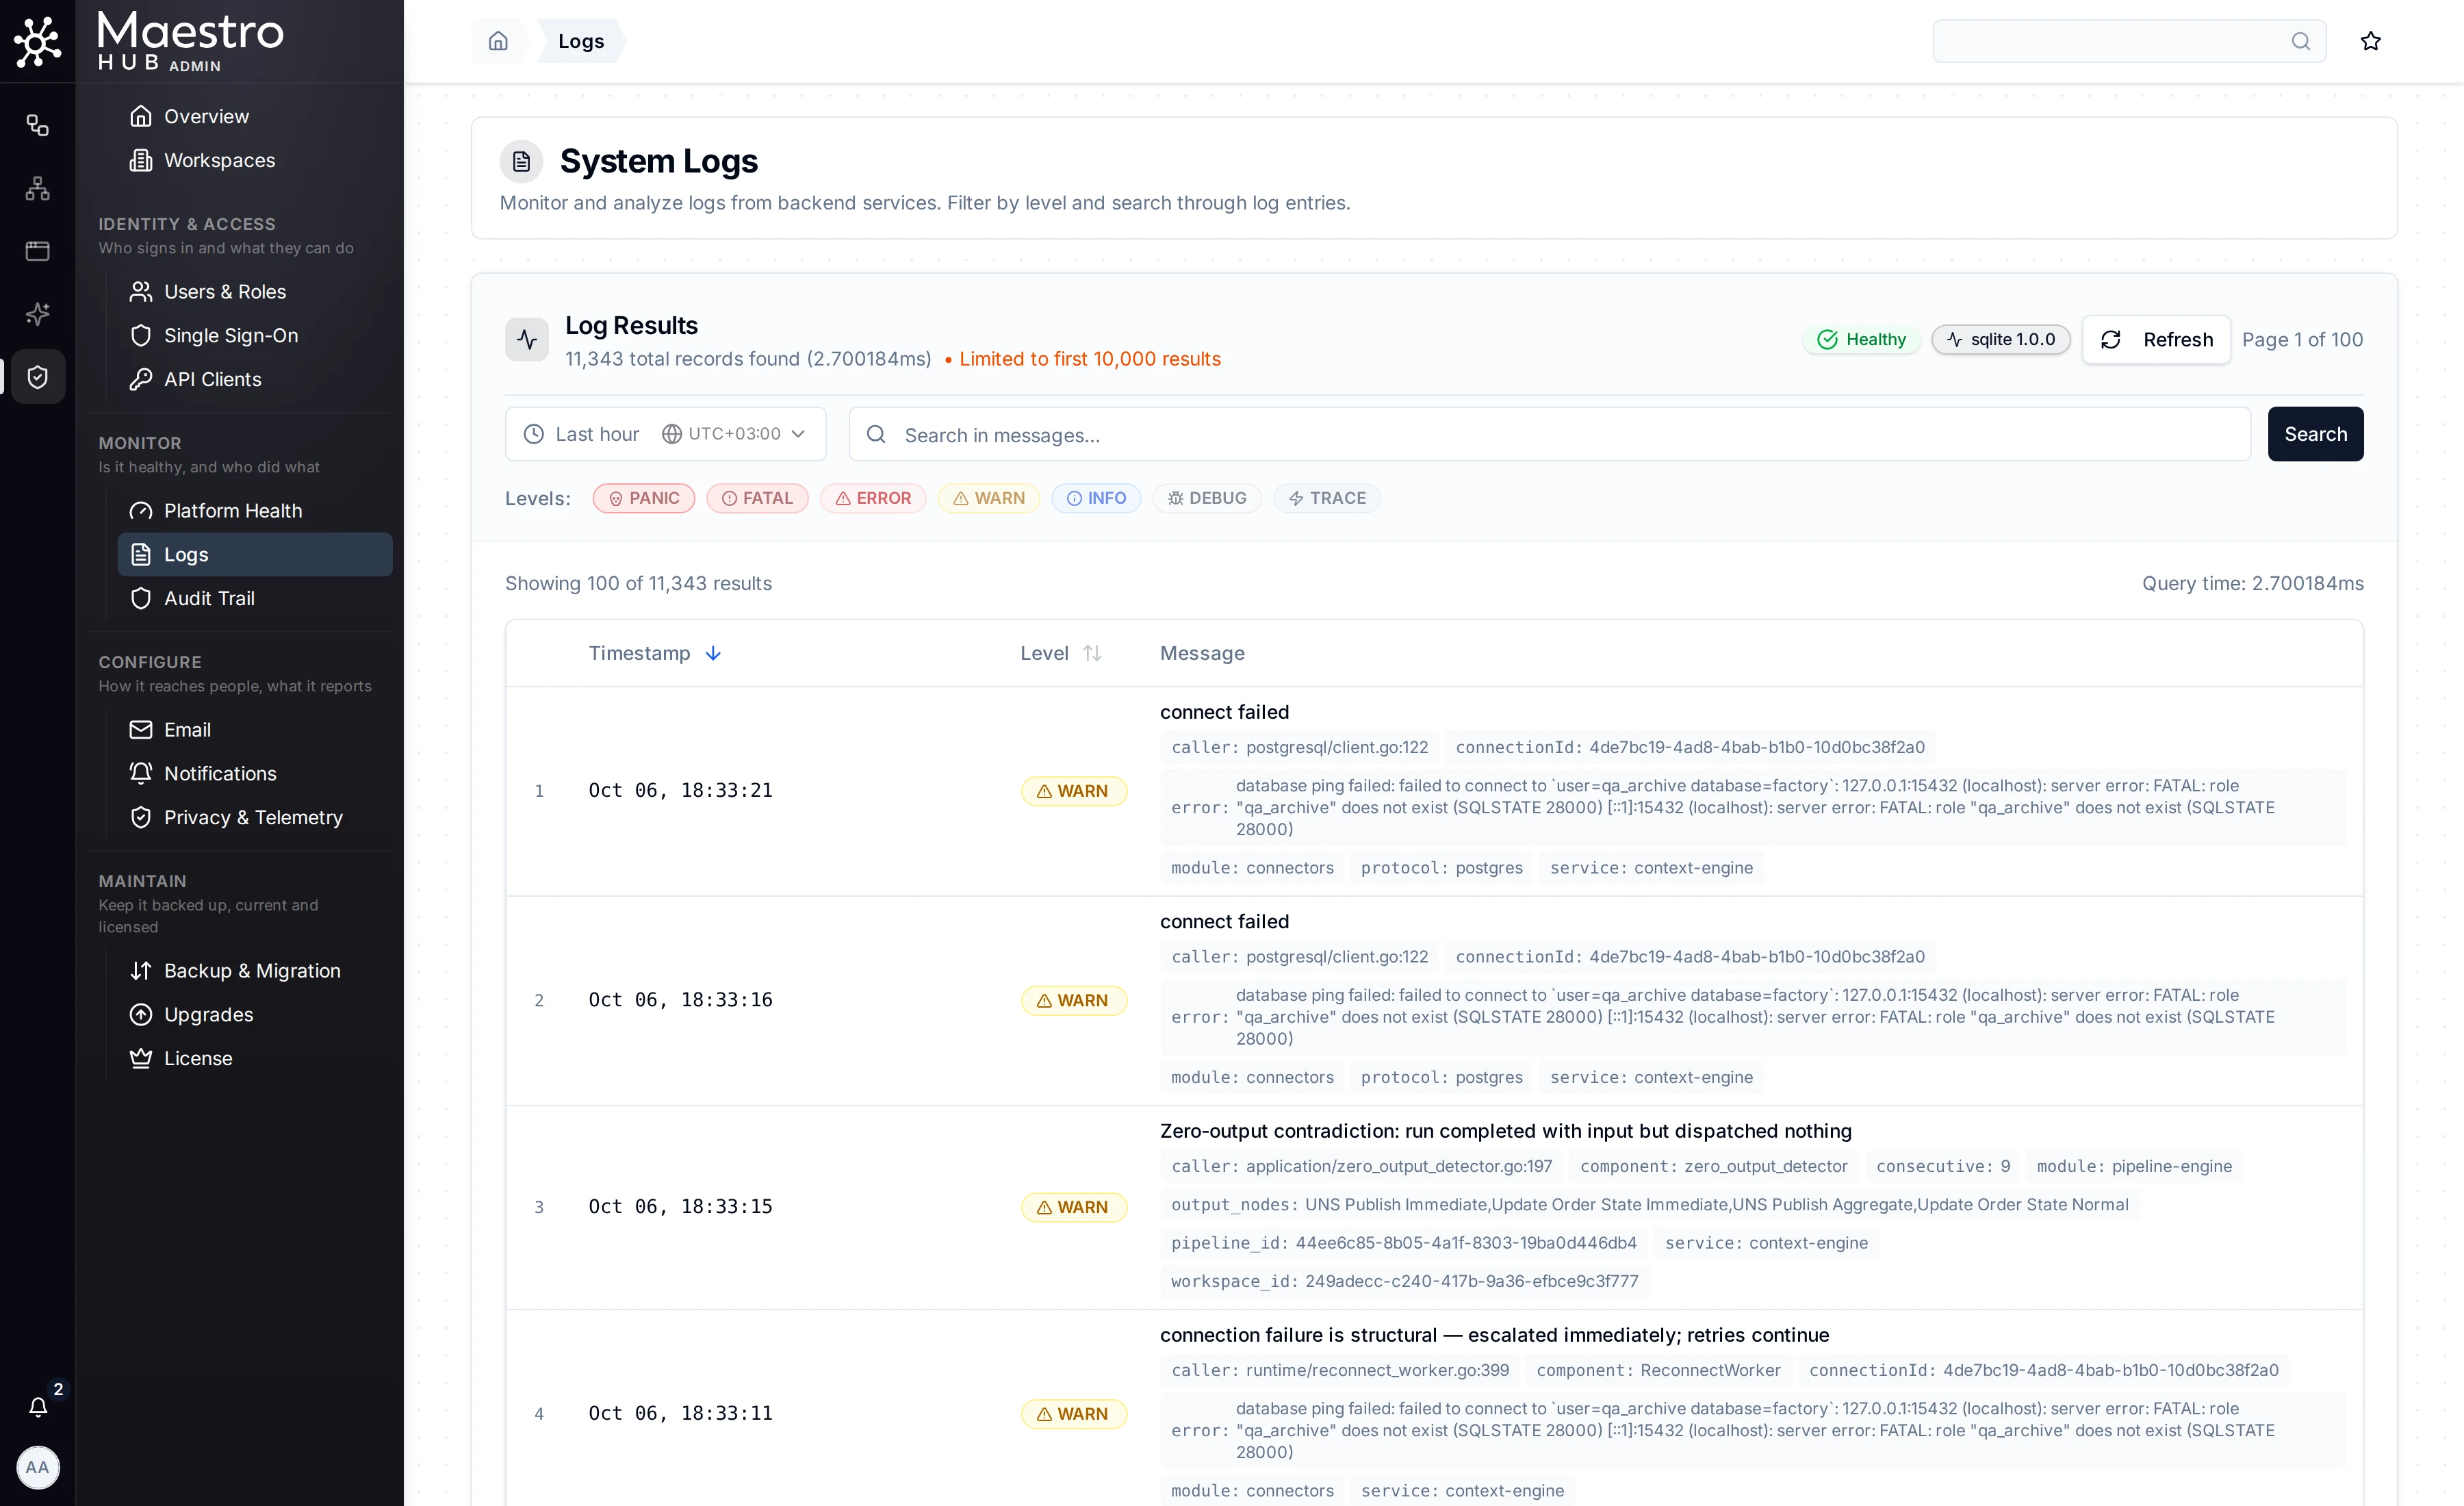
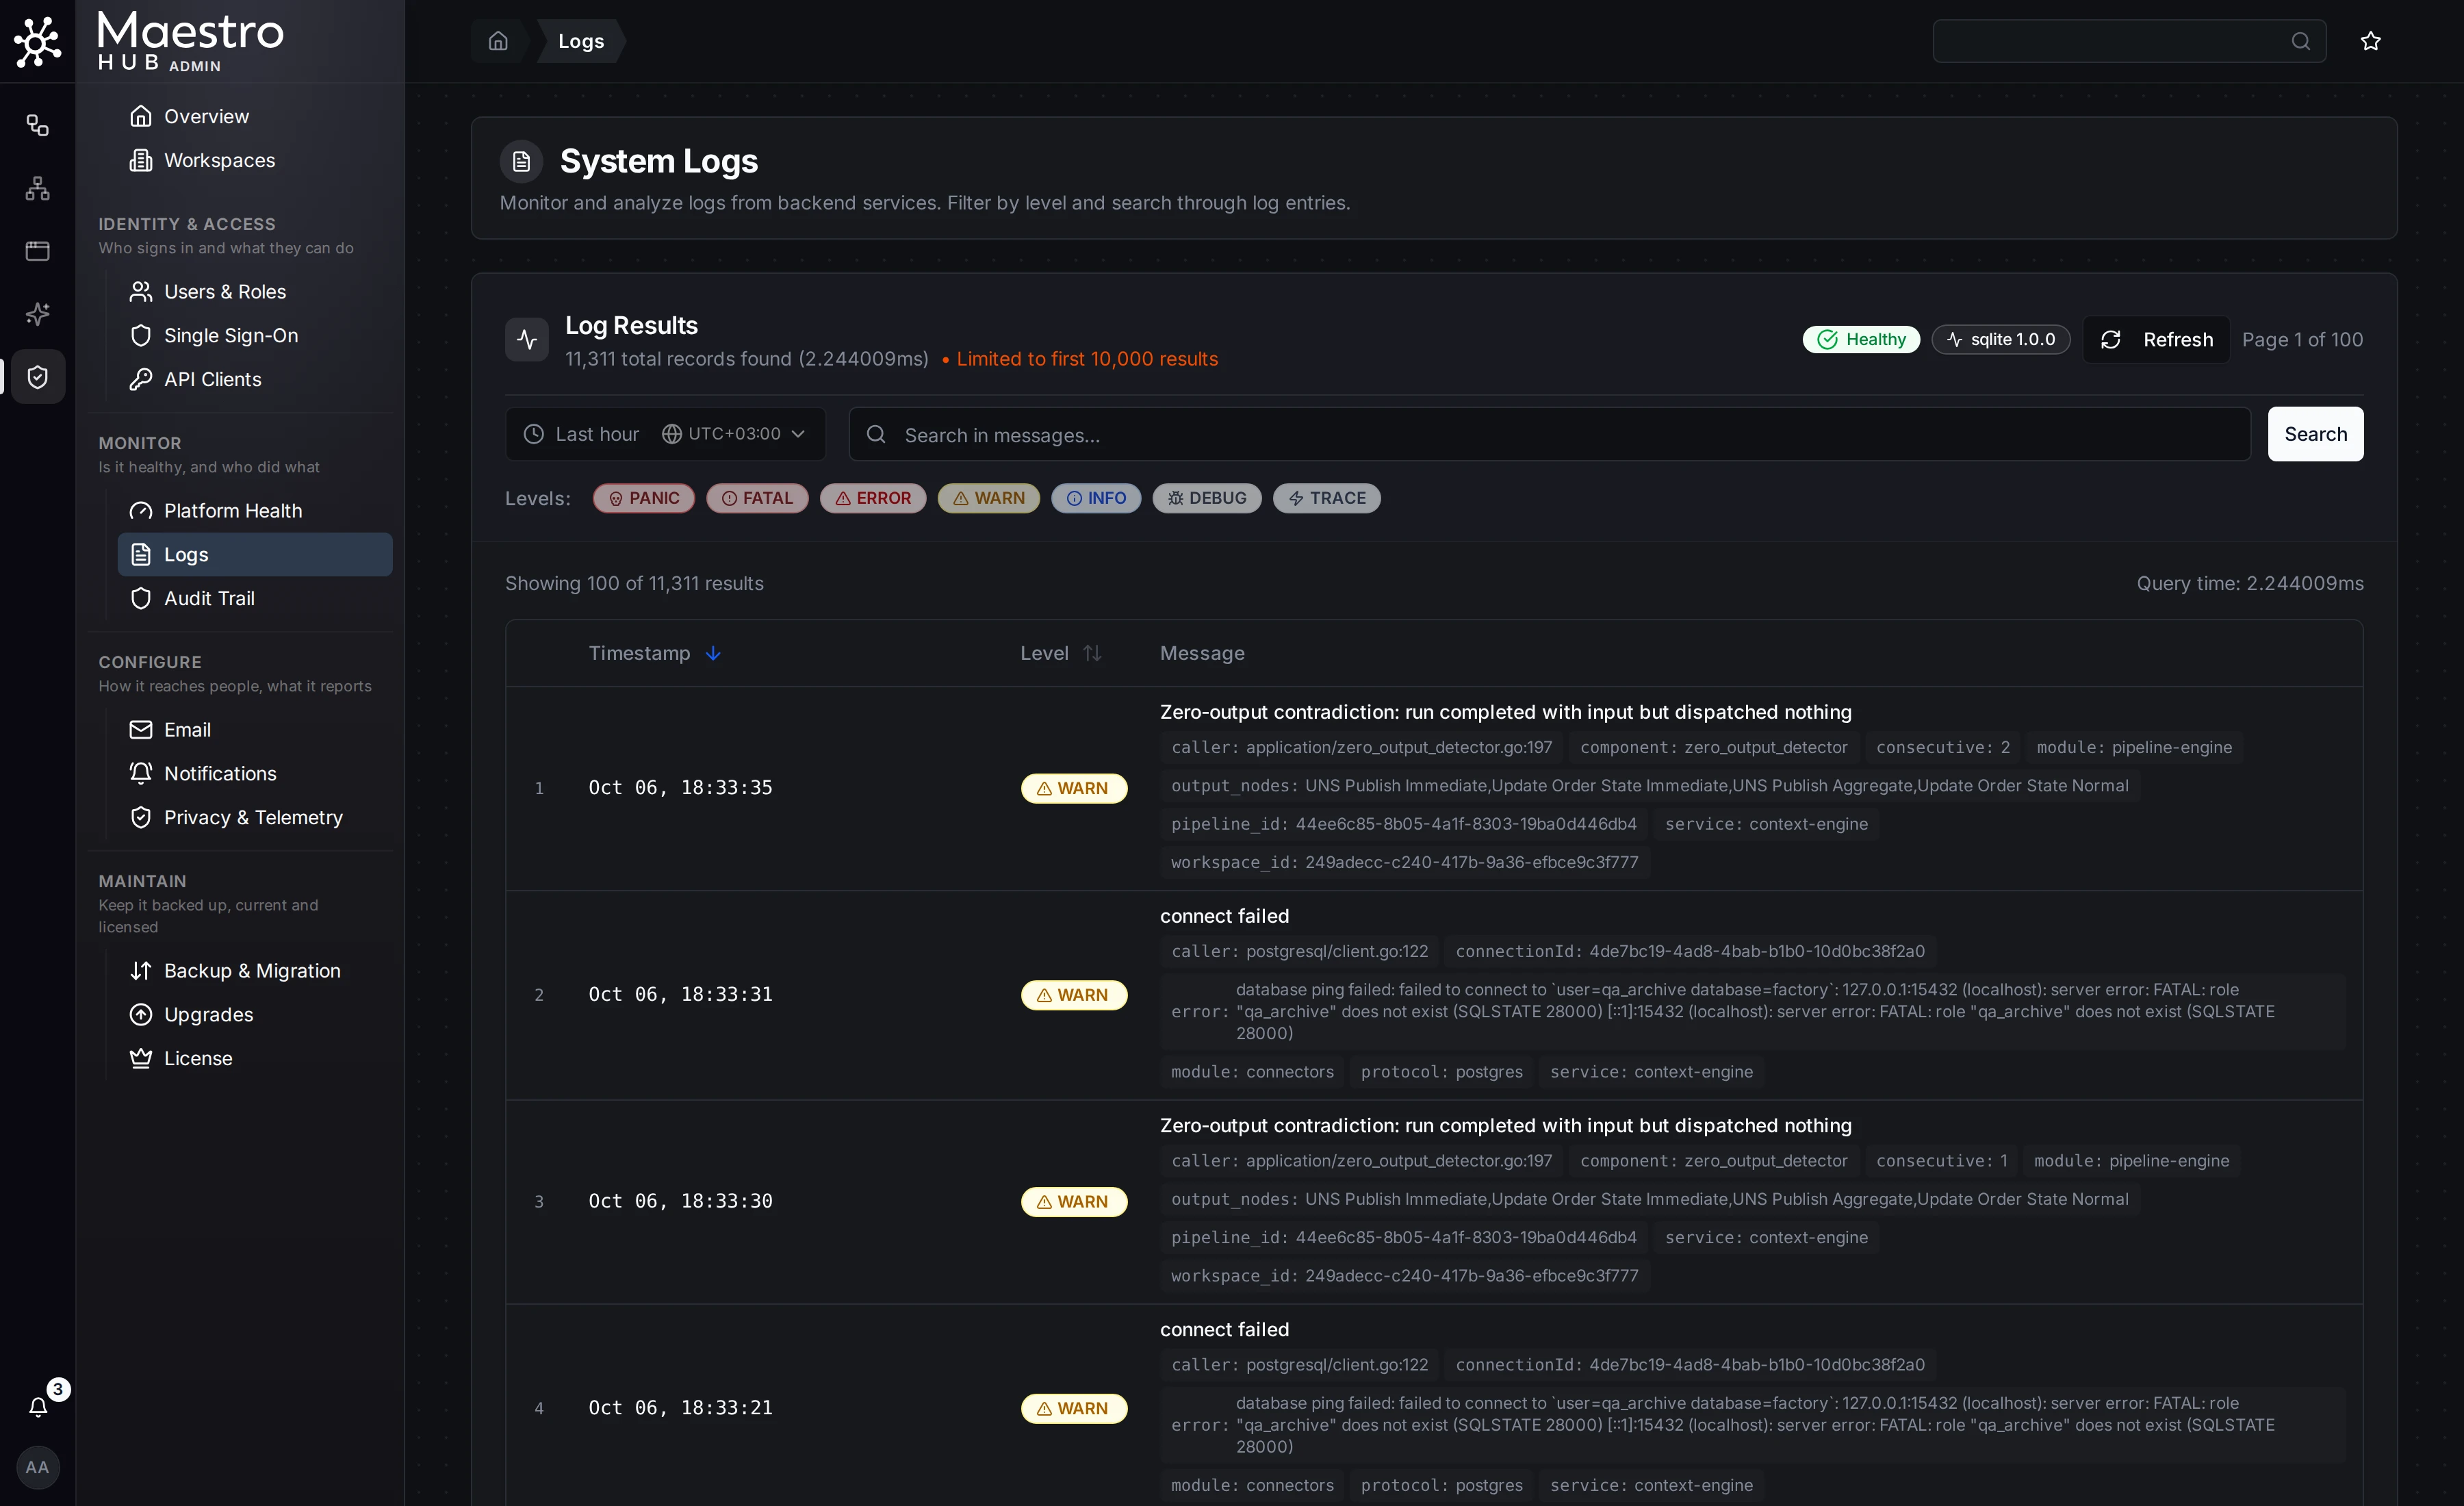
System Logs for the last hour: time range, search, level filter chips, and the newest lines first.
When the deployment stores its logs in Elasticsearch (modules.logs.provider: elasticsearch), the page is a log explorer instead, with Application and Access views, service and level filters in a sidebar, a volume chart, and live tail. The rest of this section describes the default page.
Time Range
Every log query requires a time range. The page opens on Last hour. Presets are available for quick selection, or you can define a custom window.
| Preset | When to Use |
|---|---|
| Last 15 minutes | Quick check for recent activity or to verify an operation you just performed. |
| Last hour | Standard troubleshooting starting point when you are not sure when the issue occurred. |
| Last 6 hours | Investigating intermittent or recurring problems that do not appear in shorter windows. |
| Last 24 hours | Full-day analysis for pattern recognition or investigating issues reported hours ago. |
| Custom range | Specify exact start and end date/time for precise investigation. |
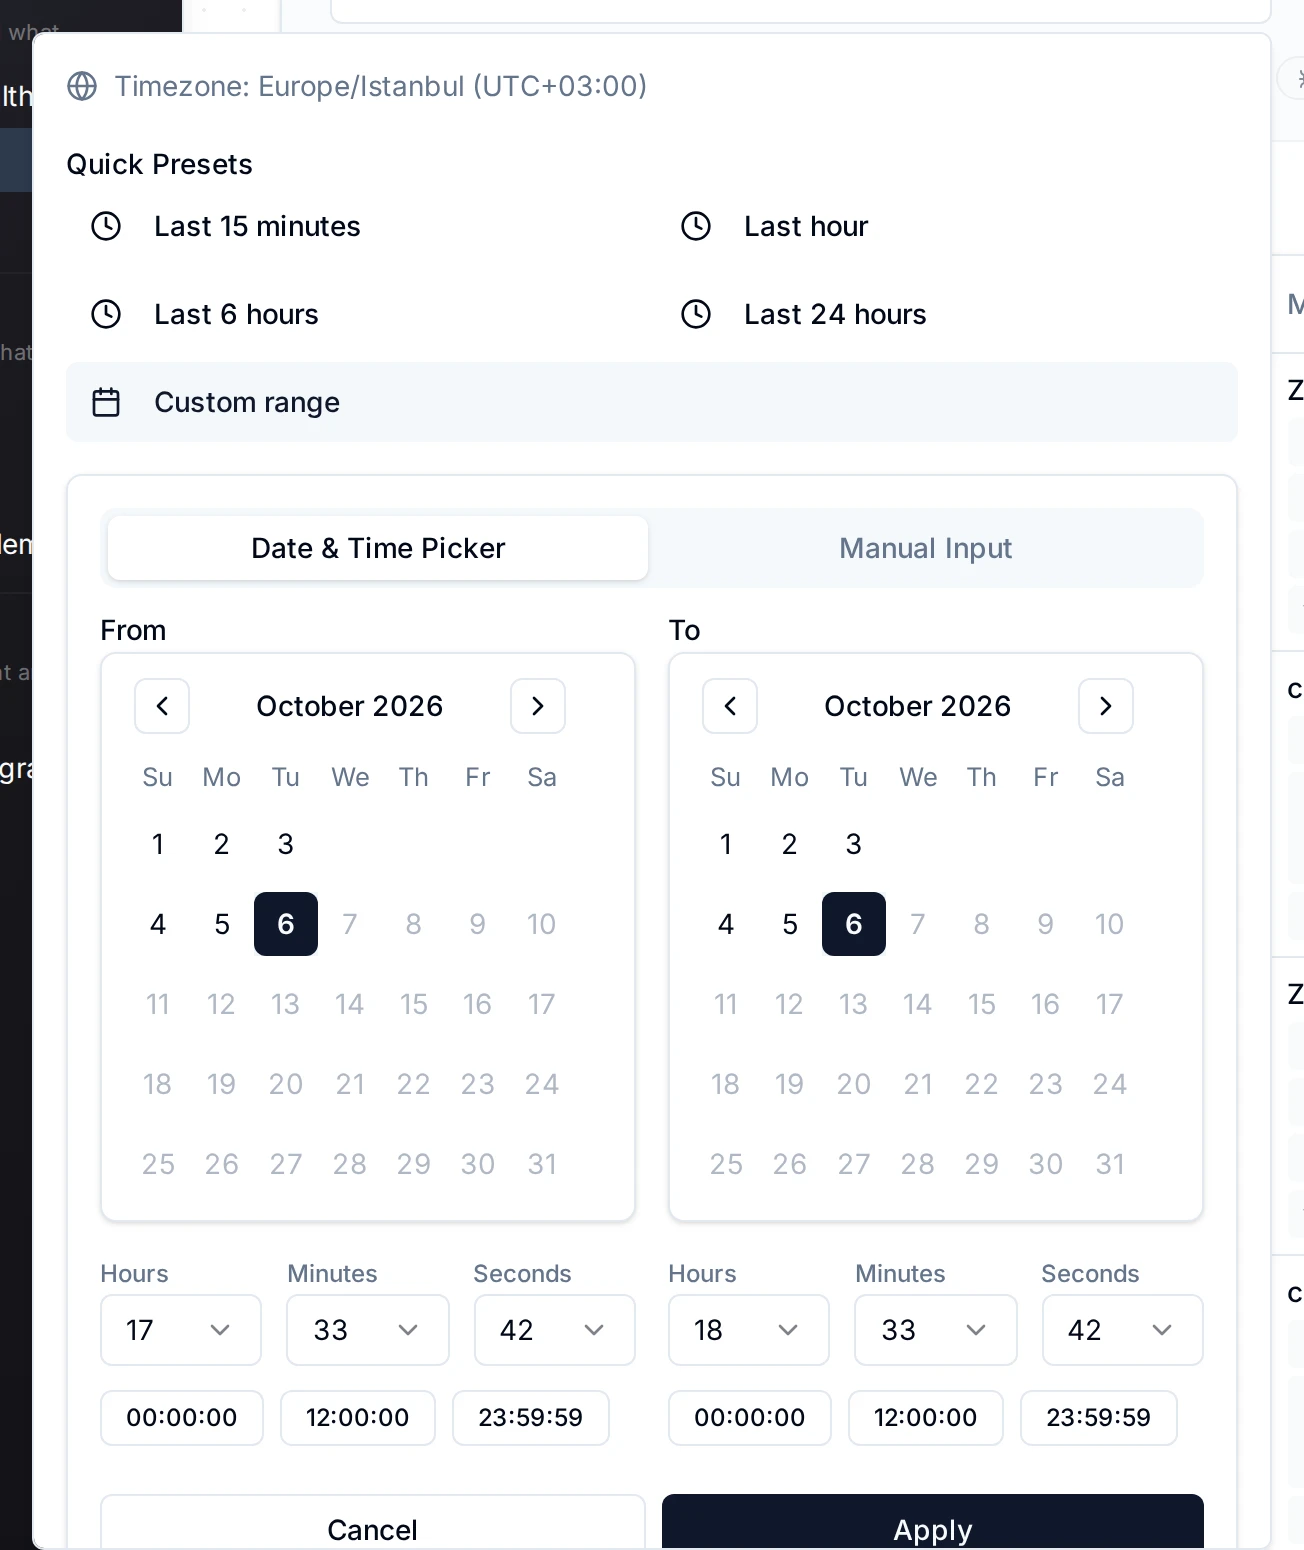
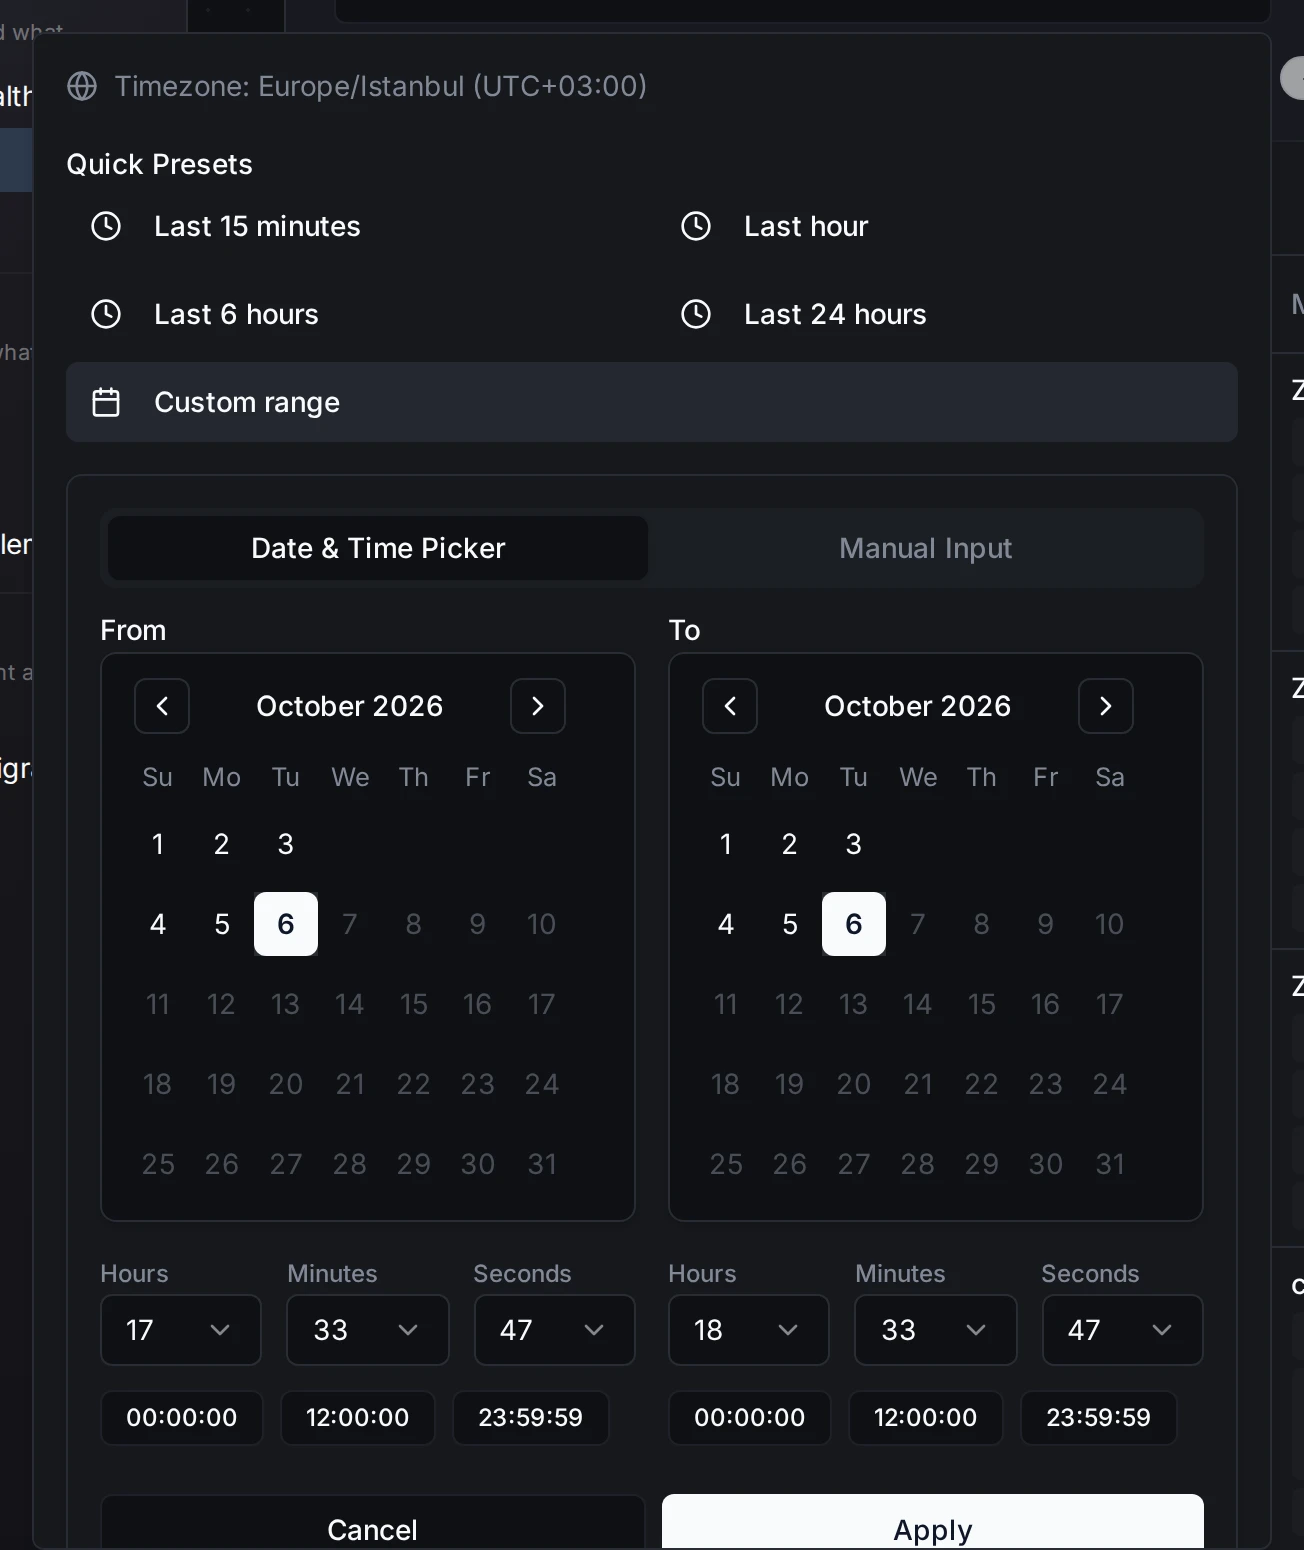
Time range presets and custom range picker for filtering logs.
The custom range picker includes a calendar for date selection, hour/minute/second fields, quick-set buttons (00:00:00, 12:00:00, 23:59:59), and timezone display with UTC offset.
The page does not refresh by itself, and a preset's window is fixed at the moment you pick it: Refresh runs the same window again. To include lines written since, pick the preset again.
Search
The search bar matches text anywhere in a log line, including its context tags, so you can paste a module name, a connection ID or a trace ID to find the lines about it. Type a keyword or phrase and press Enter or Search. Search is case-insensitive and works together with level filters and the selected time range: all criteria apply simultaneously. Clear the search with the X button to reset results.
Level Filter Chips
Below the search bar, clickable level chips filter logs by severity. Multiple levels can be selected at the same time. When no level is selected, all levels are shown. Clear removes the level filter and the search.


Level chips: PANIC, FATAL, ERROR, WARN, INFO, DEBUG, and TRACE.
| Level | Description | When to Focus |
|---|---|---|
| PANIC | System-wide failure that may cause the service to become unresponsive. | Immediate investigation. Rare but critical. |
| FATAL | Critical failure that stops a service component. | Immediate investigation. Check whether the affected function is required for your workflow. |
| ERROR | Operation failures: failed connections, execution errors, timeouts. | Primary troubleshooting level. Start here when diagnosing issues. |
| WARN | Potential problems: retry attempts, deprecation warnings, approaching limits. | Monitor regularly. Warnings often precede errors. |
| INFO | Normal operations: successful connections, completed executions, status updates. | Use to confirm expected behaviour. |
| DEBUG | Detailed internal diagnostics: request/response payloads, intermediate steps. | Deep troubleshooting when ERROR and WARN lack context. |
| TRACE | Step-by-step execution traces at the lowest level. | Specific deep investigations only. Very high volume. |
Log Table
| Column | Description |
|---|---|
| Timestamp | When the event occurred, in MMM DD, HH:mm:ss.SSS format. Sortable. |
| Level | Severity badge with color coding. Sortable. |
| Message | Primary log content describing what happened. |
Below the message, each line shows its context as tags. Which tags appear depends on the service that wrote the line, and some modules spell the same field differently (for example pipeline_id and pipelineId). Common ones:
| Tag | Purpose |
|---|---|
service / module | The part of MaestroHub that wrote the line. |
caller | The source file and line that wrote it. |
connectionId | Identify the connection involved. |
pipeline_id / pipeline_name | Identify the pipeline involved. |
error | Detailed error description or stack trace. |
trace_id / span_id | Correlate the lines written while handling one request. |
Click a trace_id tag to show only the lines of that trace. This filter is not shown on the page; to remove it, select any level chip and then Clear.
Pagination
| Setting | Value |
|---|---|
| Page size options | 50, 100 (default), 250, 500 records per page |
| Maximum result window | 10,000 records: the header says the results are limited to the first 10,000, and when you reach that point an orange "10K limit reached" badge appears and further pagination is disabled |
If you hit the 10,000 record limit, narrow the time range, add level filters, or use specific search terms to reduce the result set.
Pipeline Troubleshooting
MaestroHub provides several tools for monitoring and debugging pipelines: in the Pipeline Designer, an Execution History sidebar, an Execution Replay mode and a Pipeline Metrics panel; and the Execution History page for runs across all pipelines.
Execution History Sidebar
Navigation: Pipeline Designer → History (toolbar)
Click History in the pipeline toolbar to open a sidebar on the right showing the executions of the current pipeline. The sidebar auto-refreshes every 10 seconds with a visible countdown. Loading more entries pauses the auto-refresh; click the refresh button to start it again.
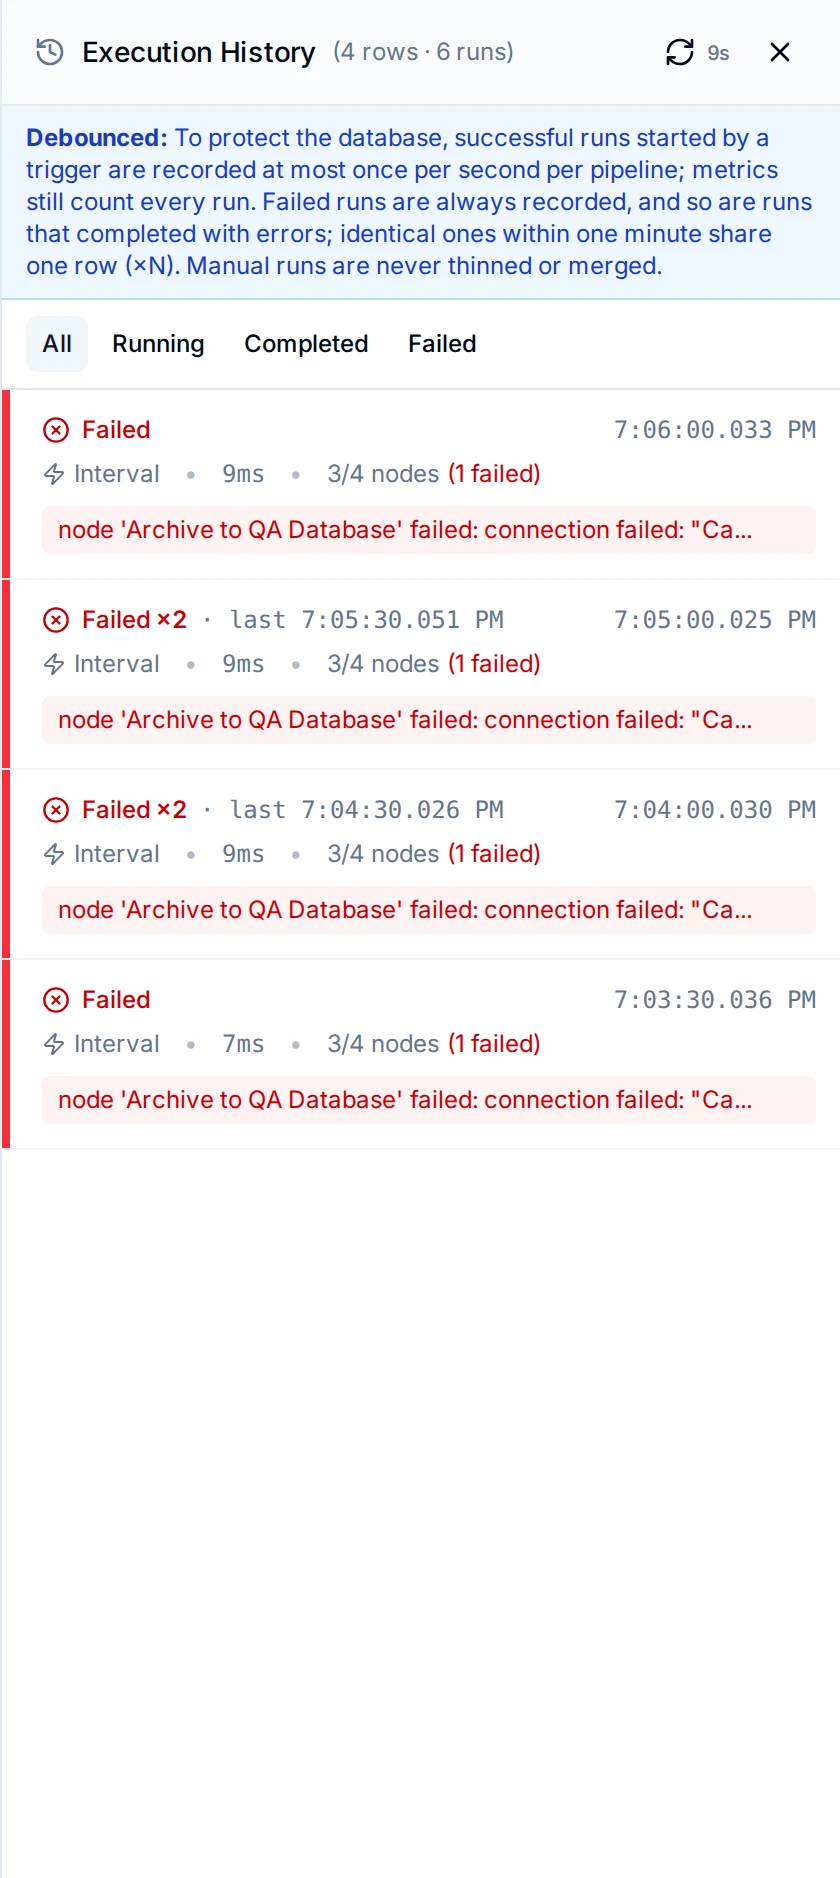
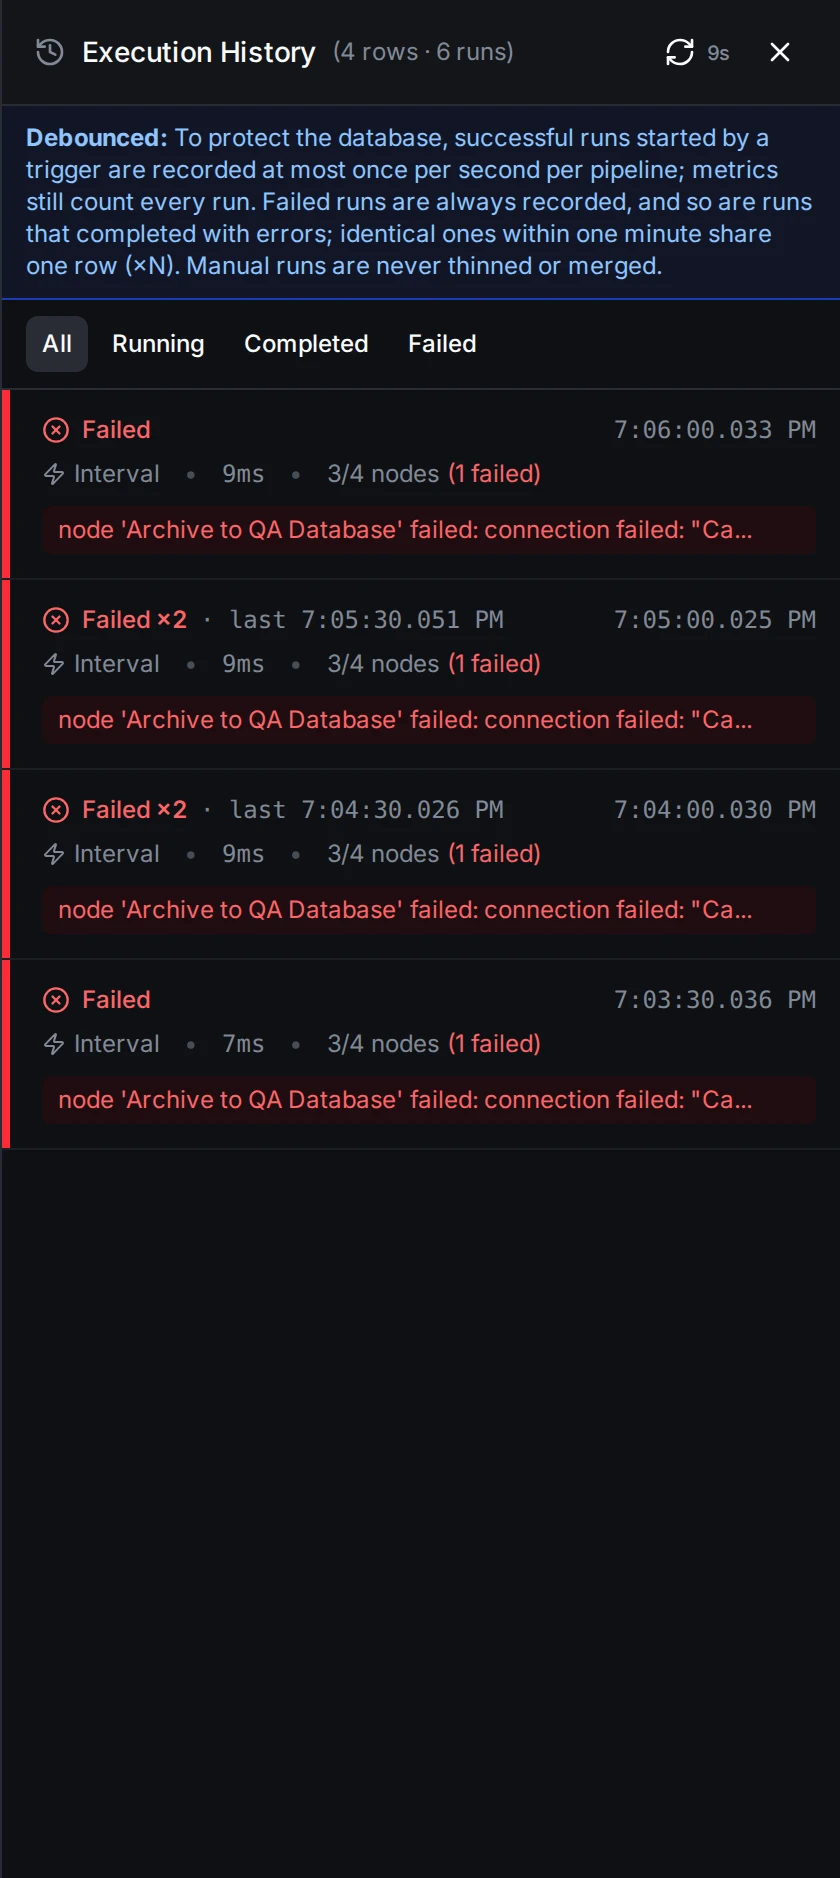
Execution History sidebar showing recent pipeline runs with status, trigger type, duration, and node counts.
Not every run gets a row. A note at the top of the sidebar says why:
- At most one successful run per second is recorded for a pipeline, whatever its Execution History Detail setting. A pipeline that runs many times a second shows only a sample of its successful runs; Pipeline Metrics still count every run. Failed runs, runs that completed with errors, and manual runs are always recorded.
- Identical failures within one minute (the same node failing with the same error) are stored as one row with a count, Failed ×N. Runs that completed with errors are grouped the same way, as Completed with Errors ×N, never in the same row as runs that failed. Hover the row for the first and last time. A manual run always gets its own row.
- With Execution History Detail set to None, only failed runs and runs that completed with errors are recorded.
Filters: Use the status tabs (All, Running, Completed, Failed) to narrow the list. Failed also lists runs that completed with errors (a node failed but the pipeline was set to continue), shown with a yellow With errors stripe.
Each execution row shows:
- Status indicator: colored stripe on the left (green = Completed, red = Failed, blue = Running, yellow = With errors (completed with errors), gray = Queued, orange = Cancelled)
- Time: when the execution started, with full date in tooltip
- Trigger type: an icon and the trigger's name, such as Manual, Interval, Cron, Webhook or MQTT
- Duration: total execution time; "Running..." animation for active executions
- Node statistics:
X/Y nodescompleted out of the nodes in the pipeline, with failed count in red if any. A run can run fewer nodes than the pipeline has (for example, when a Buffer node is still collecting).—/Ymeans per-node results were not recorded at this run's detail level. - Error preview: first 60 characters of the error message for failed executions
- Progress bar: for running executions, how many of the pipeline's nodes have completed
To open a run in Execution Replay, hover its row and click the View on Canvas icon, or click the row to select it and then View Execution on Canvas at the bottom of the sidebar. The sidebar loads 30 executions by default; click Load More to fetch additional entries.
Execution Replay
Open a run from the sidebar, or click View on Canvas on the Execution History page, to enter Execution Replay mode. The canvas shows each node's result from that run, and a panel below the canvas shows the details.
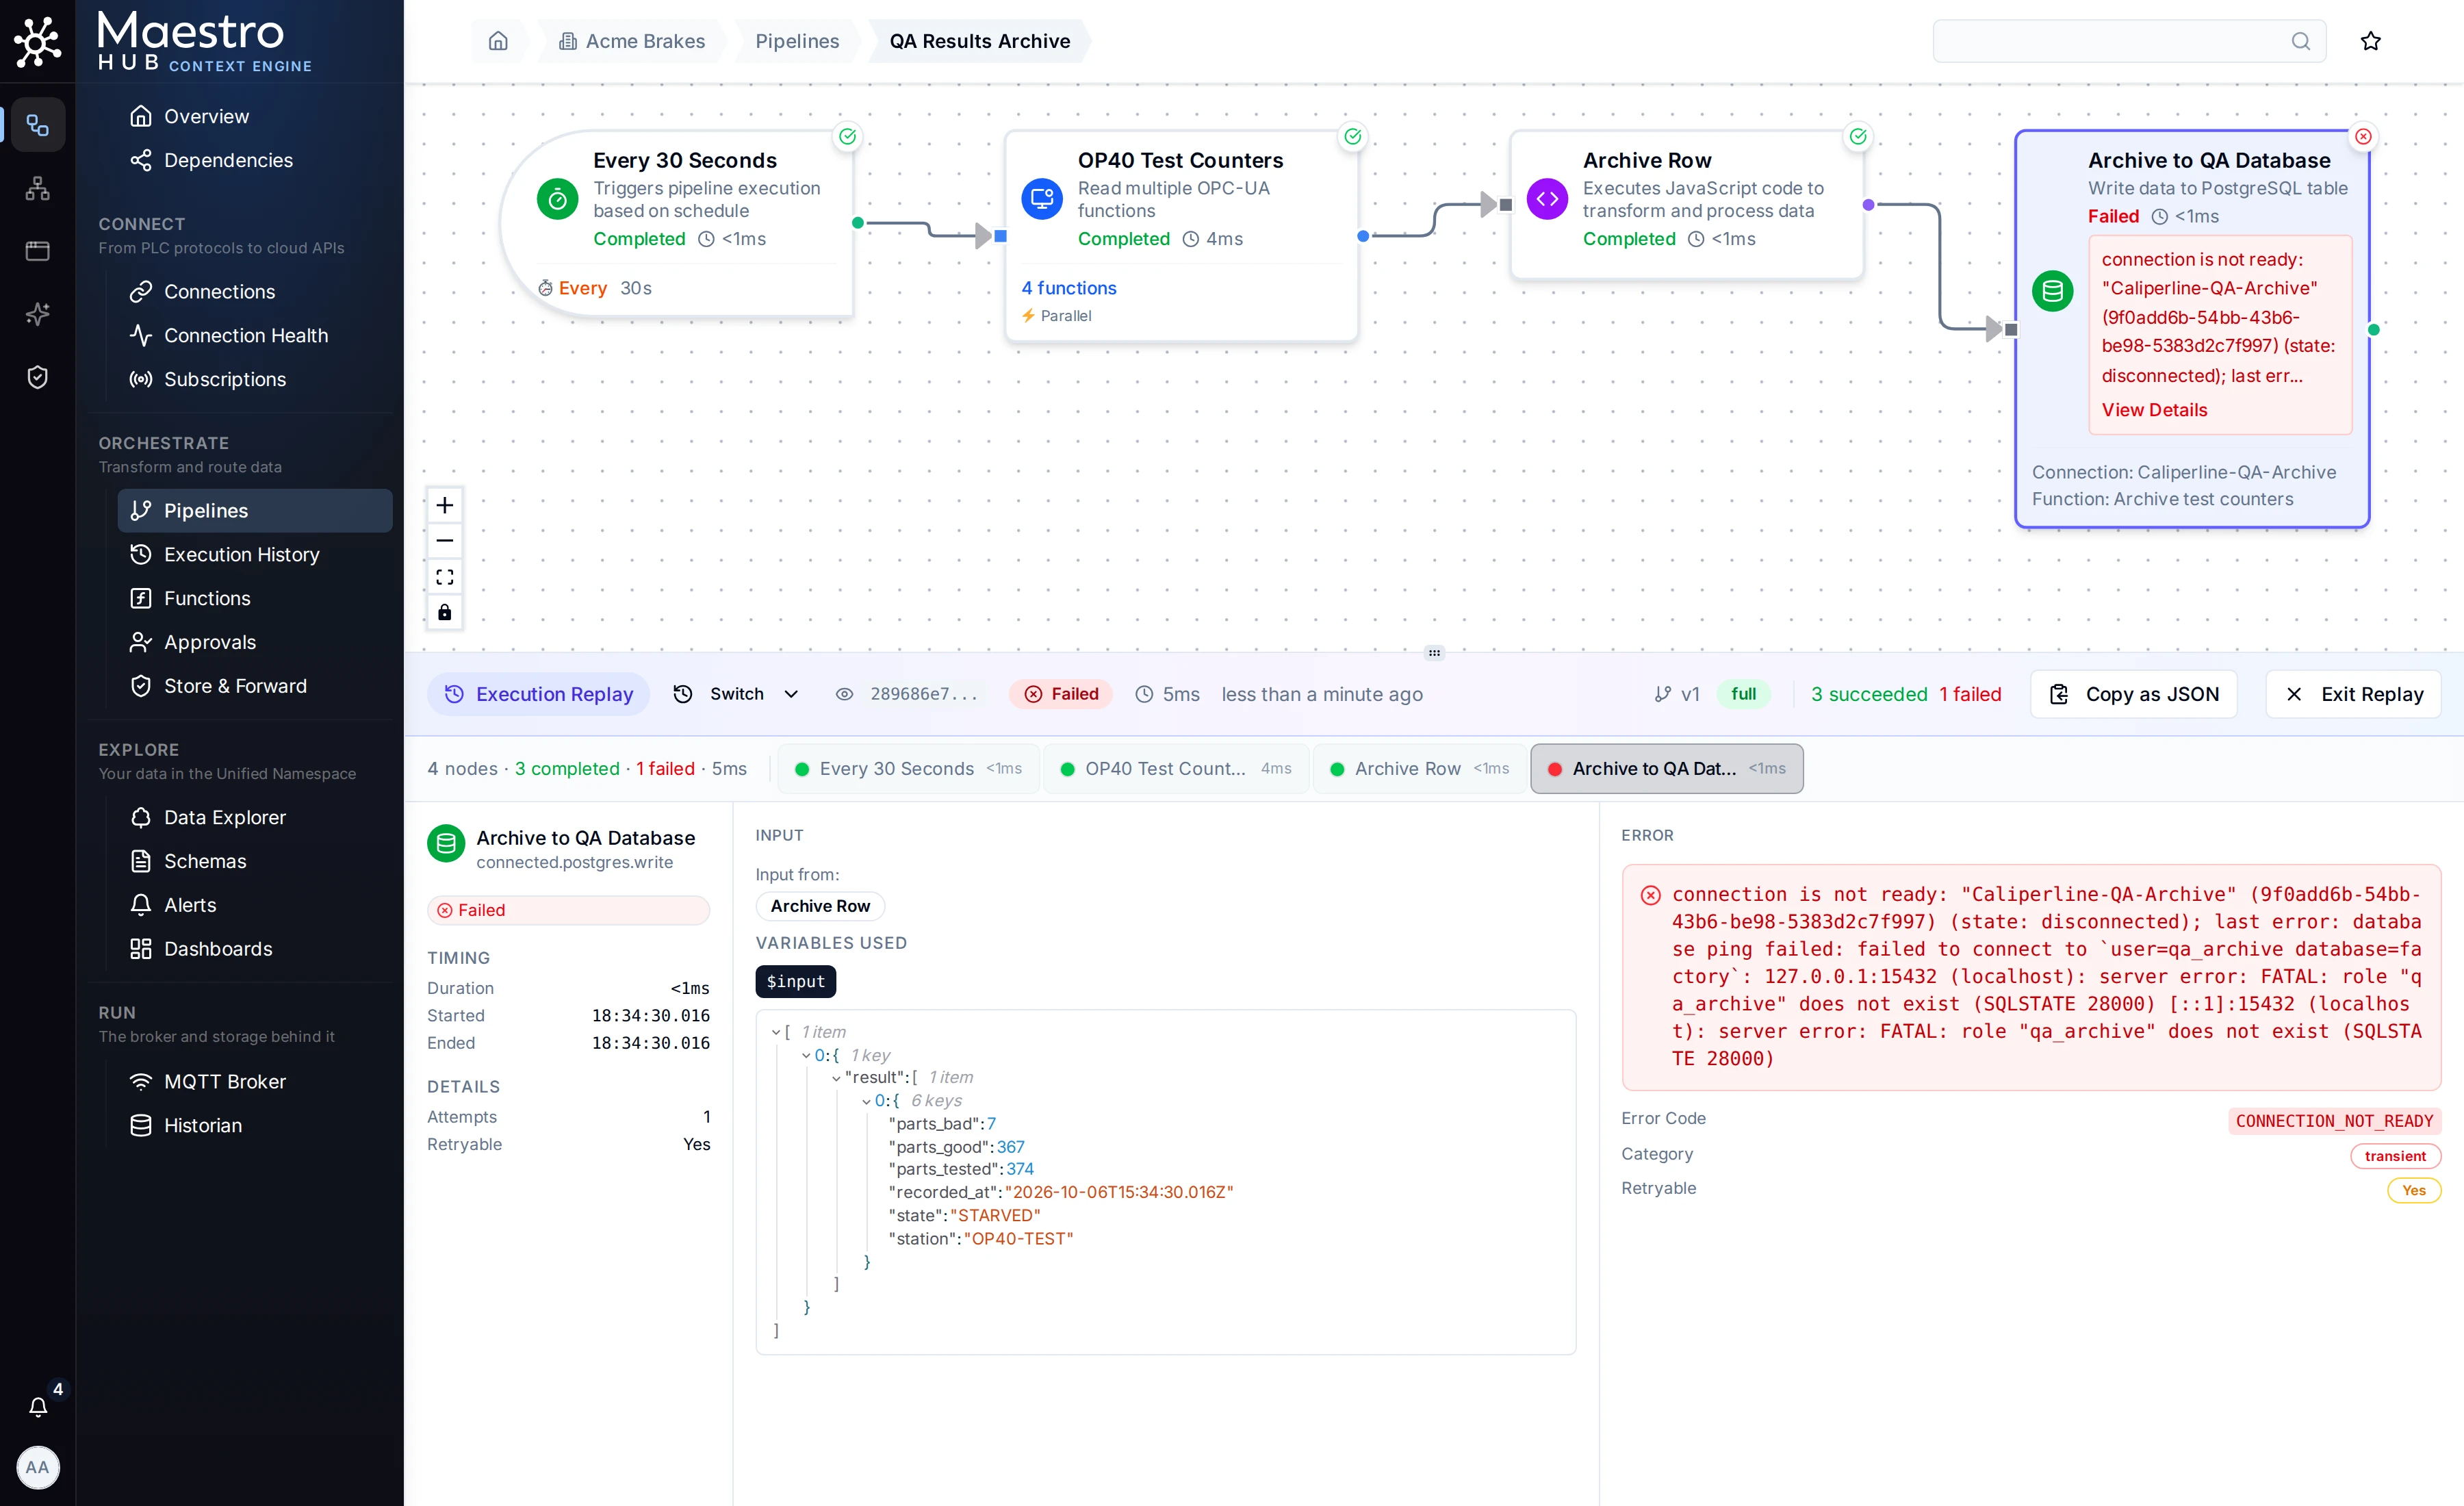
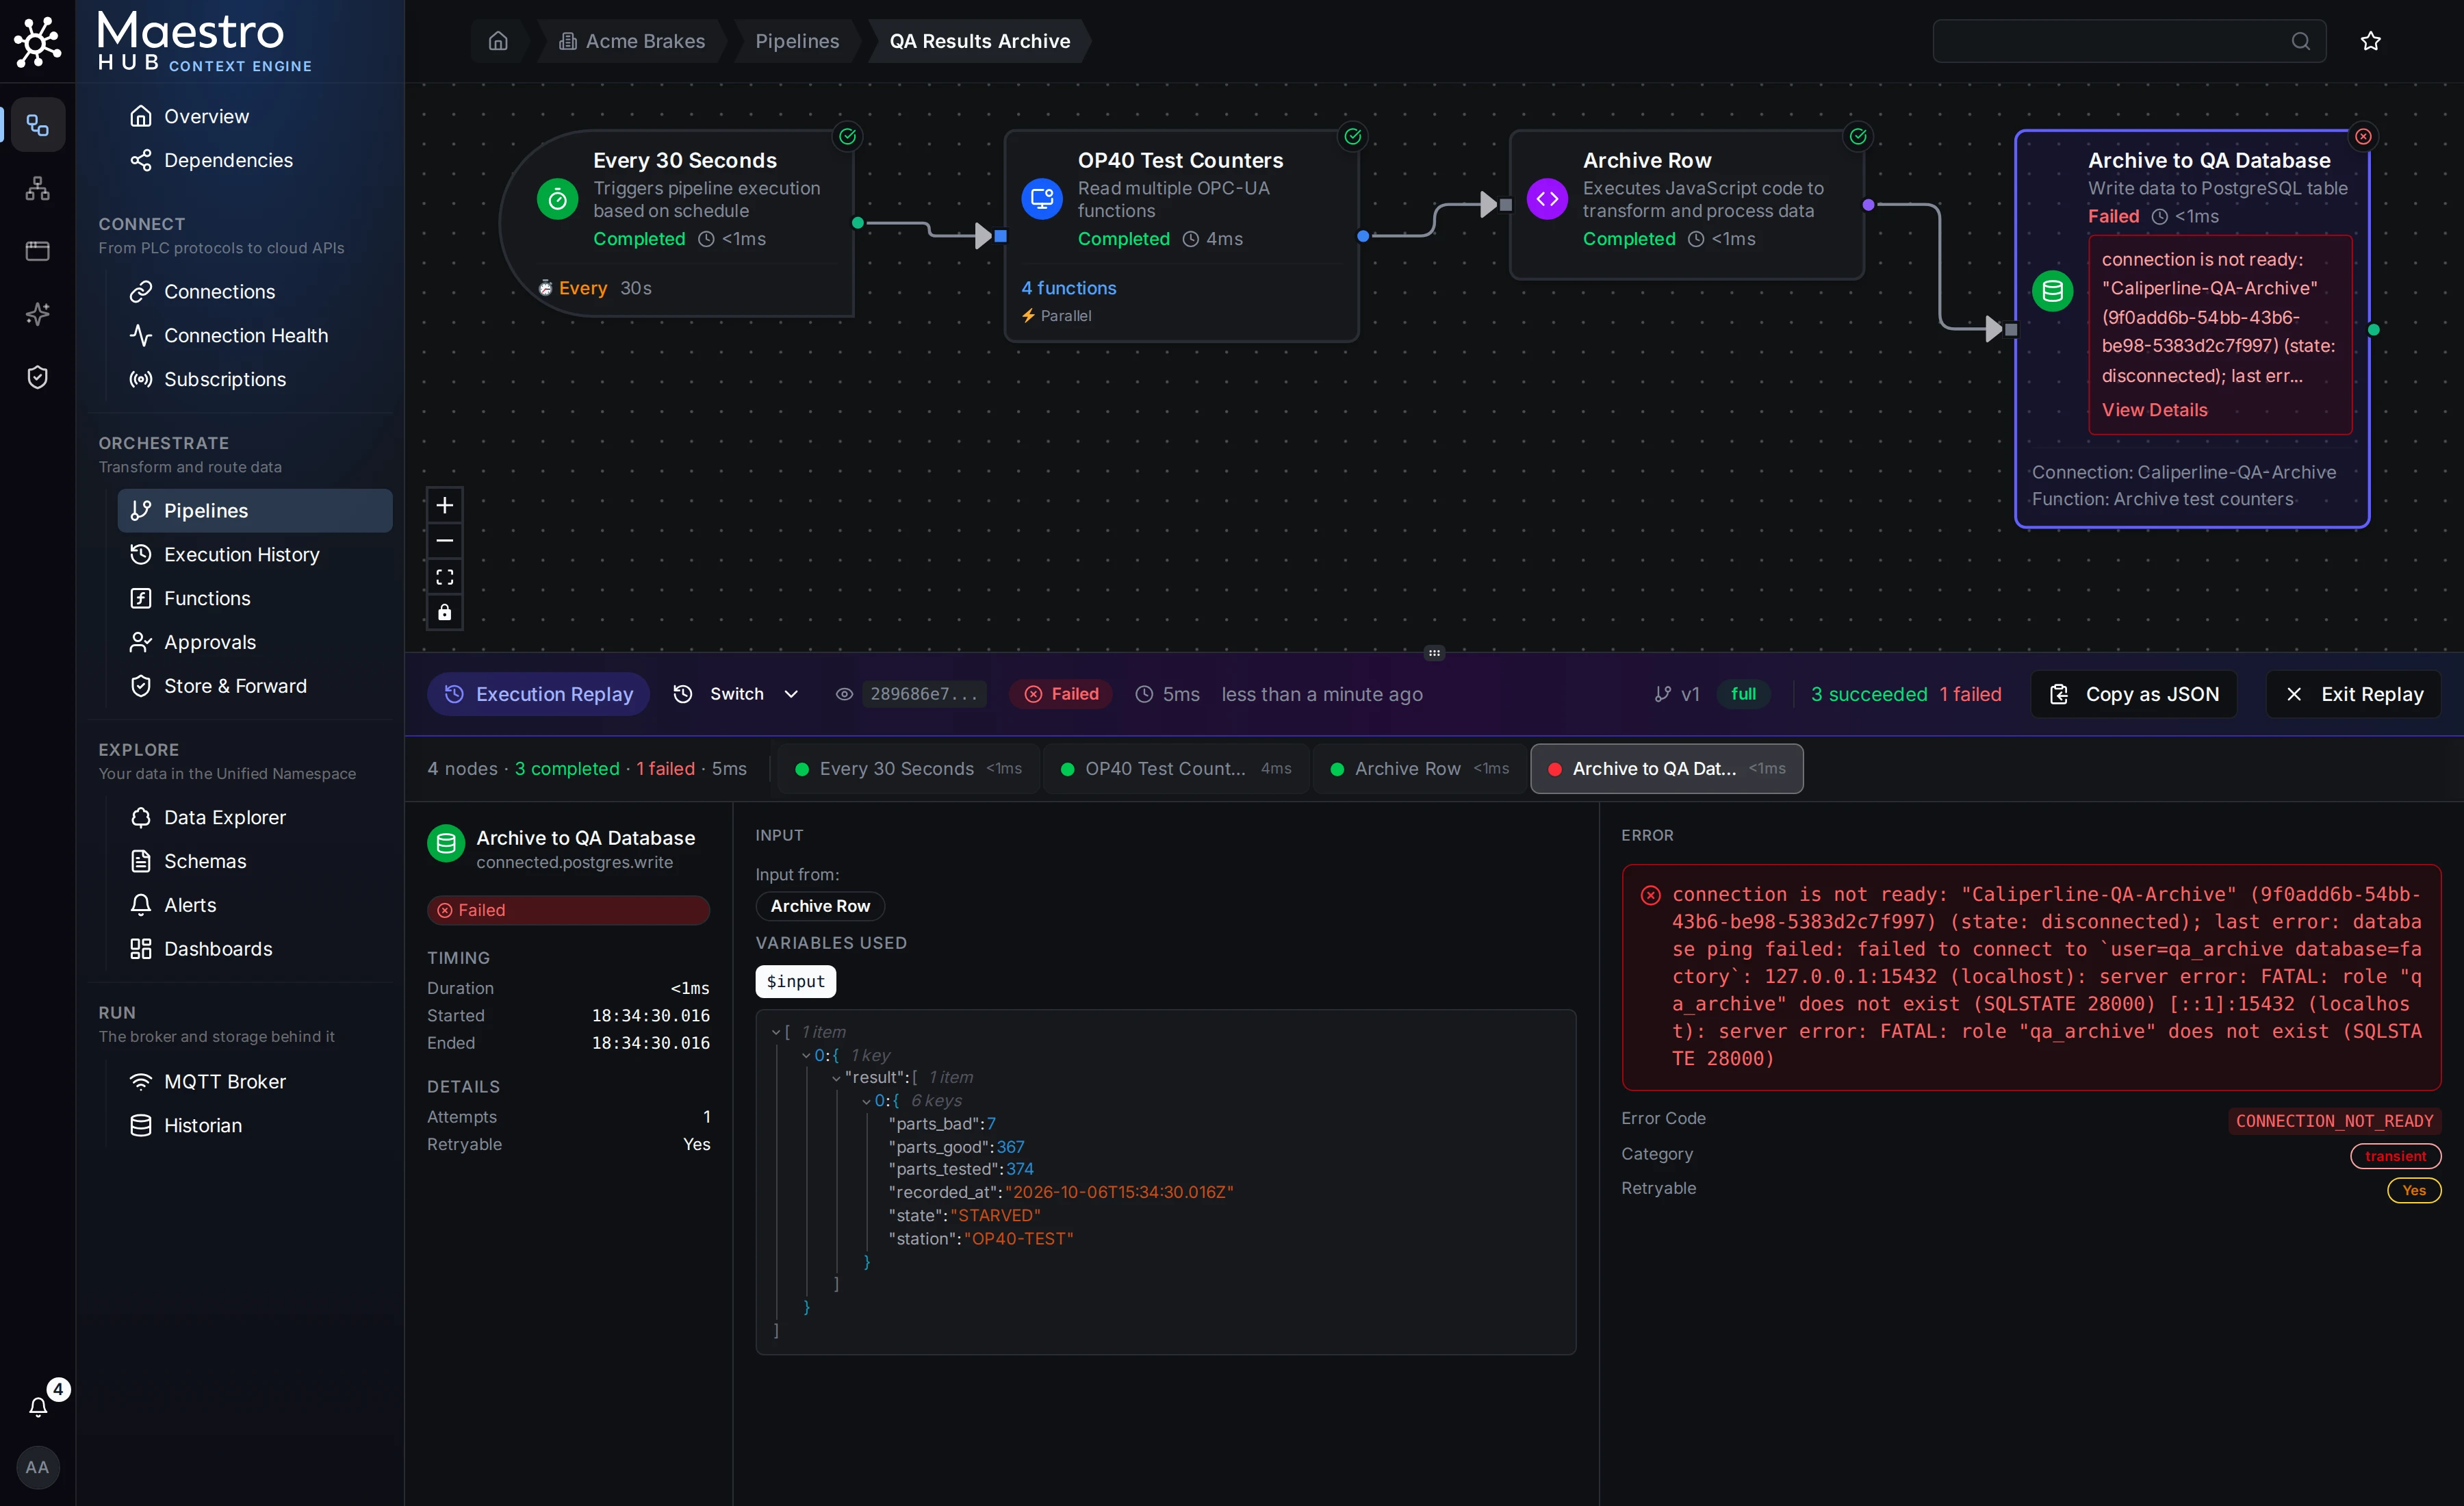
Execution Replay of a failed run: node results on the canvas, and the failed node's details, input and error in the panel below.
Replay header shows the Execution ID (hover for the full ID), status badge, duration, start time, pipeline version, the run's detail level (minimal, standard or full; hover it to see which data the run kept), and how many nodes succeeded and failed. Switch opens the sidebar to pick another run, Copy as JSON copies the whole run, and Exit Replay returns to normal editing mode.
Node tabs below the header list every node that ran, with a summary of how many completed and failed and the total duration. Click a tab, or a node on the canvas, to inspect it; the left and right arrow keys move between tabs.
Node details shows three columns:
- Status and details: the node's status; its duration, start and end time; the number of attempts and whether the error was retryable; the output port it took, and the number of iterations for a node inside a For-Each loop (see Watching a Loop Run)
- Input: the data the node received, the nodes it came from, and the variables it used
- Output: the data the node produced, or the error when it failed. For a trigger node, Use as Test Data keeps its output as the trigger's test data.
When a run was recorded without per-node results (detail level None or Minimal), the panel says so and shows the run's error; raise Execution History Detail in the pipeline's settings to see which node failed. Input and output data are kept only at Full.
If the execution ran on an older pipeline version, a yellow warning banner indicates how many nodes were added or removed since then. A Failed ×N row opens its first run, and a banner says how many more times it repeated and shows the last error.
Shareable URL: when you enter Replay mode, the URL updates with ?execution={id}. Share this URL and the recipient will open the same execution in Replay mode.
Pipeline Metrics Panel
Navigation: Pipeline Designer → ⋯ More actions → Metrics
The metrics panel shows performance statistics for the current pipeline, below the toolbar. The panel auto-refreshes every 5 seconds.


Pipeline Metrics panel with the run outcome, the clean, with-errors and failed counts, total runs, and average time.
| Metric | Description |
|---|---|
| Run outcome (24h) | A bar and a line splitting the runs into clean, completed with errors, and failed, for example 60% clean · 30% with errors · 10% failed. Green when at least 95% are clean; red only when more than a fifth failed outright; amber otherwise. |
| Clean / With errors / Failed | Counts of runs that completed cleanly, completed with errors, and failed. |
| Runs (24h) | Number of executions. |
| Avg Time | Average execution duration. |
The numbers cover the last 24 hours, the window execution history keeps by default. Unlike the execution history, they include every run, not only the recorded ones. A restart clears them, since MaestroHub Lite keeps them in memory.
All Executions View
Navigation: Orchestrate → Execution History
The Execution History page shows a table of the executions of every pipeline in the workspace. Use this when you need to search across pipelines or do not know which pipeline produced a specific execution. The columns, filters and actions are described in Execution History on the Pipelines page.
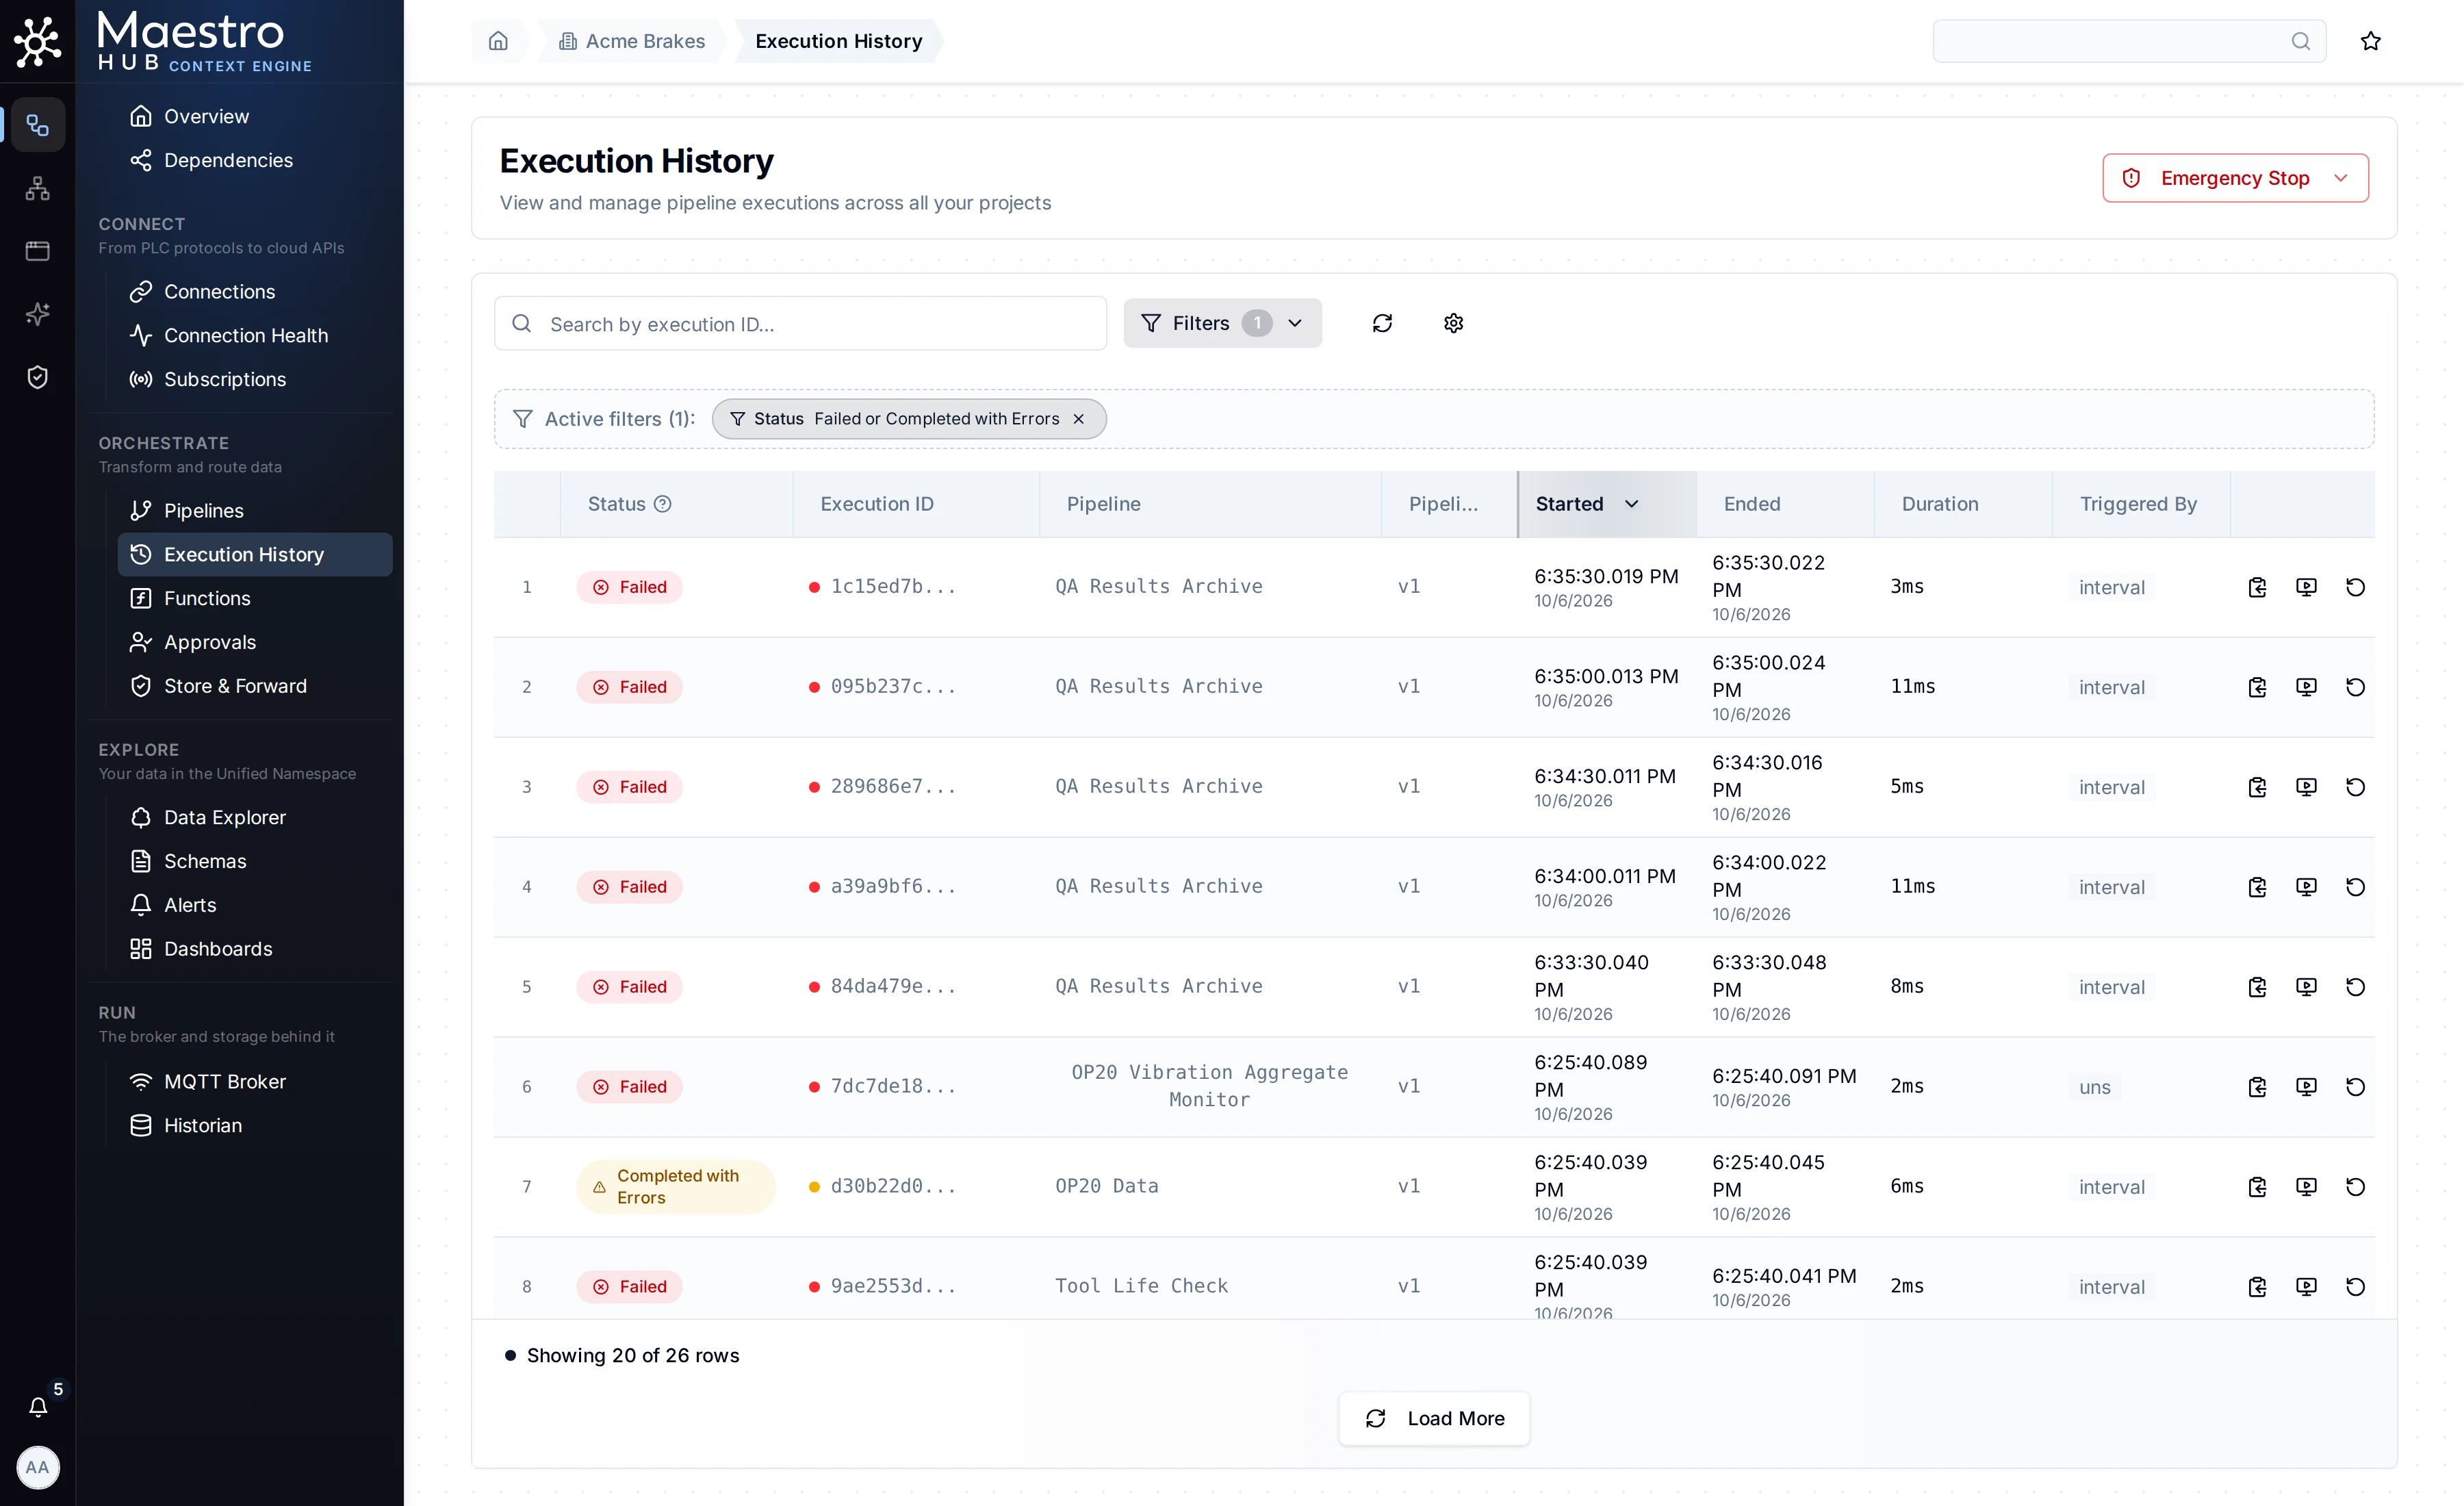
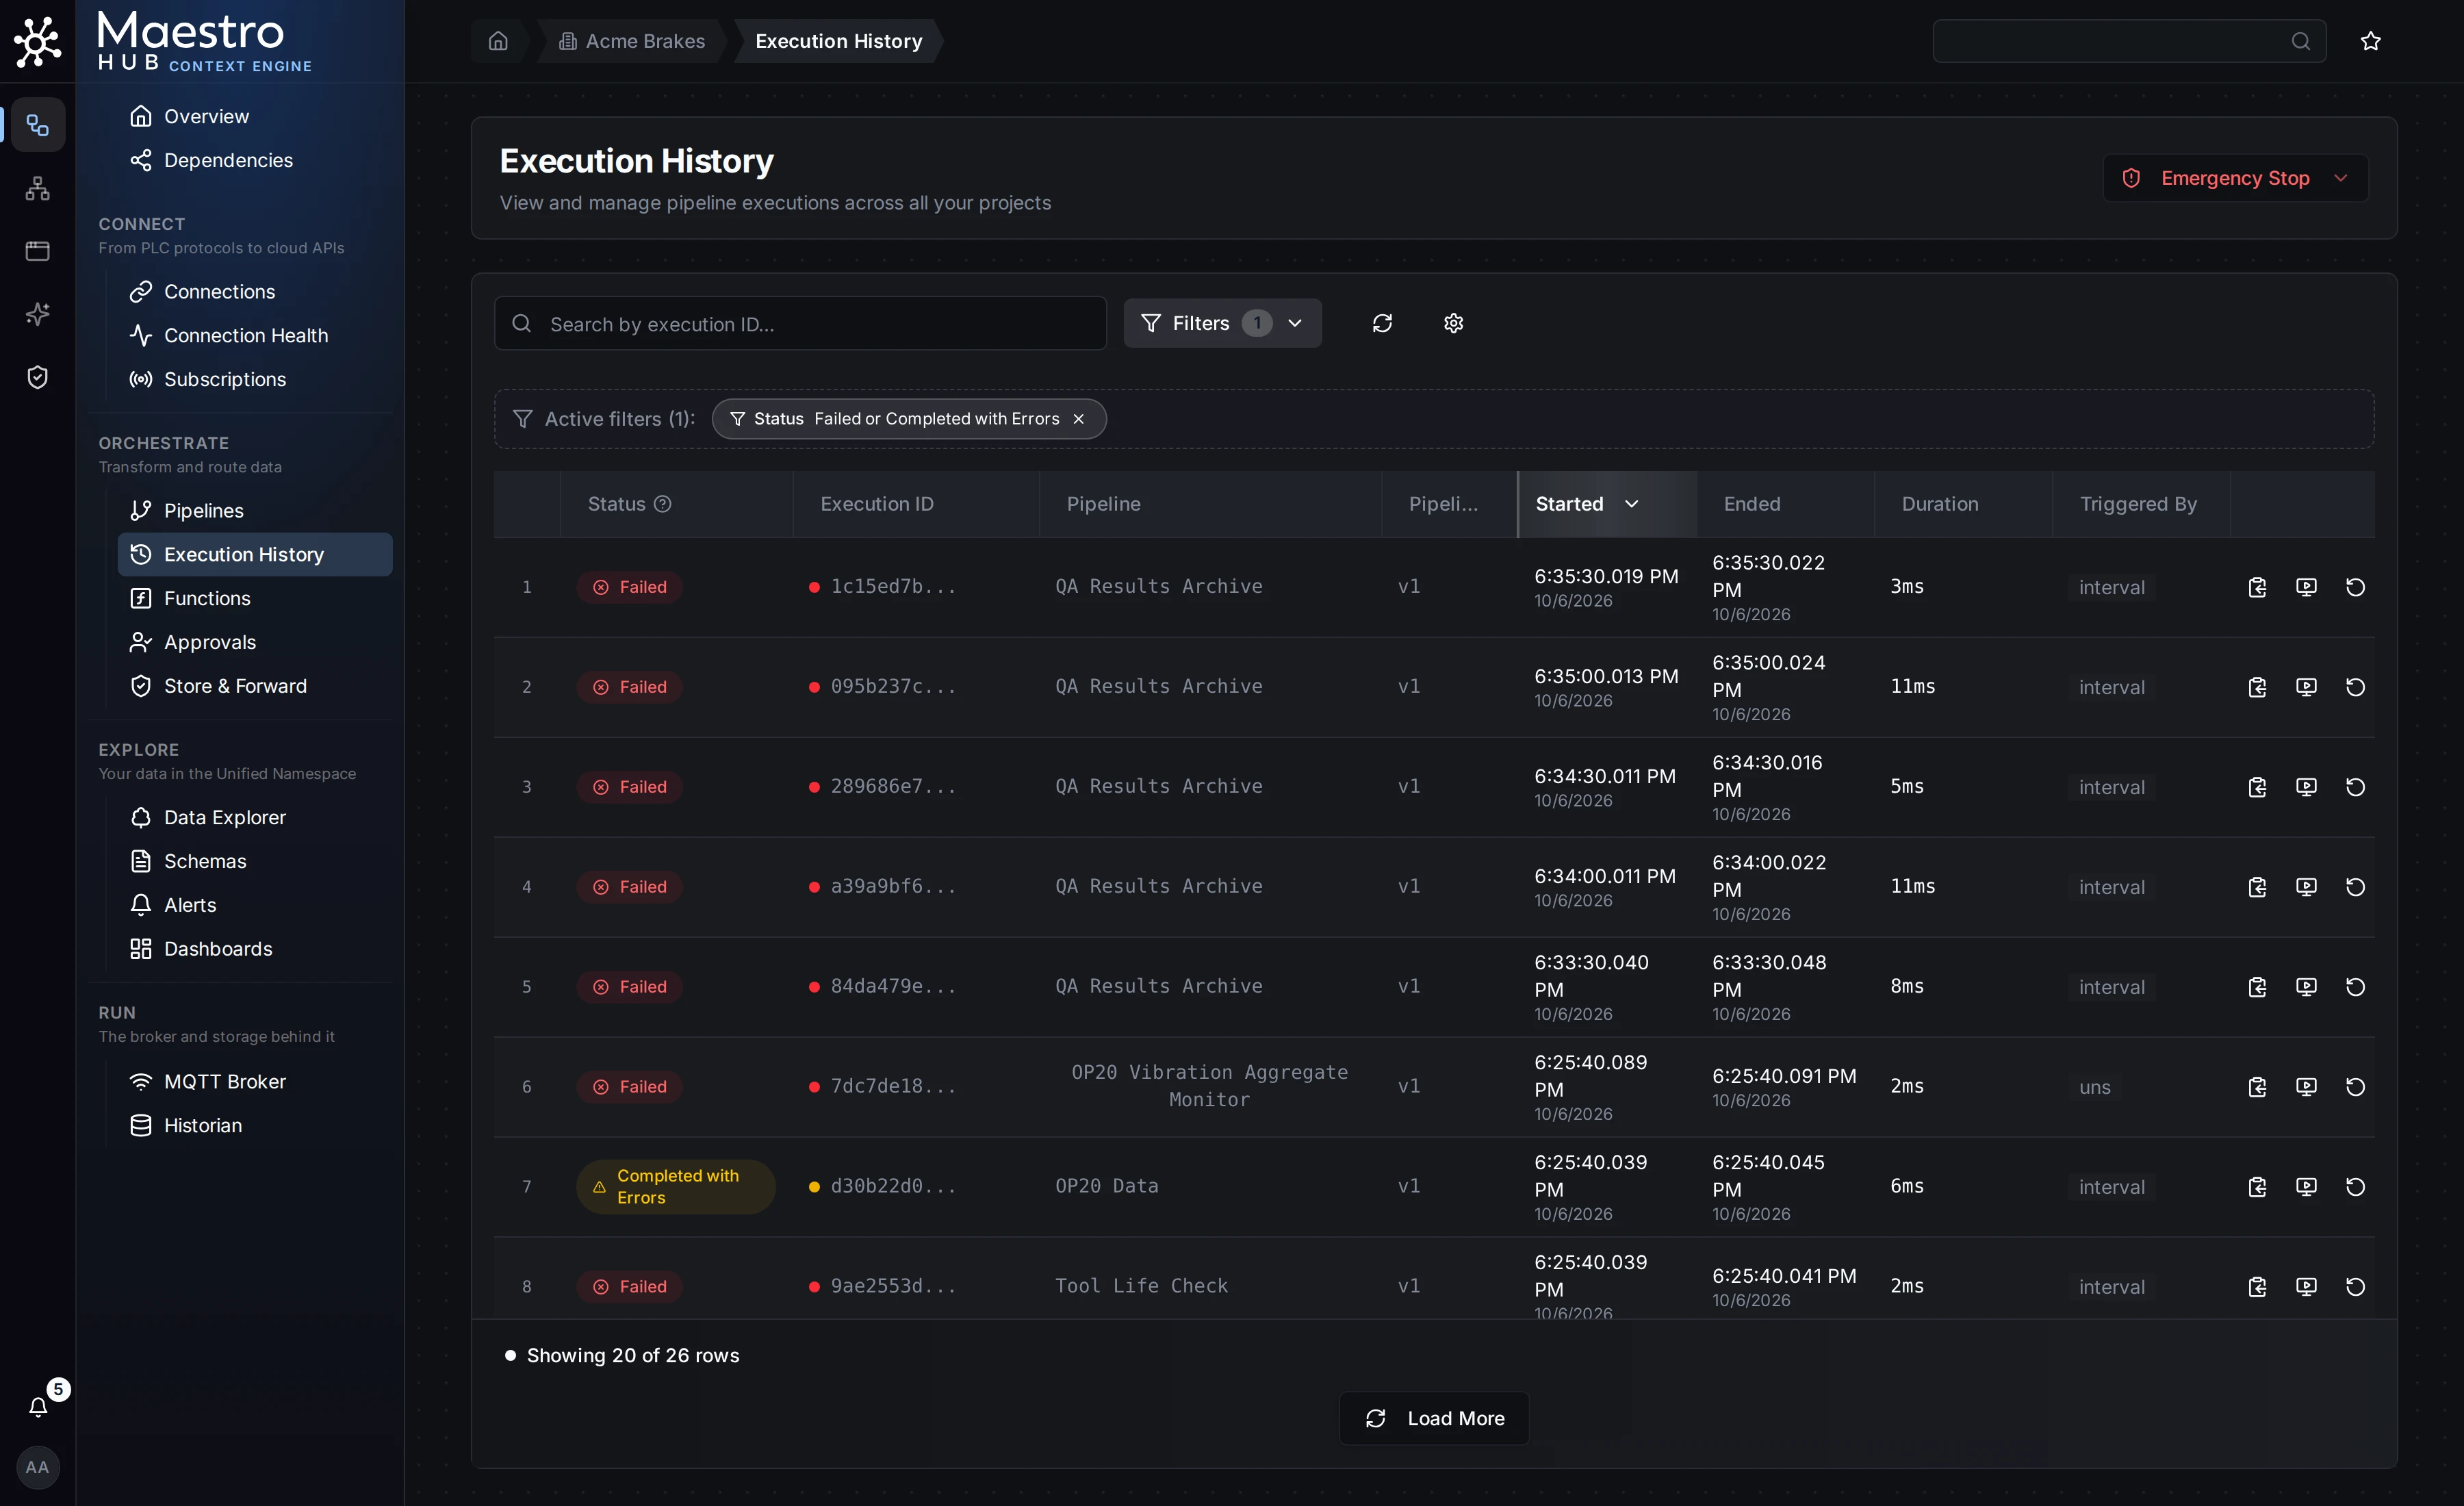
Execution History filtered to failed runs, with search, filters, and sortable columns.
For troubleshooting:
- Search by execution ID to find a run someone shared with you.
- The Status filter's Failed or Completed with Errors option lists every run in which a node failed.
- View on Canvas opens a run in Execution Replay, Retry reruns a failed run with the same inputs, and Cancel stops a running one.
- Emergency Stop stops pending or running pipelines for the whole workspace; see Emergency Stop.
Runs are kept for 24 hours by default and then deleted, together with their node results and data. Metrics are not affected. The retention is set with modules.pipelineEngine.executionRepository.sqlite.retention in the configuration.
Execution history also has a size limit, so a busy pipeline cannot fill the disk within those 24 hours. By default it is a tenth of the disk, at most 8 GB; set it with modules.pipelineEngine.executionRepository.sqlite.maxSizeMB. Over the limit, older runs first lose their node data (they keep their status, timing and failed nodes), then the oldest successful runs are deleted, and the pipeline storing the most data gives up space first. A pipeline's Execution History panel says when this removed older runs, and from when its list starts.
When execution history cannot hold every pipeline's runs for the whole retention window, the pipelines writing more than their share give first: after a few minutes over its share, a pipeline's runs are stored one level lower (Full, then Standard, then Minimal, then failures only), and the people who can edit it get one notification. Its saved setting does not change, runs started by hand keep their detail, and the level steps back up once it fits again. The pipeline's Execution History panel and each affected run say why.
Each run stores at most 16 MB of data. Larger values are replaced with a size marker, and long loops keep their first 100, last 100 and failed iterations. A run's replay says what was left out. While the disk is at its free-space floor, new runs are stored without node data.
Pipeline Advanced Settings
Navigation: the settings (gear) button in the Pipeline Designer toolbar, or Edit in the pipeline's ⋯ menu on the Pipelines page; then the Advanced tab
The Edit Pipeline → Advanced tab contains settings that affect troubleshooting and execution behaviour.
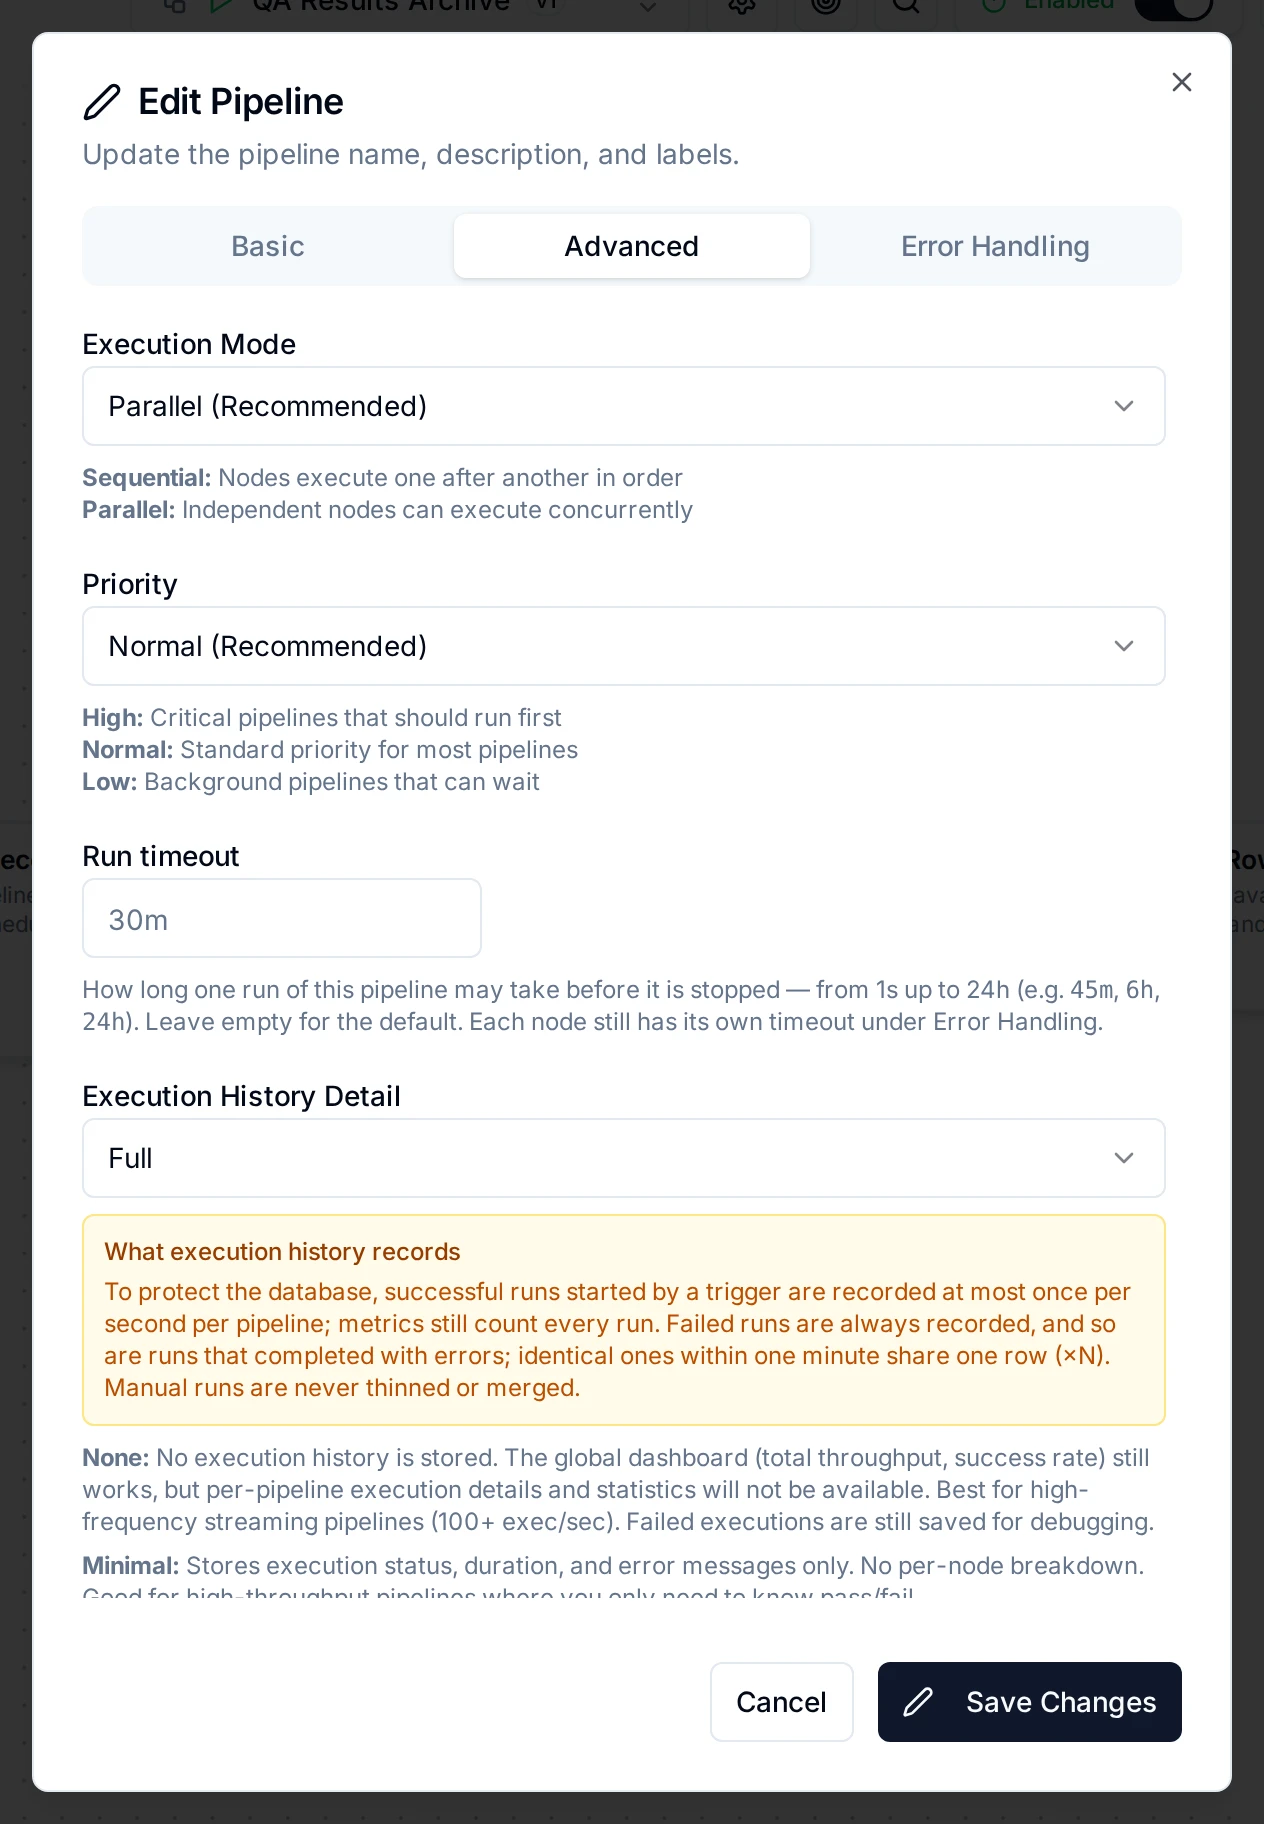
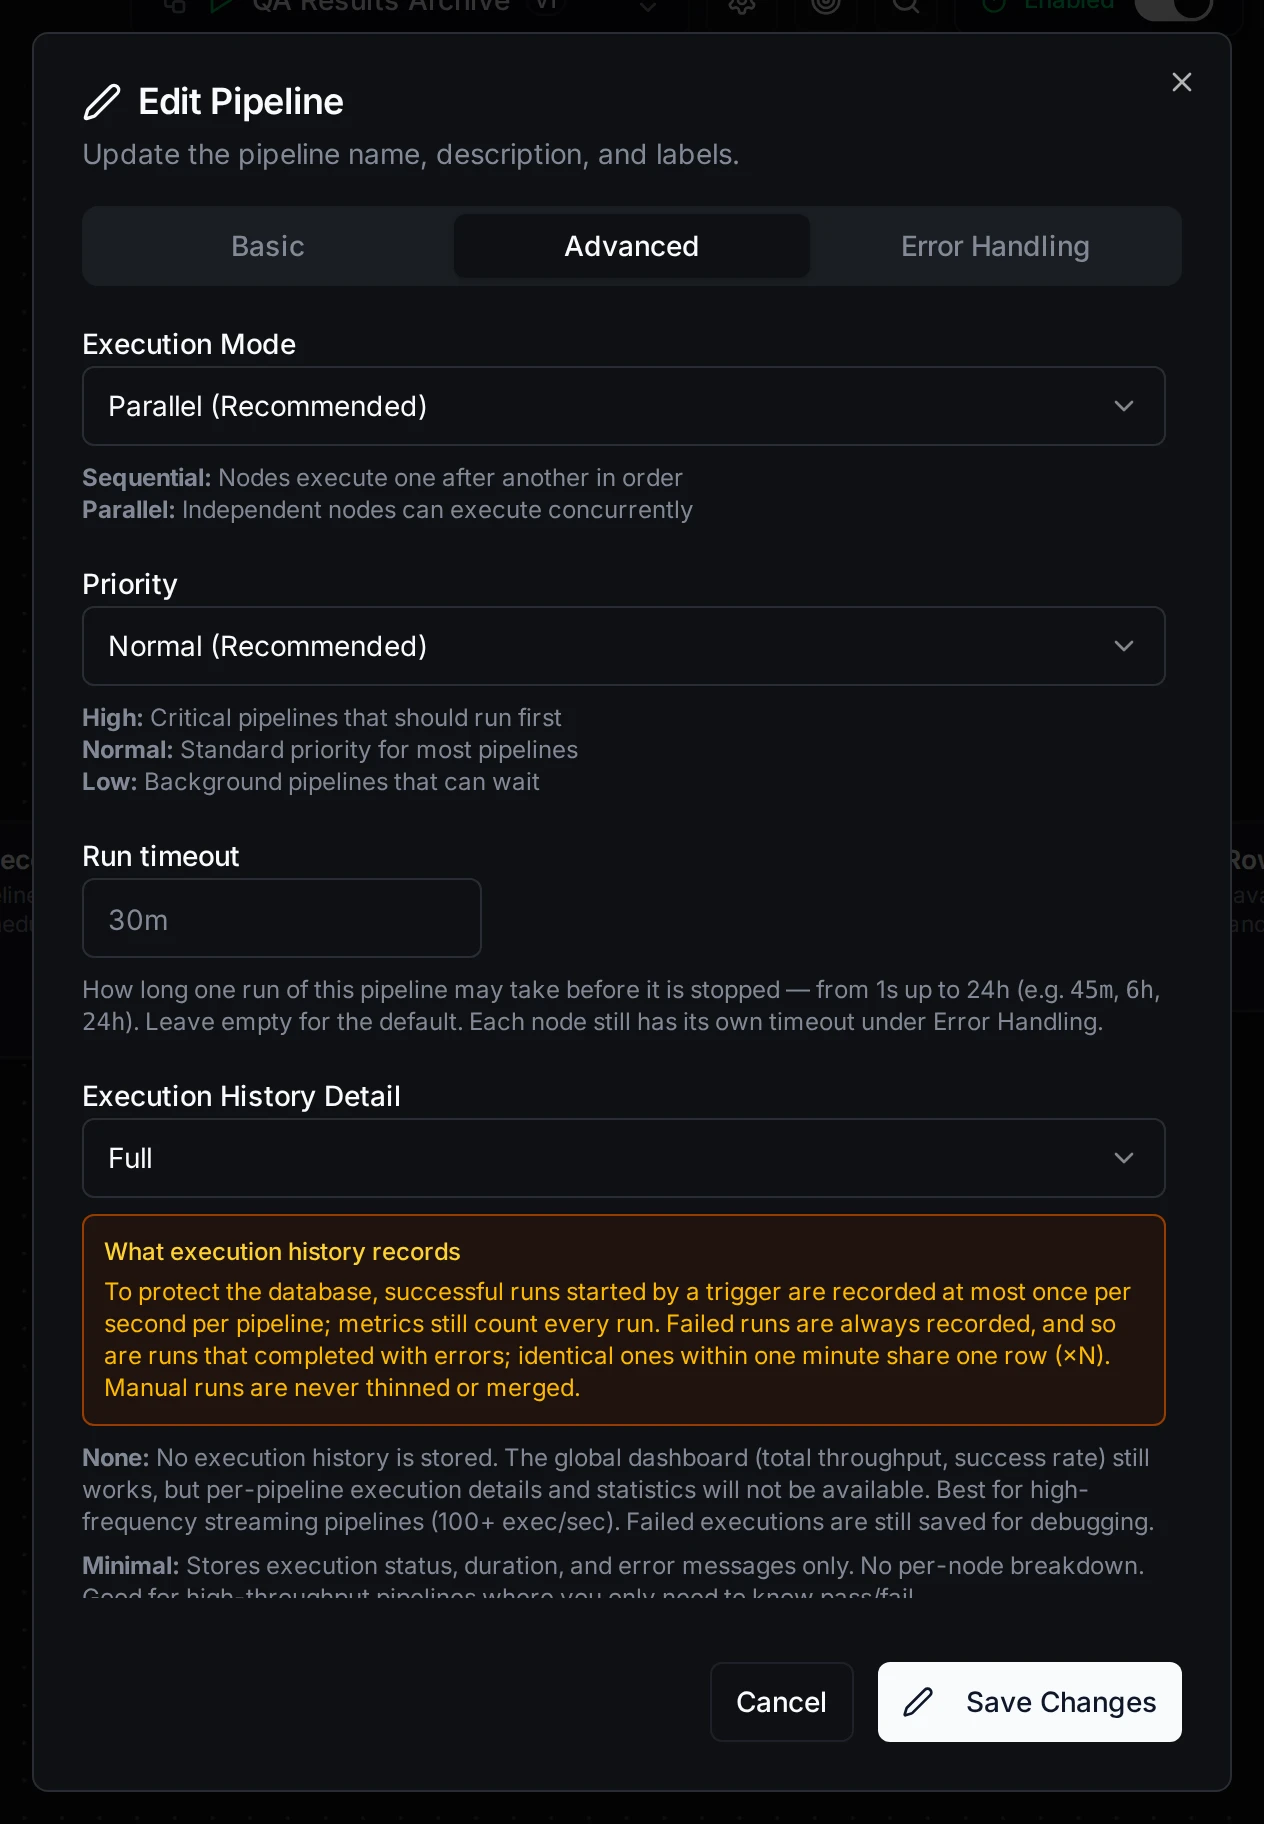
Advanced pipeline settings: Execution Mode, Priority, Run timeout, and Execution History Detail.
Execution Mode: Parallel (default, recommended): independent nodes run concurrently. Sequential: nodes run one after another in order.
Priority: High: critical pipelines execute first. Normal (default): standard priority. Low: background pipelines that can wait.
Run timeout: how long one run may take before it is stopped, from 1s to 24h; empty means the default, 30 minutes. See Setting a pipeline's run timeout.
Execution History Detail: controls how much data is captured during execution:
| Level | What is Recorded | Use Case |
|---|---|---|
| None | No execution history. Failed runs are still recorded, without per-node results. | High-frequency pipelines where metrics are enough. |
| Minimal | Execution status, duration and error message, and which node failed. No other per-node results. | Production pipelines where you only need to know if it ran. Fastest performance, least storage. |
| Standard (default) | Status + per-node results (status, timing, errors). | Recommended for debugging. Shows which node failed without storing full payloads. |
| Full | Everything including node input/output data. | Complete debug capability. Uses more storage. Recommended for development and testing. |
Whatever the level, at most one successful run per second is recorded for a pipeline; failed runs, runs that completed with errors, and manual runs are always recorded.
Changing this setting only affects new executions. Previous executions retain whatever detail level was active when they ran.
Error Handling tab: the default timeout, retries and On Error behaviour for every node in the pipeline. See Error Handling.
Connection Status
Navigation: Connect → Connections
Overview
The Status column in the connections table shows the current state of every configured connection. MaestroHub watches each connection, reconnects it automatically when the link drops, and paces the attempts with a circuit breaker. Status data refreshes every 10 seconds.
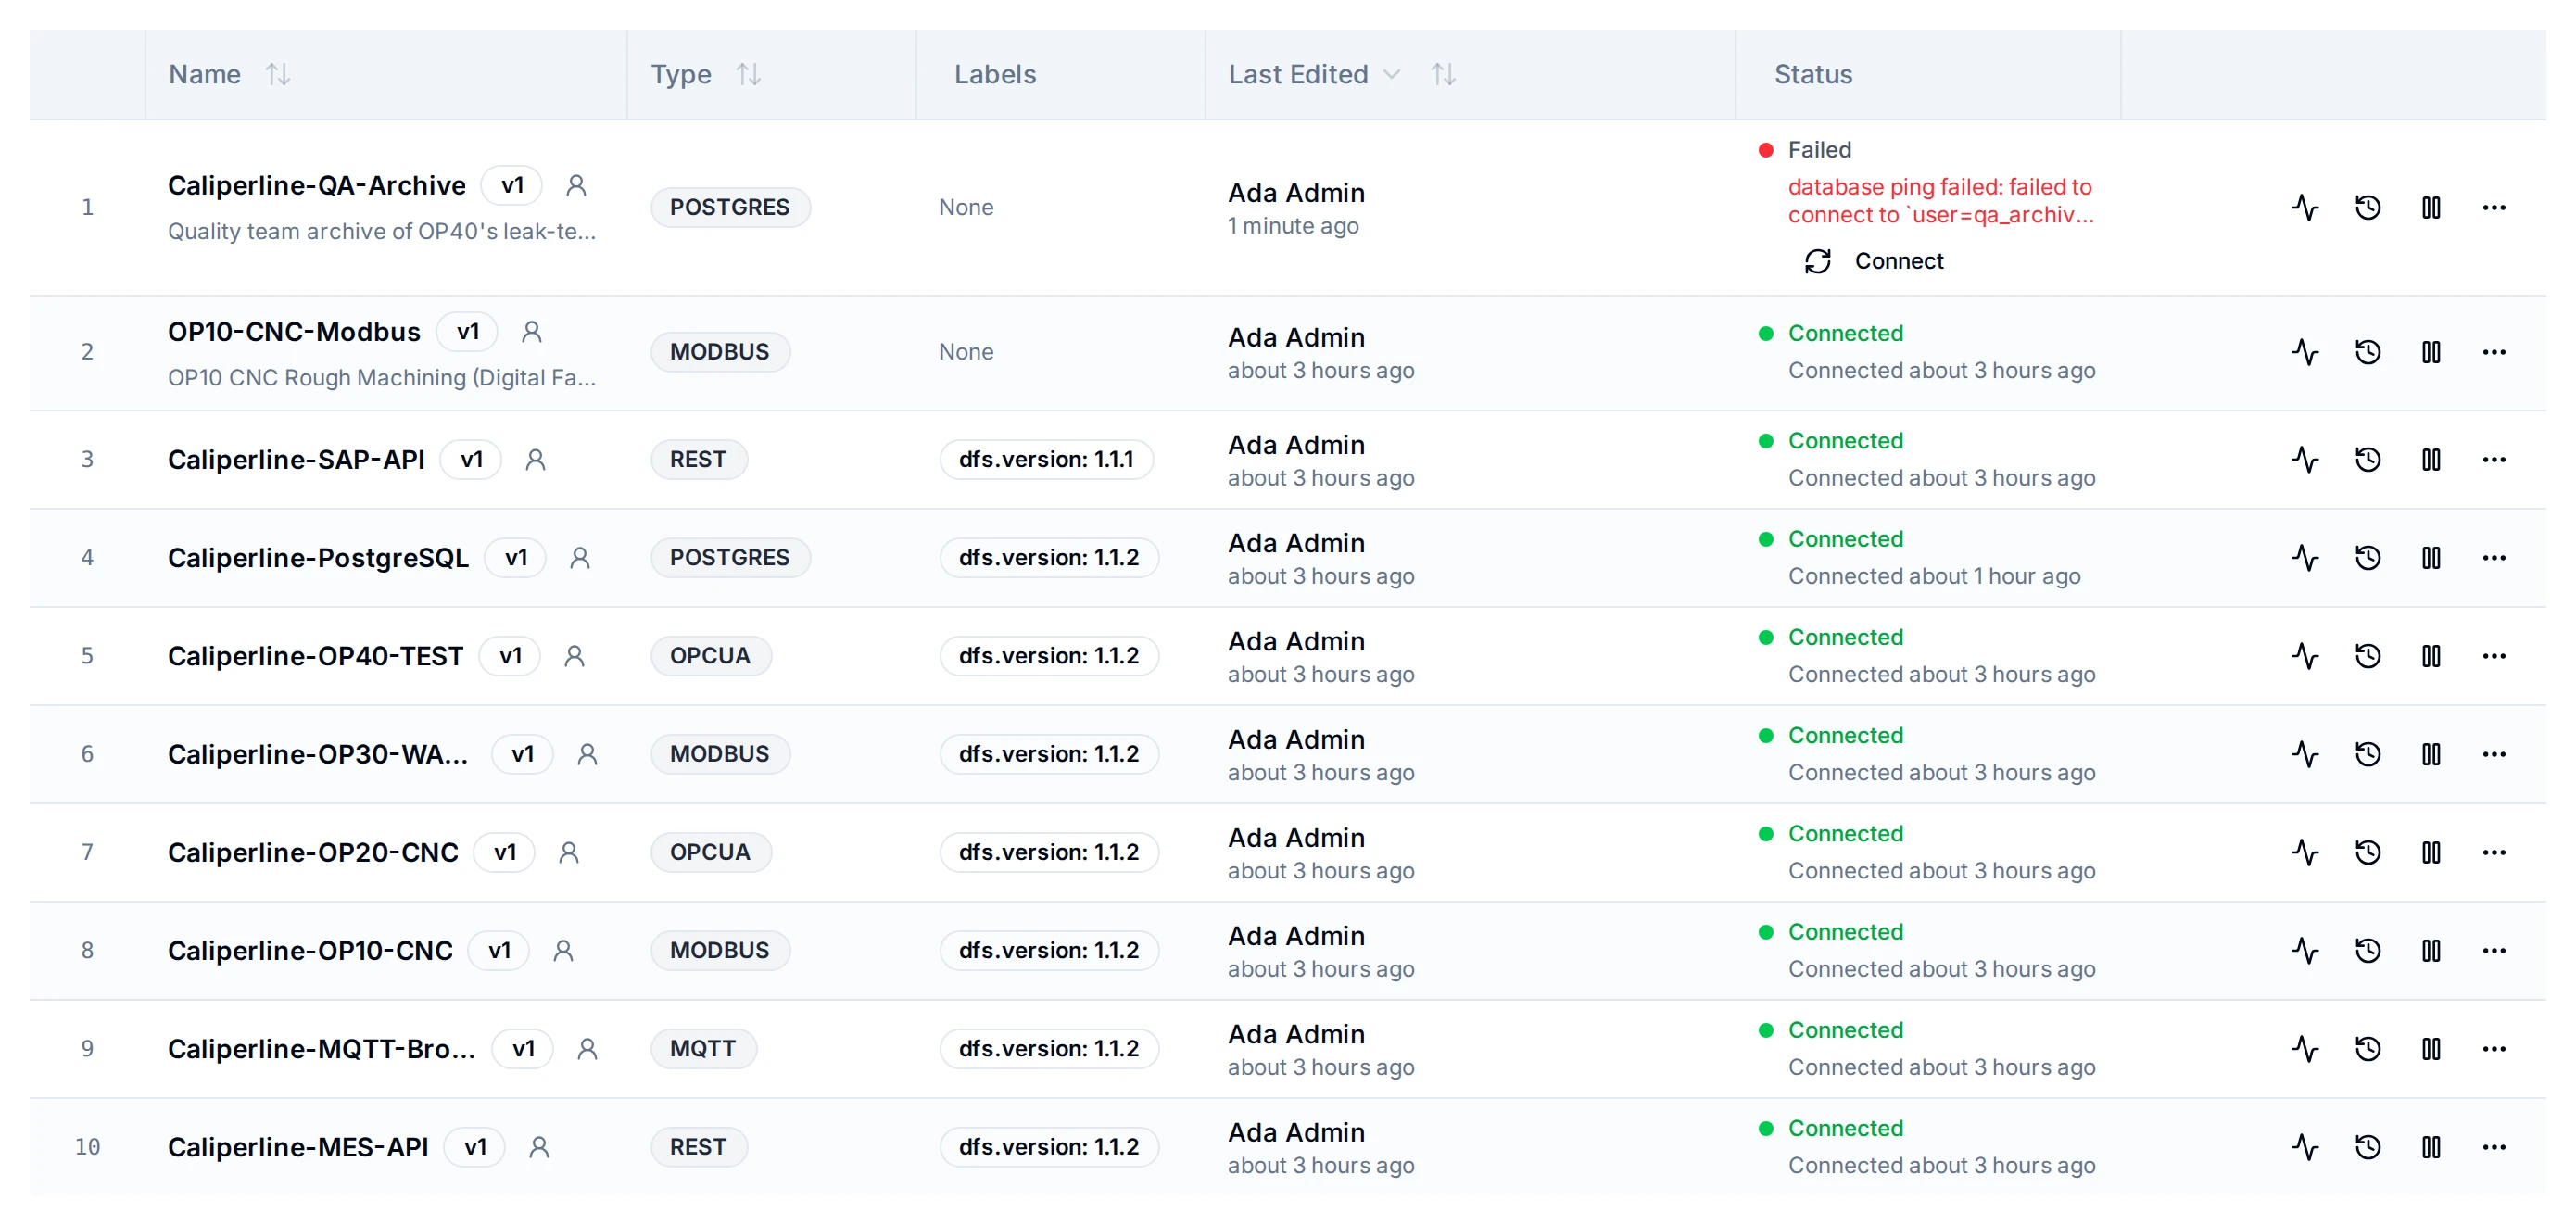
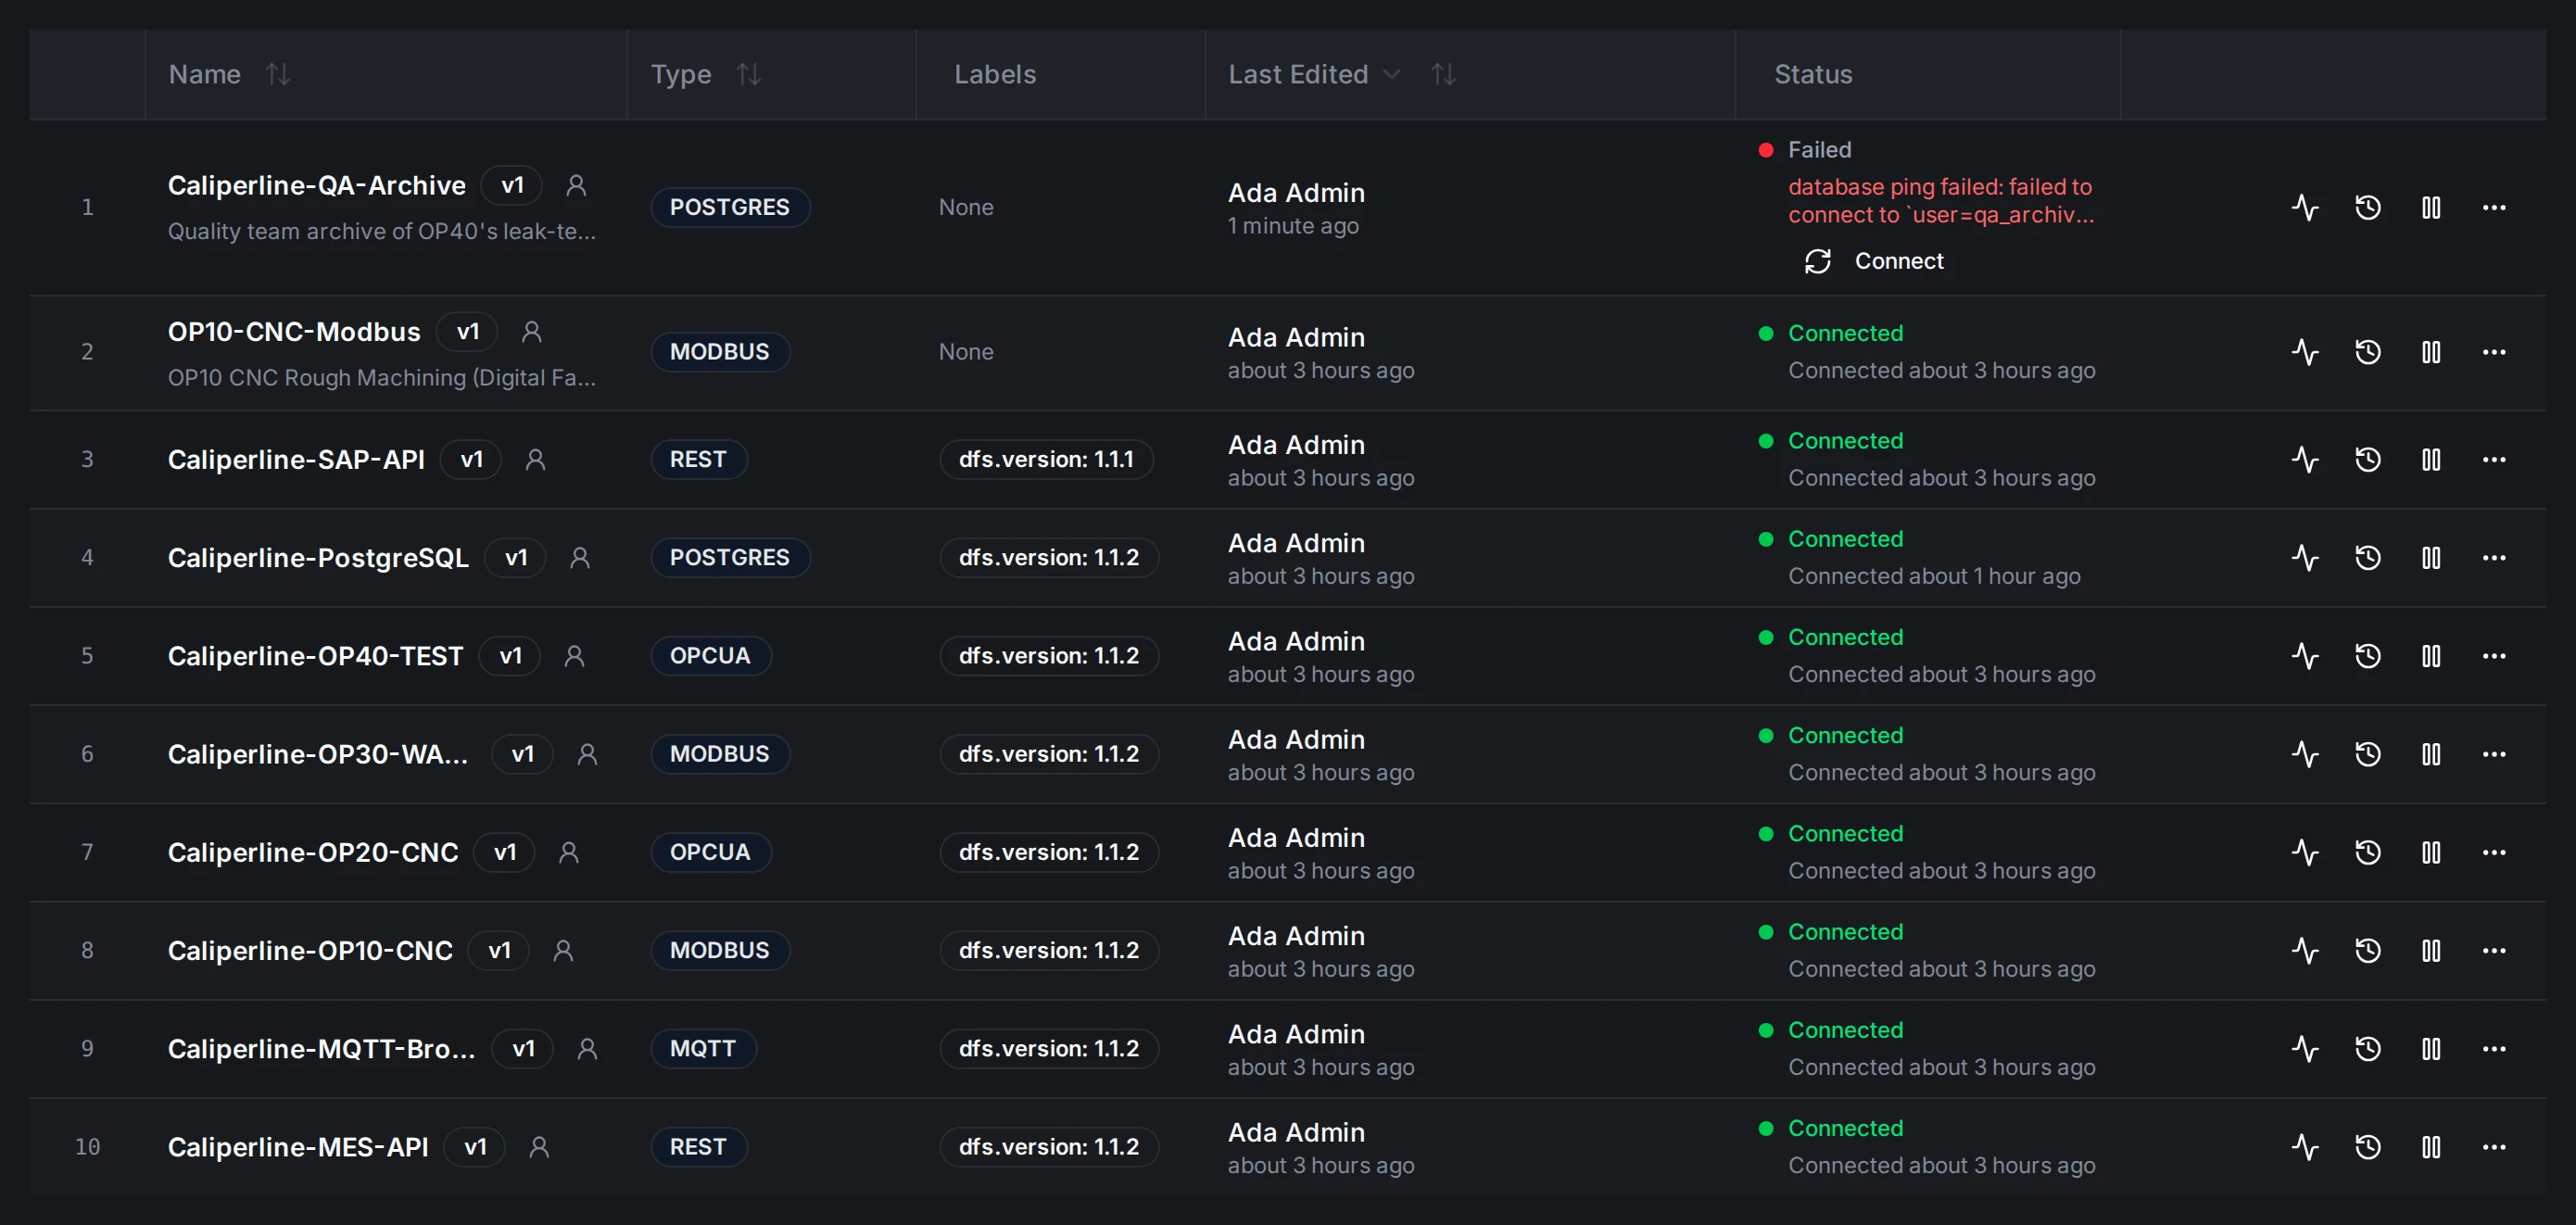
Status column with one Failed connection, its error and the Connect button, and nine Connected ones.
Connection States
What each state means is explained in Connection Statuses. In the Status column:
| State | Indicator | What the column shows |
|---|---|---|
| Connected | Green dot | "Connected X ago" with elapsed time. |
| Idle | Gray dot | Registered but not started, or stopped. A Connect button appears inline. |
| Connecting | Yellow pulsing dot | "Establishing connection..." during the first attempt. If it persists beyond 30 seconds, investigate network or configuration issues. |
| Reconnecting | Blue pulsing dot | The retry count (e.g. "Retry #3") and the last error. |
| Disconnected | Gray dot | The link was lost; MaestroHub keeps retrying. Shows the error and a Connect button. |
| Failed | Red dot | Reconnection kept failing (three circuit-breaker cycles), or the error is one retrying cannot fix, such as rejected credentials or certificates, which fails the connection at once. MaestroHub keeps retrying. Shows the error and a Connect button. |
| Suspended | Amber dot | Paused by an operator, with the reason, and a Resume button. A connection suspended by maintenance mode reads Suspended — workspace in maintenance and resumes when maintenance ends. |
A connection that runs on several replicas shows Degraded when some of its slots are connected and others are not (a failed slot included): it still serves, so it is not an outage and sends no notification. Degraded capacity means fewer slots run than were requested. Both show the slot count and the reason, such as which slot failed and its error. Only when no slot is connected does the connection show Failed or Disconnected. See Connections that run on several replicas.
Error Messages
When a connection is in a problematic state, the error message appears directly below the status indicator. Common patterns: connection refused (service not running), timeout (network latency or firewall), authentication failure (wrong credentials), TLS/SSL errors (certificate issues), DNS resolution failure (bad hostname). To check whether the server can reach the host and port at all, use Network Diagnostics on the Connections page (see Network Diagnostics).
Circuit Breaker
Each connection's reconnection attempts are paced by a circuit breaker, so that a system that is down is not flooded with attempts.
| State | Meaning |
|---|---|
| Closed | Normal operation. Failures are counted. |
| Open | After 5 consecutive failures, attempts stop for 30 seconds. Each time it opens again, the wait doubles, up to 5 minutes. |
| Half-Open | After the wait, test attempts are allowed. Three successes in a row close the breaker; a failure opens it again, with the wait doubled. |
After the breaker has opened three times in a row, the connection becomes Failed. Retries continue at the breaker's pace, and the first successful attempt returns the connection to Connected. Resume on a suspended connection resets the breaker and starts the connection straight away.
Connection Actions
| Action | Where | Available When | What It Does |
|---|---|---|---|
| Connect | Status column | Failed, Idle, Disconnected | Stops and restarts the connection (the same as Force Reconnect). |
| Resume | Status column, or the Resume icon | Suspended | Resumes the connection. |
| Suspend | Suspend icon | Connected, Connecting, Reconnecting, Disconnected, Failed | Pauses the connection and stops reconnection attempts; you can give a reason. See Connection Suspension. |
| Force Reconnect | ⋯ menu | Failed, Suspended, Idle, Disconnected | Full stop and restart of the connection. Use after configuration changes. |
| Test connection | Test icon | All states | One-time connectivity test without affecting the running connection. |
| View status history | History icon | All states | Opens the connection's Health tab. |
The Connect, Resume, Suspend and Force Reconnect actions are shown only to users allowed to start or change the connection.
Connection Health
Navigation: Connect → Connection Health (or Status History on the Connections page)
Connection Health answers two questions for every connection: is it working right now, and how reliably has it run over the period you pick. A connection can be connected and still do nothing, or connected and failing every read. The connections table shows it as healthy, and this page shows what is actually happening.
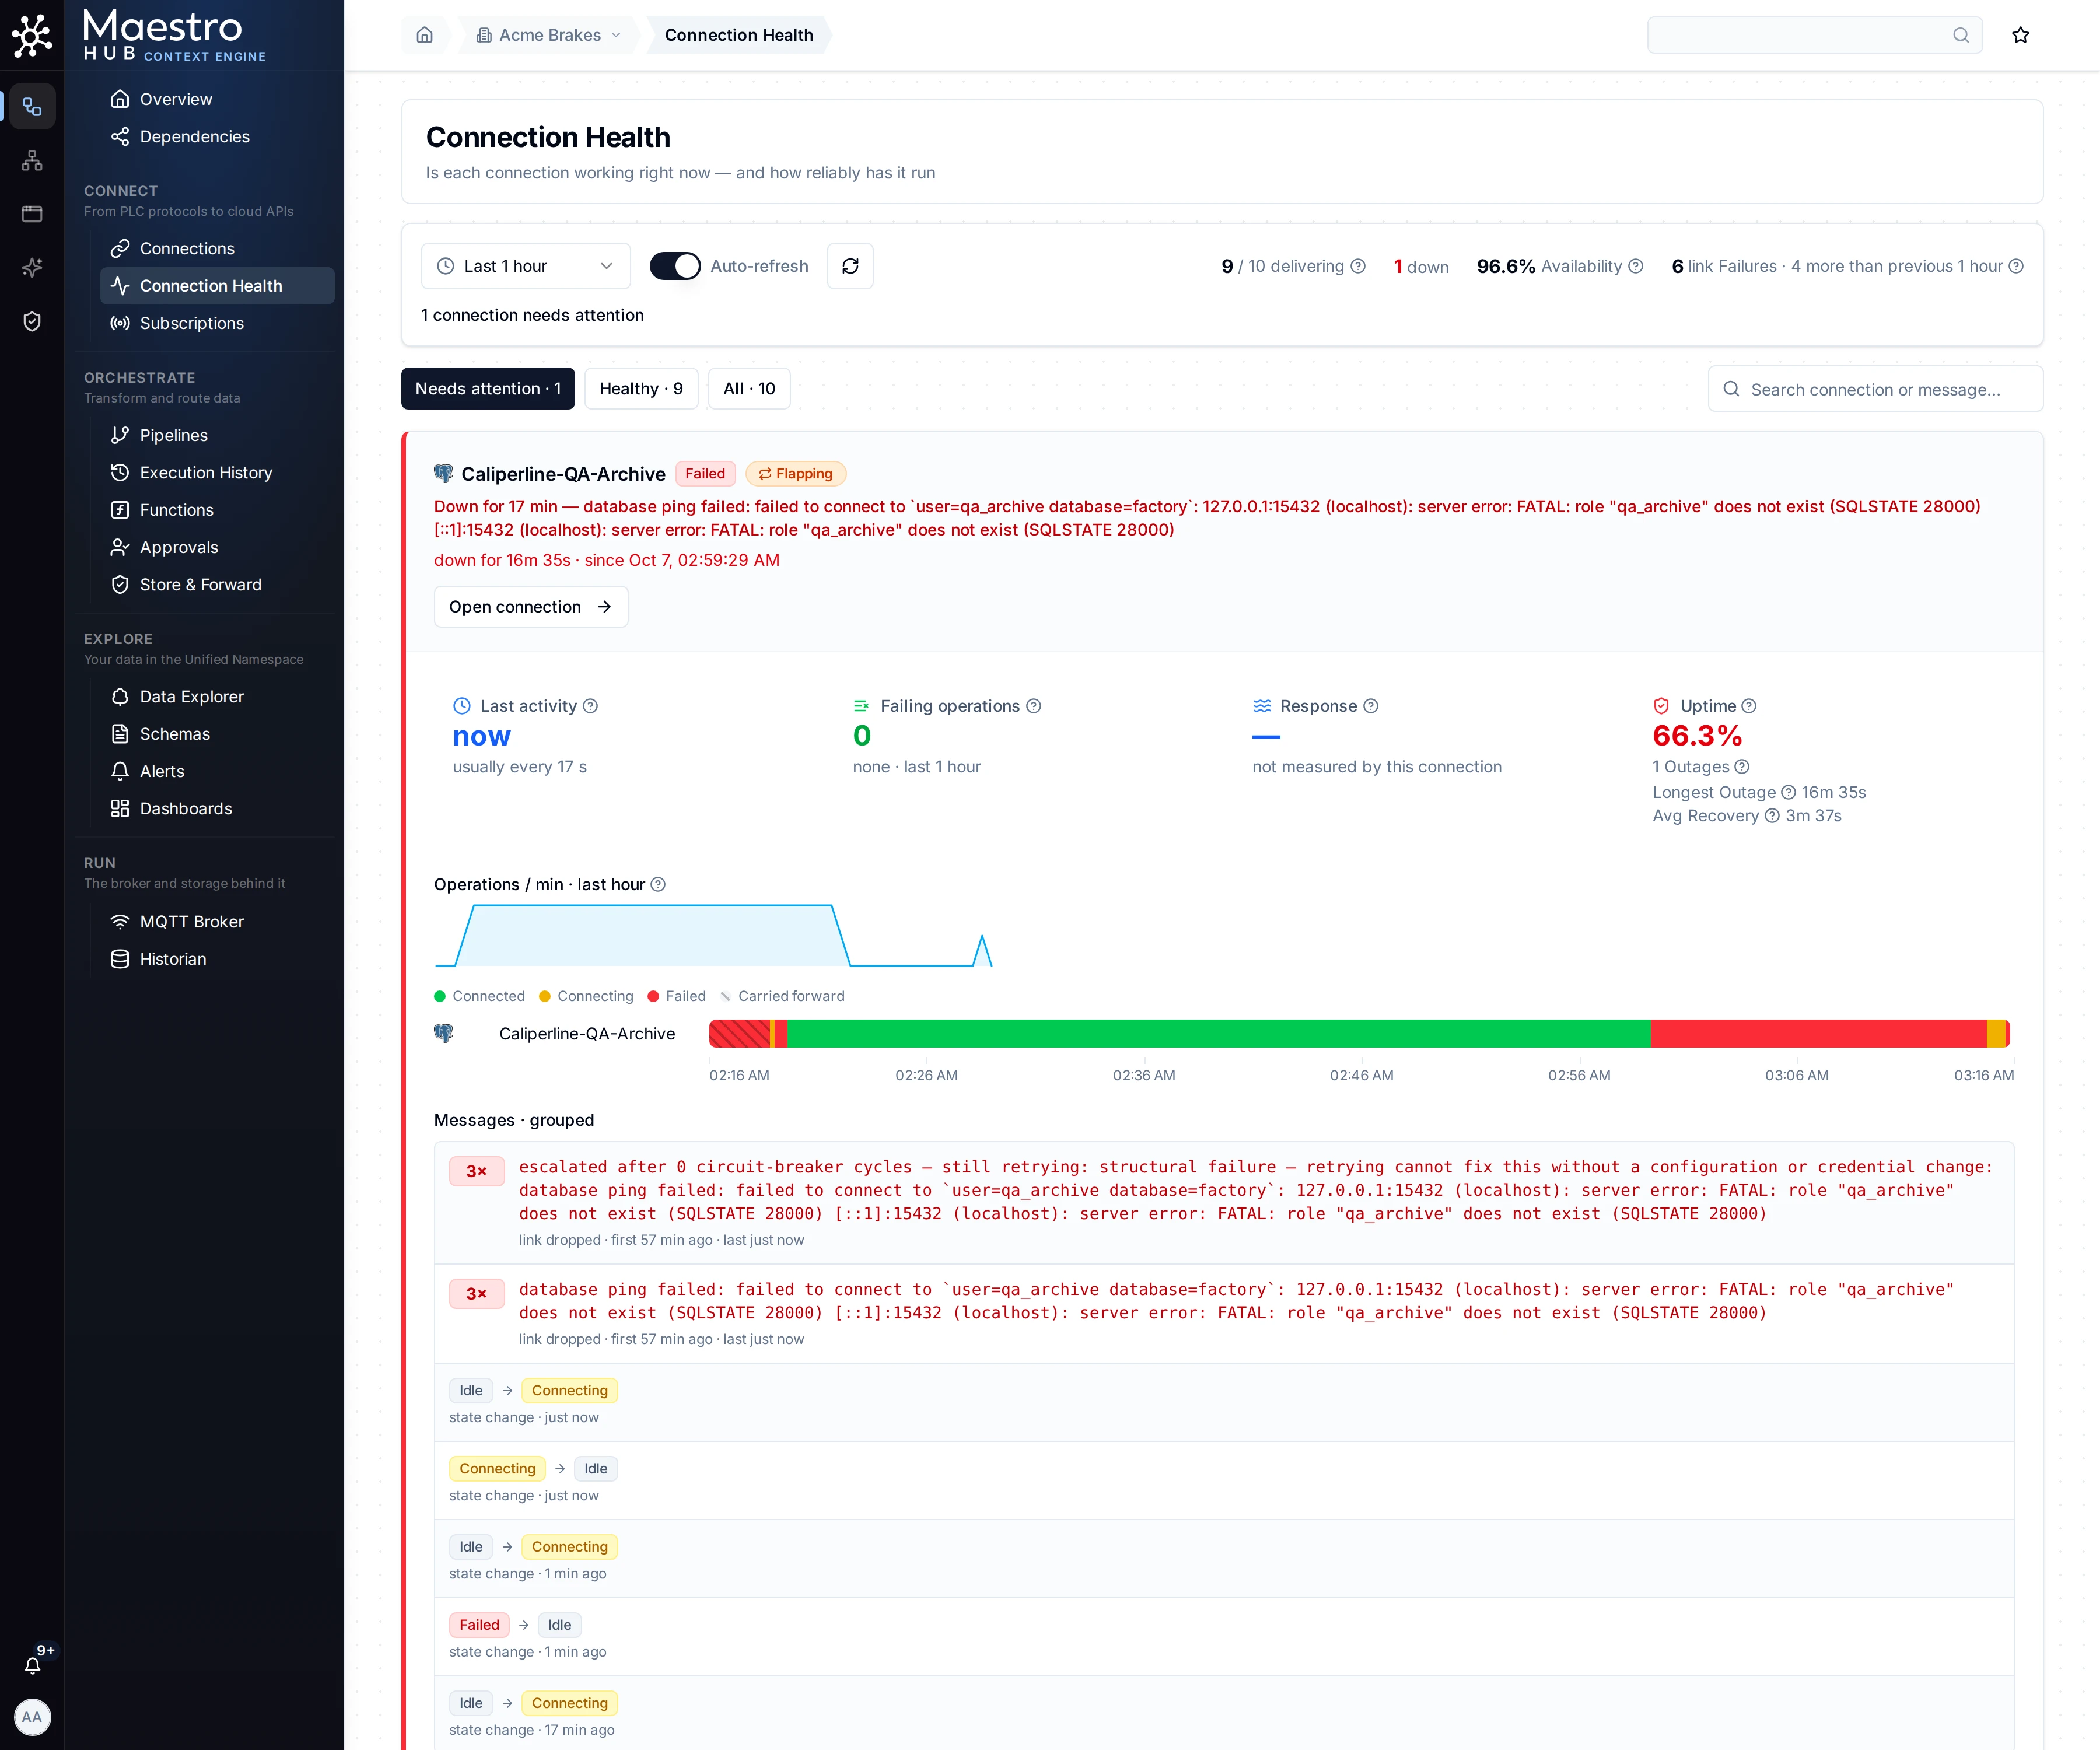
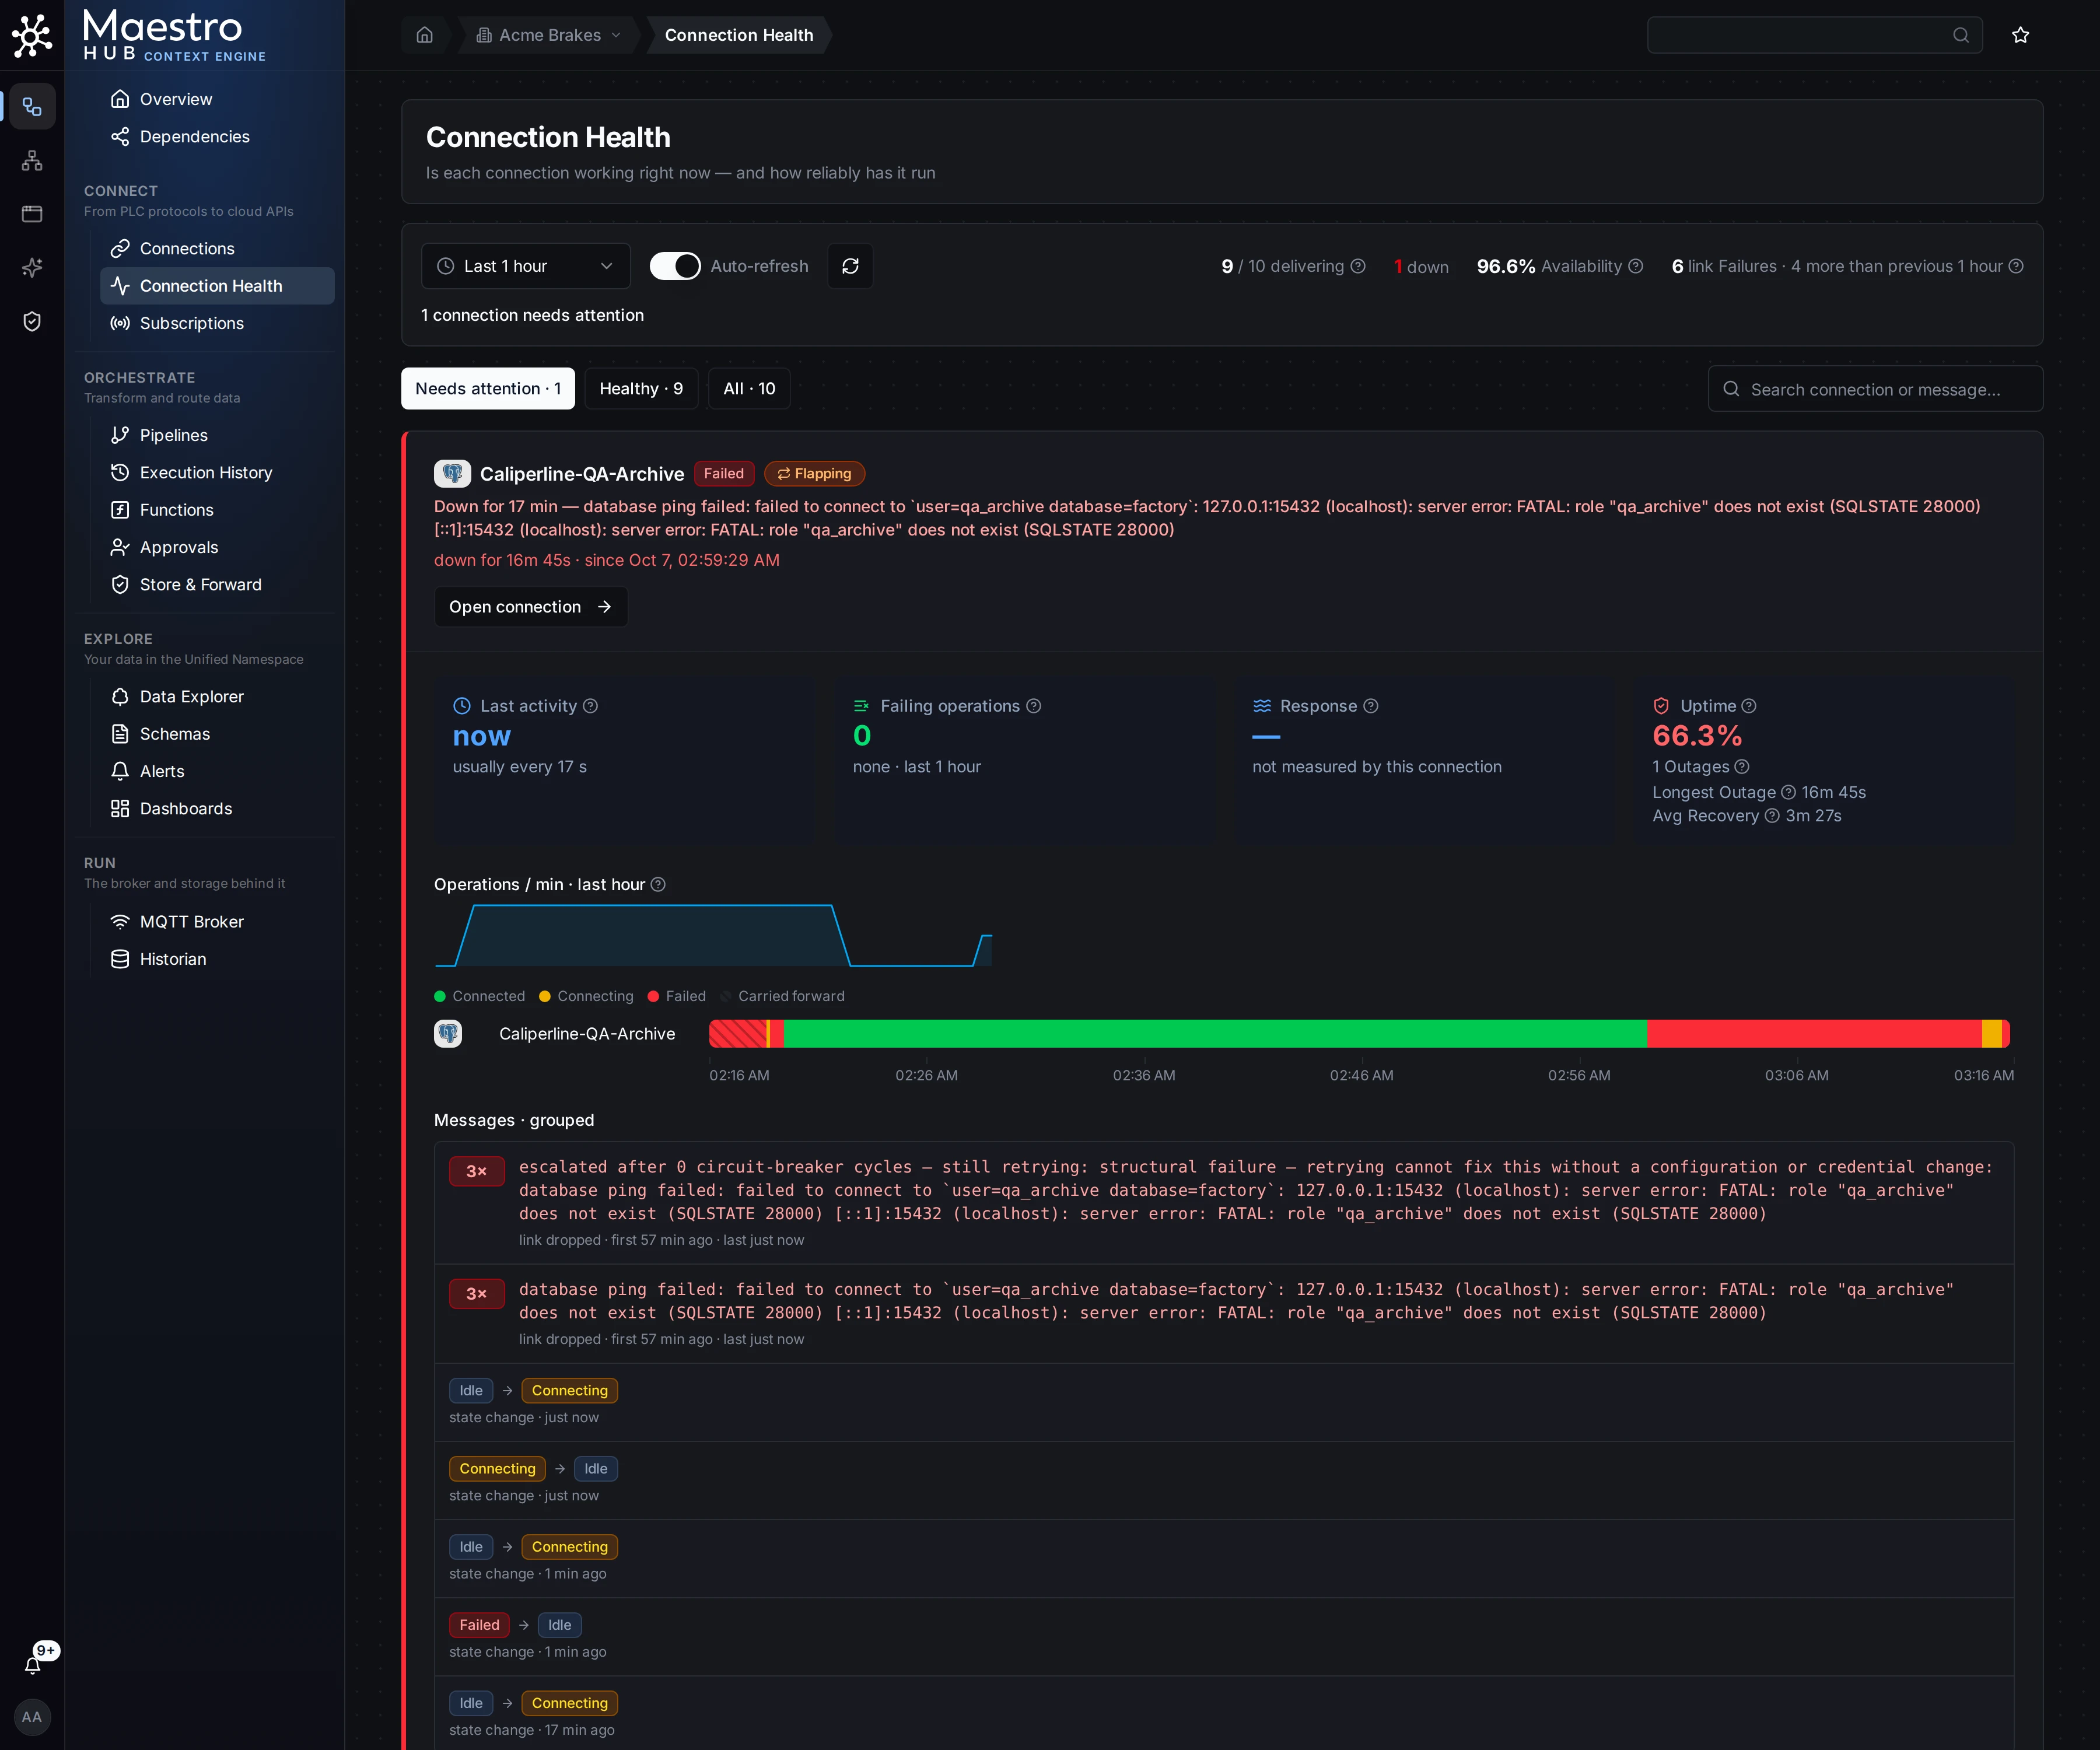
Connection Health for the last hour: the failed connection gets a card; the healthy ones fold into rows.
Time range options: Last 10 minutes, 1 hour, 6 hours, 24 hours (default), 3 days, or 7 days (maximum).
Auto-refresh: On by default: the cards refresh every 15 to 30 seconds, and the comparison with the previous period every minute. Turn it off when you are studying a specific moment. The time range and the auto-refresh setting are kept in the URL, and a connection's Health tab uses the same ones.
The numbers at the top:
| Number | What it shows |
|---|---|
| delivering | Connections that are up and doing their usual work, out of all connections. A connection that is connected but not delivering is the one to look at first. |
| down, connected but idle, failing operations | How many connections are in each condition. Each appears only when the count is above zero. |
| Availability | Average uptime of all connections over the period. It is a plain average, so a connection nobody uses counts as much as your busiest one. |
| link Failures | Link failures in the period, compared with the period of the same length before it. |
Under the numbers, one sentence says how many connections need attention, or that all of them are up and working. When nothing needs attention, it names the last problem and when it happened.
Filters and search. Needs attention, Healthy and All choose which connections are shown, each with its count. The page opens on Needs attention whenever something needs it. The search box matches connection names and message text.
What needs attention. A connection gets a card when it is in one of these conditions, worst first:
| Condition | The card's sentence |
|---|---|
| Down | Down (or disconnected, or down and reconnecting) for how long, with the last error. "Down for" counts from when the outage really began, even when that was before the selected period, and says how many times it bounced. |
| Connected but idle | The link is up, but the connection has completed nothing for five of its usual intervals, and at least two minutes. A connection that normally works every five minutes is idle only after about 25 quiet minutes. |
| Failing operations | The link is up, but operations failed in the last five minutes, with the most common error and how many times it occurred. |
| Flapping | It keeps dropping and reconnecting, even if it is up right now. |
| Degraded | A connection that runs on several replicas has some slots connected and some not. It is still serving, so this is not an outage. |
| Failed earlier | Working now, but operations failed earlier in the period. |
| Suspended | Someone suspended it, with who and why. |
Healthy connections fold into a list of rows: state, how often the connection usually works and when it last did, an operations sparkline, the response time, uptime and failed operations. Click a row to open its full card, and click again to fold it.
A connection's card:
- Last activity: when the connection last completed a read, a write or a message, and how often it usually does.
- Failing operations: operations your pipelines asked of the connection that came back failed, with the most common error.
- Response: how long the device or service takes to answer, on average since the connection last connected, and how far that average moved over the period. Not every kind of connection measures it.
- Uptime: the share of the period the connection was not in an outage, with the number of outages, the longest one and the average recovery when there were any. Time before the history starts is left out, and Degraded time counts as uptime. A connection that has just started shows
—until it has stayed connected for a minute: a connection is recorded only once it has held, so until then there is no time to measure. A start that fails shows 0% at once. - Operations / min · last hour: a sparkline of the work the connection completed. A flat line at zero while the link is up is a connection that is connected but not working.
- The timeline: one bar of the connection's states over the period.
- Messages · grouped: errors grouped by message, each with how many times it occurred, when it first and last occurred, and whether it was a dropped link or a failed operation. After the errors come the most recent state changes, including the moments MaestroHub stopped.
Failed operations are counted the same way for every kind of connection. Each connection keeps up to 20 different messages. A new message after that is counted as "other errors": the count stays exact, only the wording is lost.
Activity is kept for 24 hours, and only since MaestroHub started. On a 3- or 7-day range, the activity numbers cover the last 24 hours, and the card says so. After a restart the card says how long activity has been watched, and for the first few minutes that it is too early to say whether the connection is working. Activity is counted by the whole minute, so the latest operations show within about a minute.
What counts as an outage. An outage is time when no slot of the connection was connected. It ends only when the connection has been connected again for a full minute: a reconnect that drops again sooner is a brief reconnect inside the same outage, not a recovery, and shows as "bounced N×". Uptime, outages, the longest outage, average recovery and "down for" all use this one definition, and so do the connection notifications. A restart of MaestroHub during an outage does not end it.
Click Open connection on a card to open the connection.
Per-Connection Health Tab
Navigation: Connect → Select Connection → Edit → Health tab
A connection's Health tab shows its card from Connection Health: the same numbers, timeline and messages, from the same data, so the page and the tab never disagree. View System Dashboard opens Connection Health.
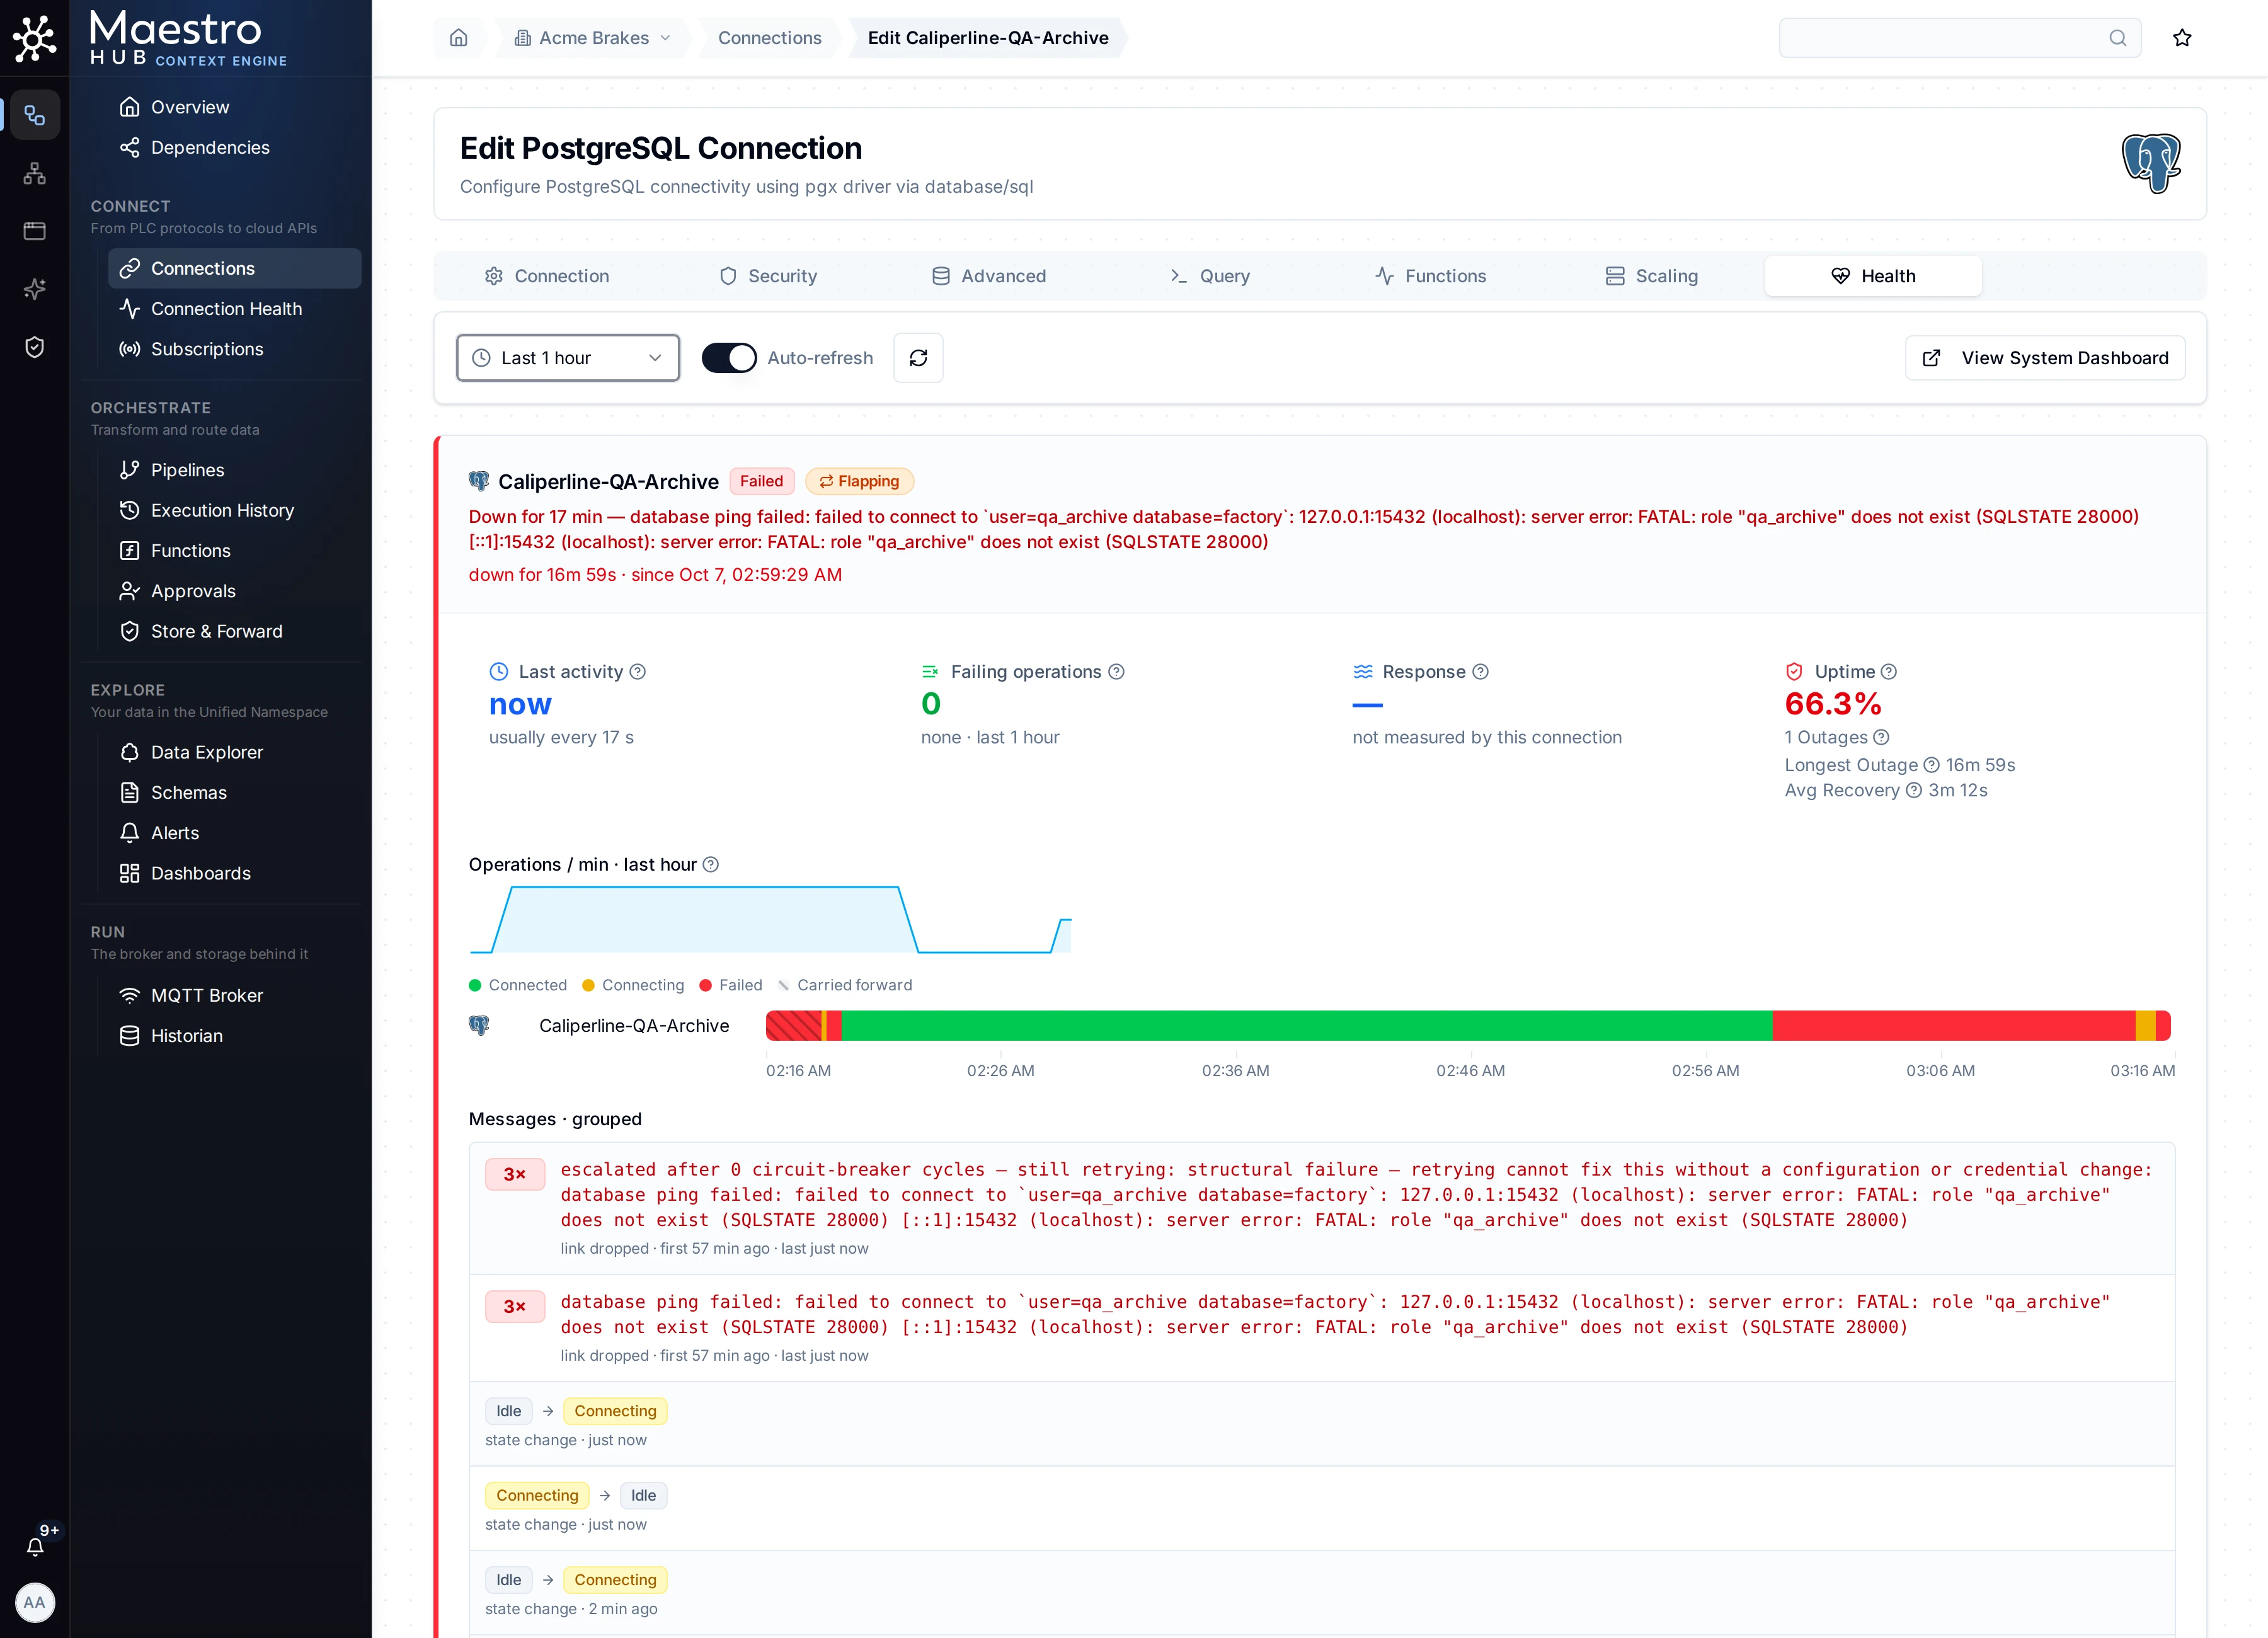
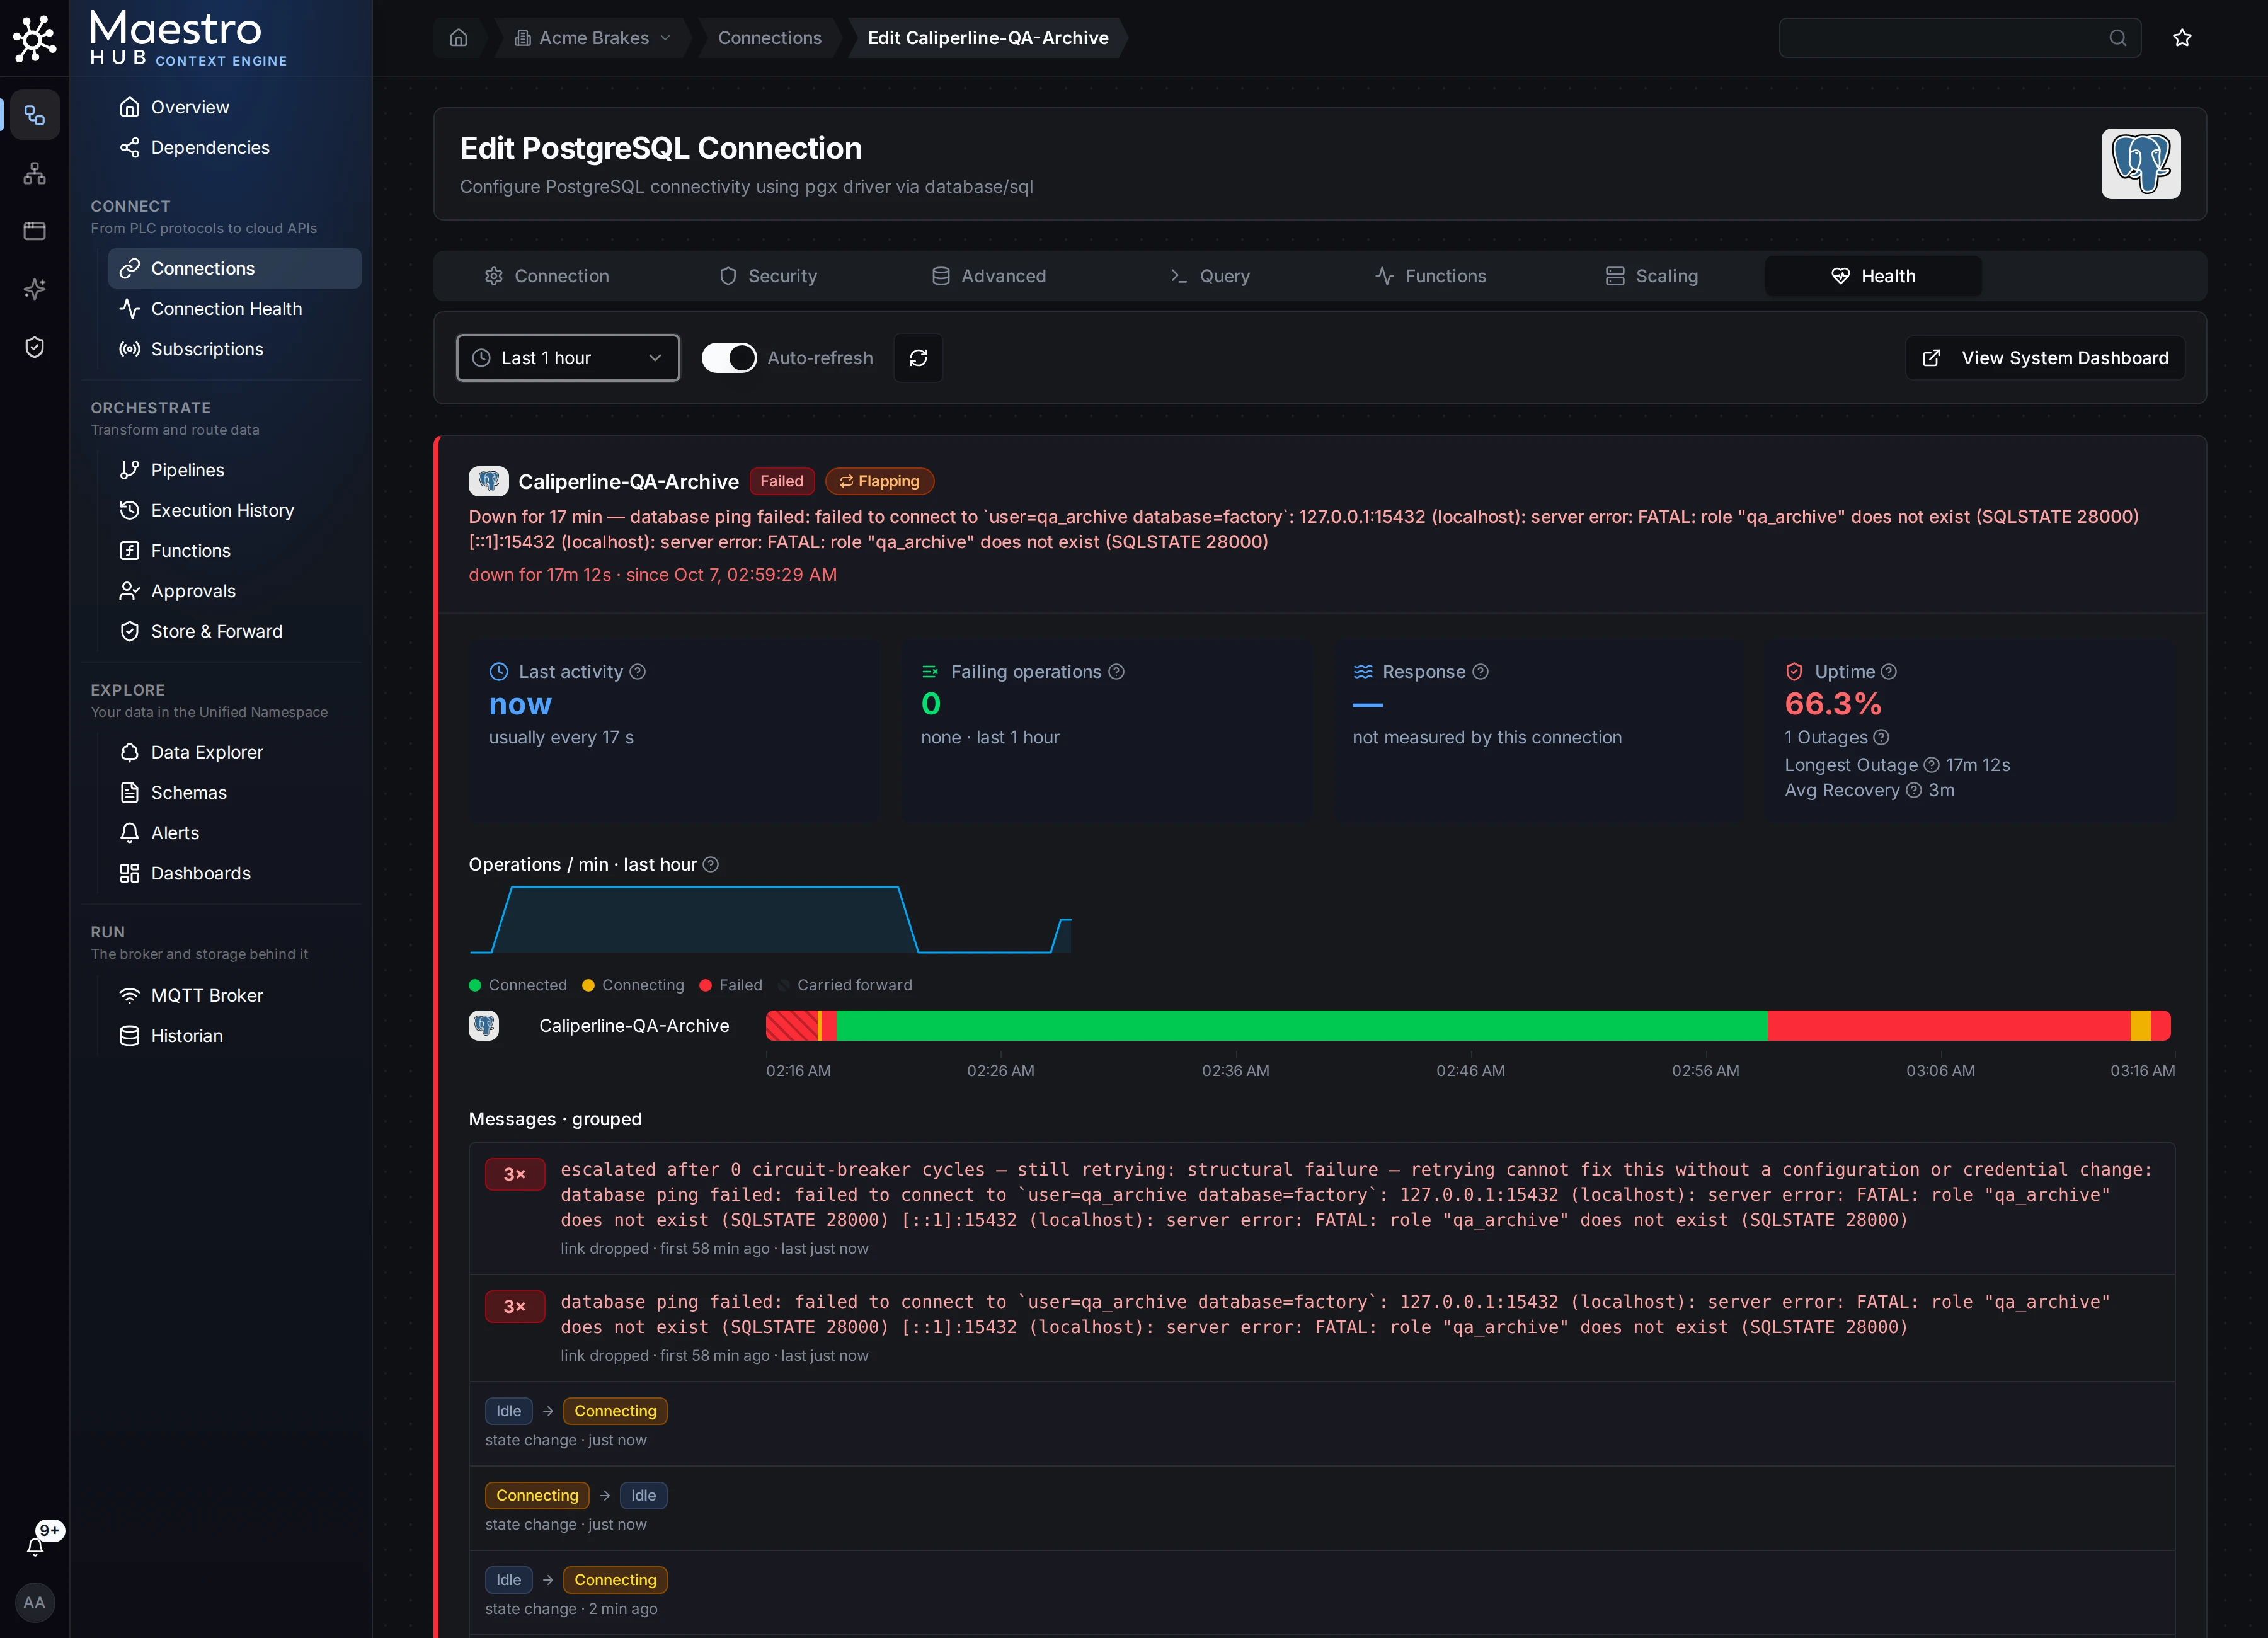
Health tab of the failed PostgreSQL connection over the last hour.
For a connection that runs on several replicas, the tab also lists the replica slots and which one holds the connection now. The timeline then shows the connection as a whole: down only while no slot was connected.
Connection Limits
| Limit | Value |
|---|---|
| State history kept | 7 days |
| Maximum history range | 7 days |
| Activity kept | 24 hours, since MaestroHub started |
| Different error messages per connection | 20, the rest counted as "other errors" |
| State changes on a card | 5 most recent |
| State history read for one range | 1,000 changes; the timeline says when there are more |