Alerts
See threshold alerts and validation violations for every topic in one place, then acknowledge, shelve or route alerts to Slack, Teams or a webhook.
- Where
- Explore › Alerts
- Shelve for
- 1 hour · 8 hours · 24 hours · 7 days
- History kept
- 90 days
- Permission
- alert:ack to acknowledge or shelve
The Alerts page is where MaestroHub surfaces two related but distinct signals about your UNS data:
- Alerts answer "is the machine in trouble?": a value crossed a warn or critical limit set on a property.
- Violations answer "is the data broken?": a publish broke its property's rules (wrong type, out of range, stale, unit mismatch).
Both are produced automatically once a topic has a meaning. No separate alert rules are required; the limits live on the property and apply to every topic that has it as its meaning. A topic's meaning can also set its own limits over the property's.
Three checks, two surfaces. Rejected publishes and degraded-quality data show up under Violations ("is the data broken?"). Threshold crossings show up under Alerts ("is the machine in trouble?").
Alerts vs violations
Alerts and violations come from the same property on the same publish, but they are produced by two independent steps that run in order: validation first (which produces violations), then alert evaluation (which produces alerts). A gate connects the two:
- A rejected publish never fires an alert. A type mismatch (or any violation where the branch's validation rule is enforce) rejects the publish before it is stored, so alert evaluation is skipped. The publish surfaces only as a violation.
- A soft violation can produce both. A value outside the property's range is stored with degraded quality (a range violation) and, since warn/critical thresholds sit inside that range, the same value also crosses a threshold and fires an alert. One publish appears on both tabs.
- Most alerts have no violation. A perfectly valid value that simply crossed a warn/critical threshold produces an alert and no violation, the common case.
Using the CNC temperature example (hard range 0–120 °C, warn 70, crit 85):
| Published value | Result | Violation | Alert |
|---|---|---|---|
"ERR" (text) | Type mismatch → rejected, not stored | Yes | No |
75 | Valid, above warning threshold | No | Yes (warning) |
92 | Valid, above critical threshold | No | Yes (critical) |
130 (outside hard range) | Range violation → stored with degraded quality | Yes | Yes (critical) |
26 | Healthy | No | No |
The two feeds are stored and queried separately. They appear as separate tabs on the workspace-wide Alerts page and as separate panels in a topic's What went wrong section in Data Explorer. See Libraries › Validation rules on the topic tree for what each rule does with a value that breaks its property's rules.
Defining thresholds
Alert limits are set on a property, on its Alarm and sampling tab in Libraries. Only numeric properties can carry them. A topic's meaning can set its own limits for that topic alone; the ones it leaves empty are the property's.
| Setting | Meaning |
|---|---|
| Warning min / max | Soft bounds. A value past these (but inside critical) raises a warning alert. |
| Critical min / max | Wider soft bounds. A value past these raises a critical alert. |
| Deadband | Hysteresis that prevents flapping (see below). |
| Message | An operator-facing remediation hint, copied onto every alert this threshold produces. |
| Warnings are urgent | Treat a warning on this property as critical when routing and escalating it. Needs a warning limit. See Level and severity. |
Thresholds may be one-sided (only a max, only a min) or two-sided. If both a warning and a critical threshold apply to the same value, critical wins.
Range vs alert limits. A property's range is a hard bound: anything outside is a range violation. Warn/critical thresholds are soft bounds inside the valid range; crossing one fires an alert but the data is still valid and stored.
Level and severity
Every alert carries two values that usually agree:
- Level is the threshold the value crossed:
warningorcritical. - Severity is how urgent the alert is. Notification channels filter on it, critical alerts get escalation reminders, and the Overview colours a critical row red.
By default, severity follows level: a warning alert has severity warning, a critical alert has severity critical.
Tick Warnings are urgent when crossing the warning limit already needs someone right away, for example the soft limit of a vaccine cold room. A warning on that property then has severity critical: it reaches Critical only channels and gets escalation reminders. Its level still says warning, and the Alerts page marks the row urgent so the two values do not look contradictory. A critical alert is always critical, so the box needs a warning limit to do anything.
In the API the box is the limits' severity field: critical turns it on. info and warning change nothing, because a property can raise an alert's severity but never lower it.
How an alert fires: the deadband state machine
Every numeric publish to a topic with a meaning runs through an alert state machine. An alert has a level (none, warning, critical) and a direction (low or high). It moves between levels on two kinds of edge, and the property's deadband rule says where they are:
- ISA-18.2 (every property made in 3.0): the alert fires as the value crosses the limit, and clears once the value is back past the limit by the deadband. With a warning at
70and a deadband of2, the warning fires at 70 and clears at 68. - Carried over (a property that came from a data schema of an earlier 3.0 build keeps the schema's rule, so its alerts fire exactly where they did): the alert fires once the value is past the limit by the deadband (72) and clears once it is back past it by the deadband (68). It can be switched to ISA-18.2 in Libraries; the switch is one way.
Between those points the alert holds its state and emits nothing. This deadband anti-flapping is what stops a value bouncing around a threshold (69, 71, 70, 72…) from producing an alert storm. Set the deadband to 0 to fire immediately on any crossing.
An alert fires once per incident and clears once per recovery. Repeats at the same level produce no new event.
The How alerts work dialog on the Alerts page includes a live deadband simulator of the carried-over rule, which is useful for seeing how a deadband stops flapping before you set one on a property.
The Alerts page
Open Explore › Alerts. The page has these tabs, each covering every topic in the workspace you may read:
- Active alerts: alerts that are open: not cleared, not acknowledged and not shelved. This is the operator's working list.
- Shelved: alerts that someone has shelved and whose shelf has not expired yet. A shelved alert is hidden from Active alerts and listed here.
- Alert history: every fire and clear transition, newest first. A flapping alert is one row on Active alerts but one event per fire and per clear here. When an alert fires for the tenth time within ten minutes, it is chattering, and its next transitions are counted into that tenth fire's row instead of each adding one: the row reads fired ×N and says how many times it fired and cleared, and over how long. Events are kept for 90 days; Load older events pages further back.
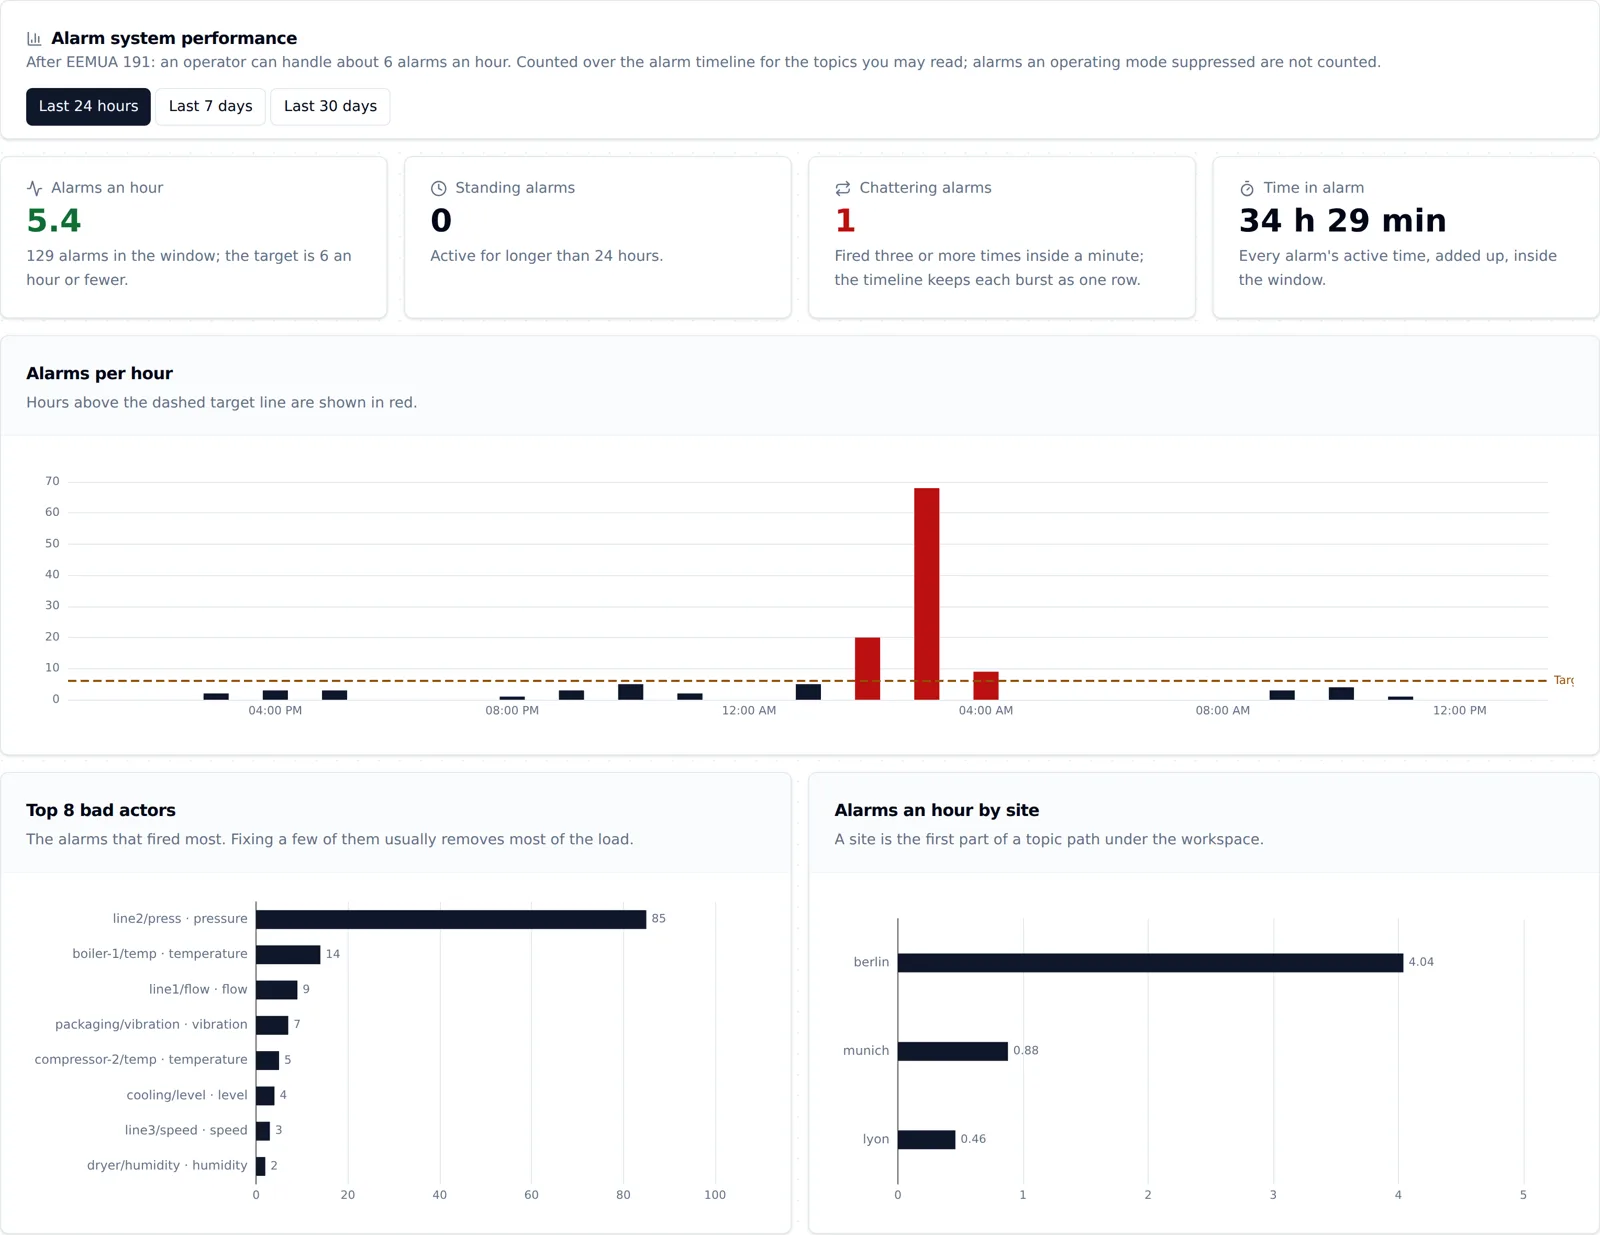
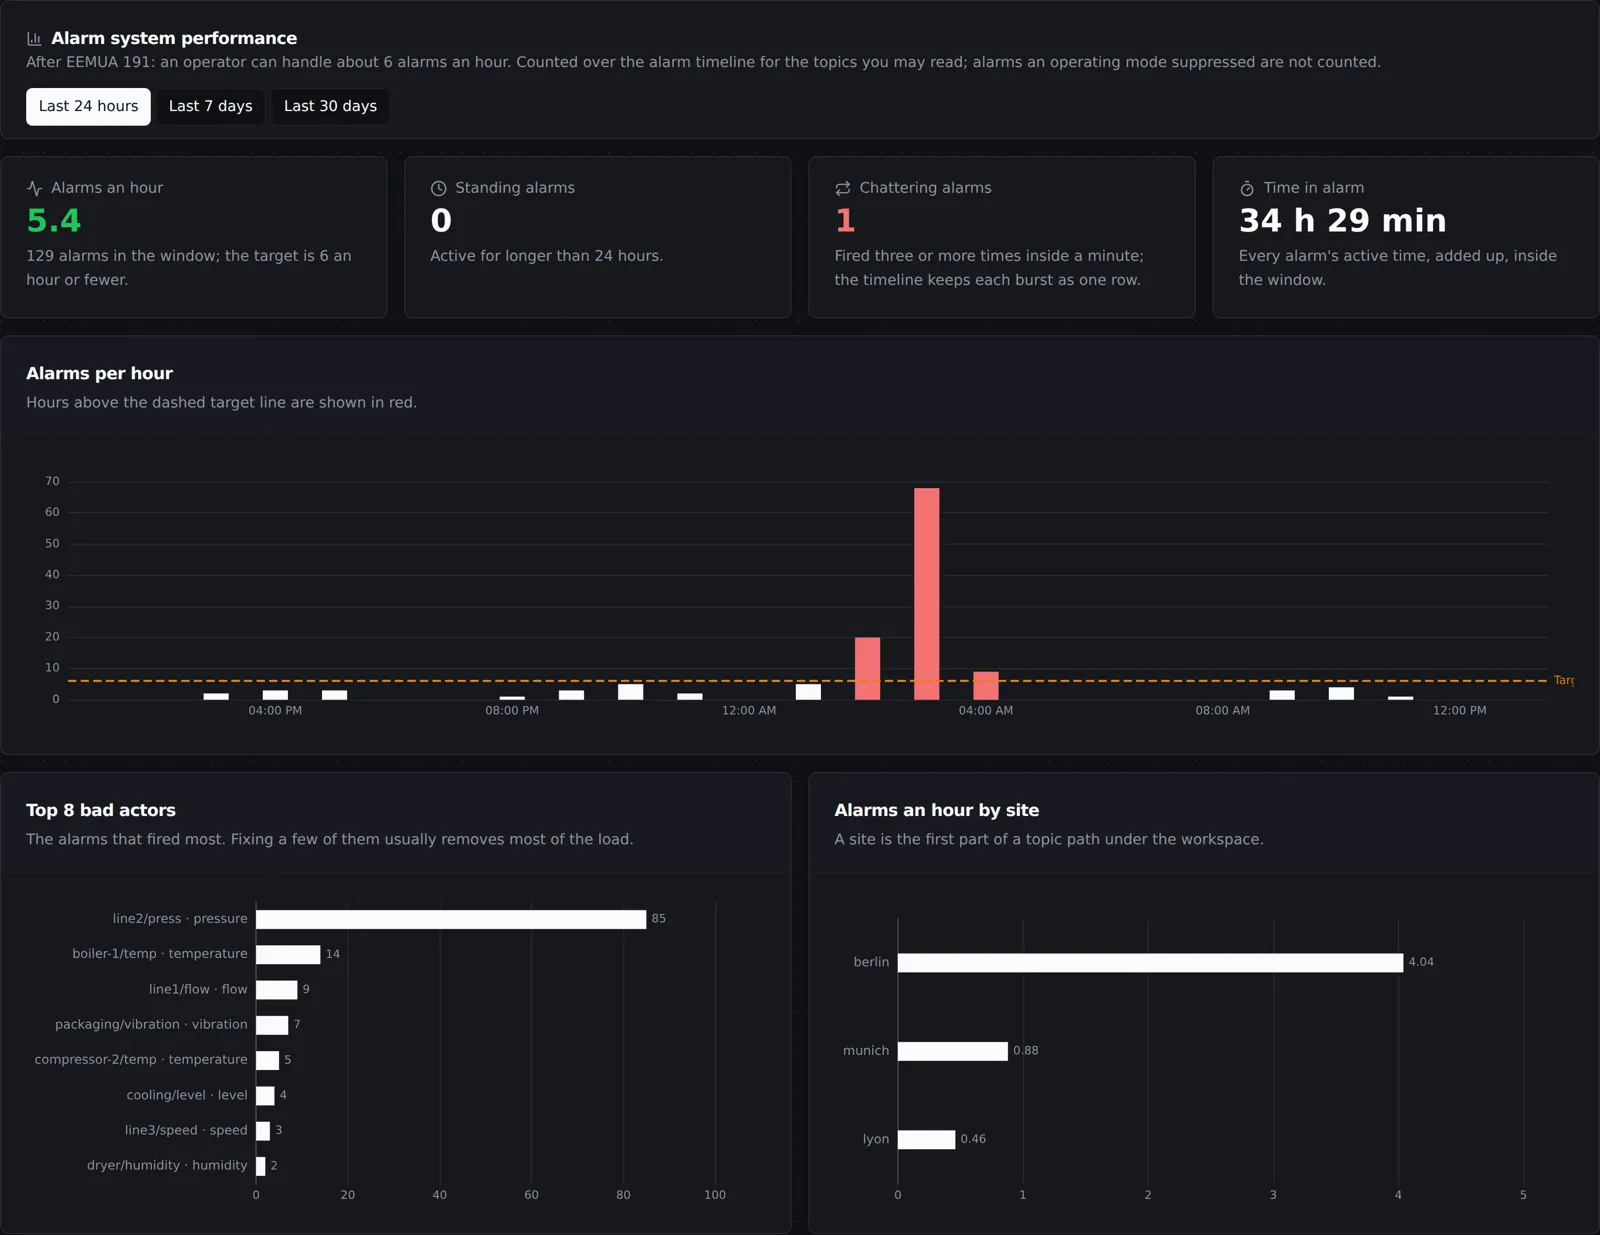
- Alarm KPIs: how the alarm system performs, after EEMUA 191, over the last 24 hours, 7 days or 30 days: alarms per hour against the target of about 6 an hour per operator, per hour and per site; the 10 alarms that fired most (the bad actors); standing alarms (active for more than 24 hours); chattering alarms (three or more fires within a minute); and the total time in alarm (wall-clock: a warning and a critical active together count once). Only the topics you may read are counted, and alarms an operating mode suppressed are not.
- Violations: the data-integrity feed: rejected publishes and degraded-quality records. A row's Action says what happened to the record: rejected, stored, or nothing arrived for a topic with a meaning that is not receiving data, where no value came to store or refuse.
- Ingress rejects: MQTT publishes that the MQTT write endpoint refused, so they were never stored. Rows are grouped by device, topic and reason, with a count and when the reject was last seen. This tab needs the
uns_ingress_rejects:readpermission.
Each alert row shows when it fired, its level (warning/critical) and direction (high ↑ / low ↓), the threshold and the value that breached it, the unit, how many times it has fired, its state (active/cleared), and the remediation message from the property.
Alerts are scoped per topic (and per attribute, level, and direction). The same property given to a hundred topics produces a hundred independent alert states: one machine can be in warning while the rest are healthy.
Who sent the bad values
The Violations feed shows each topic's latest violation. How often each sender's values failed, over time, is counted apart, and read through the API:
GET /api/v1/uns/topics/{id}/violations/conformancecounts one topic's failures, andGET /api/v1/uns/violations/conformancethose of every topic you can read.groupBytakes any ofsite,branch,producer,propertyandreason, comma separated. Each group gives how many records failed, how many were refused, and when it was first and last seen. Grouped bybranch, a branch's validation rule is taken only from topics you can read.- A topic names its 50 most recent senders. A new sender that arrives while all 50 are active is counted under
other. A named sender that has been quiet for an hour gives up its place to the next newcomer, and its counts move toother. Quiet is measured in the newcomer's own time, so a device replaying old values does not push out the senders it is replaying beside, and a timestamp far in the future is stored as at most five minutes ahead. Totals never drop. GET /api/v1/uns/topics/{id}/violations/conformance/foldedsays how many earlier senders have moved intootheron that topic.
Each route counts only topics you have topic:read on.
On a topic's page, the same counts by sender, with the other note, are under What went wrong: open Show every alert and violation row, then Who sent them below the topic's violations.
Acknowledging and clearing
Acknowledging an alert marks it as seen: you are aware and handling it. It is different from clearing, which happens automatically when the value returns to normal. An alert can be active (not cleared) yet acknowledged.
If an acknowledged alert re-fires (the value crosses the threshold again after recovering), the acknowledgement is reset, because it is a new incident. A previous dismissal never silences a fresh problem.
Acknowledging, shelving and unshelving all need the alert:ack permission (Data Admin, Data Engineer or Workspace Admin), and so does acknowledging a violation. Without it, Ack, Shelve and Unshelve are disabled wherever they appear (Active alerts, Shelved, Violations, and a topic's What went wrong list), and each one says what it needs.
Shelving
Shelving parks a known alert for a fixed time, for example a sensor that flaps while a machine is being repaired. Click Shelve on an alert row, pick 1 hour, 8 hours, 24 hours or 7 days, and say why: the reason is required, and it is what the next shift reads.
- The alert leaves Active alerts at once and is listed on the Shelved tab. Nothing is deleted.
- Unlike an acknowledgement, a shelf survives re-fires: the alert can fire and clear any number of times and stays shelved until the shelf expires.
- When the shelf expires, the alert returns to Active alerts by itself (if it is still active).
- A shelf applies to the whole workspace, not only to you. Hover the shelved badge to see until when, and who shelved it.
- A shelved alert sends no notifications, and a critical alert is not escalated while it is shelved.
- To end a shelf early, click Unshelve on the row. The alert is live again immediately.
Shelving needs the same alert:ack permission as acknowledging. Every shelve is recorded in the audit trail.
POST /api/v1/uns/alerts/shelve still accepts a request without reason. The shelf is recorded with the reason "no reason given" and the response carries a Warning header. A future version will refuse such a request; send reason. The UI and the MCP tool already require it.
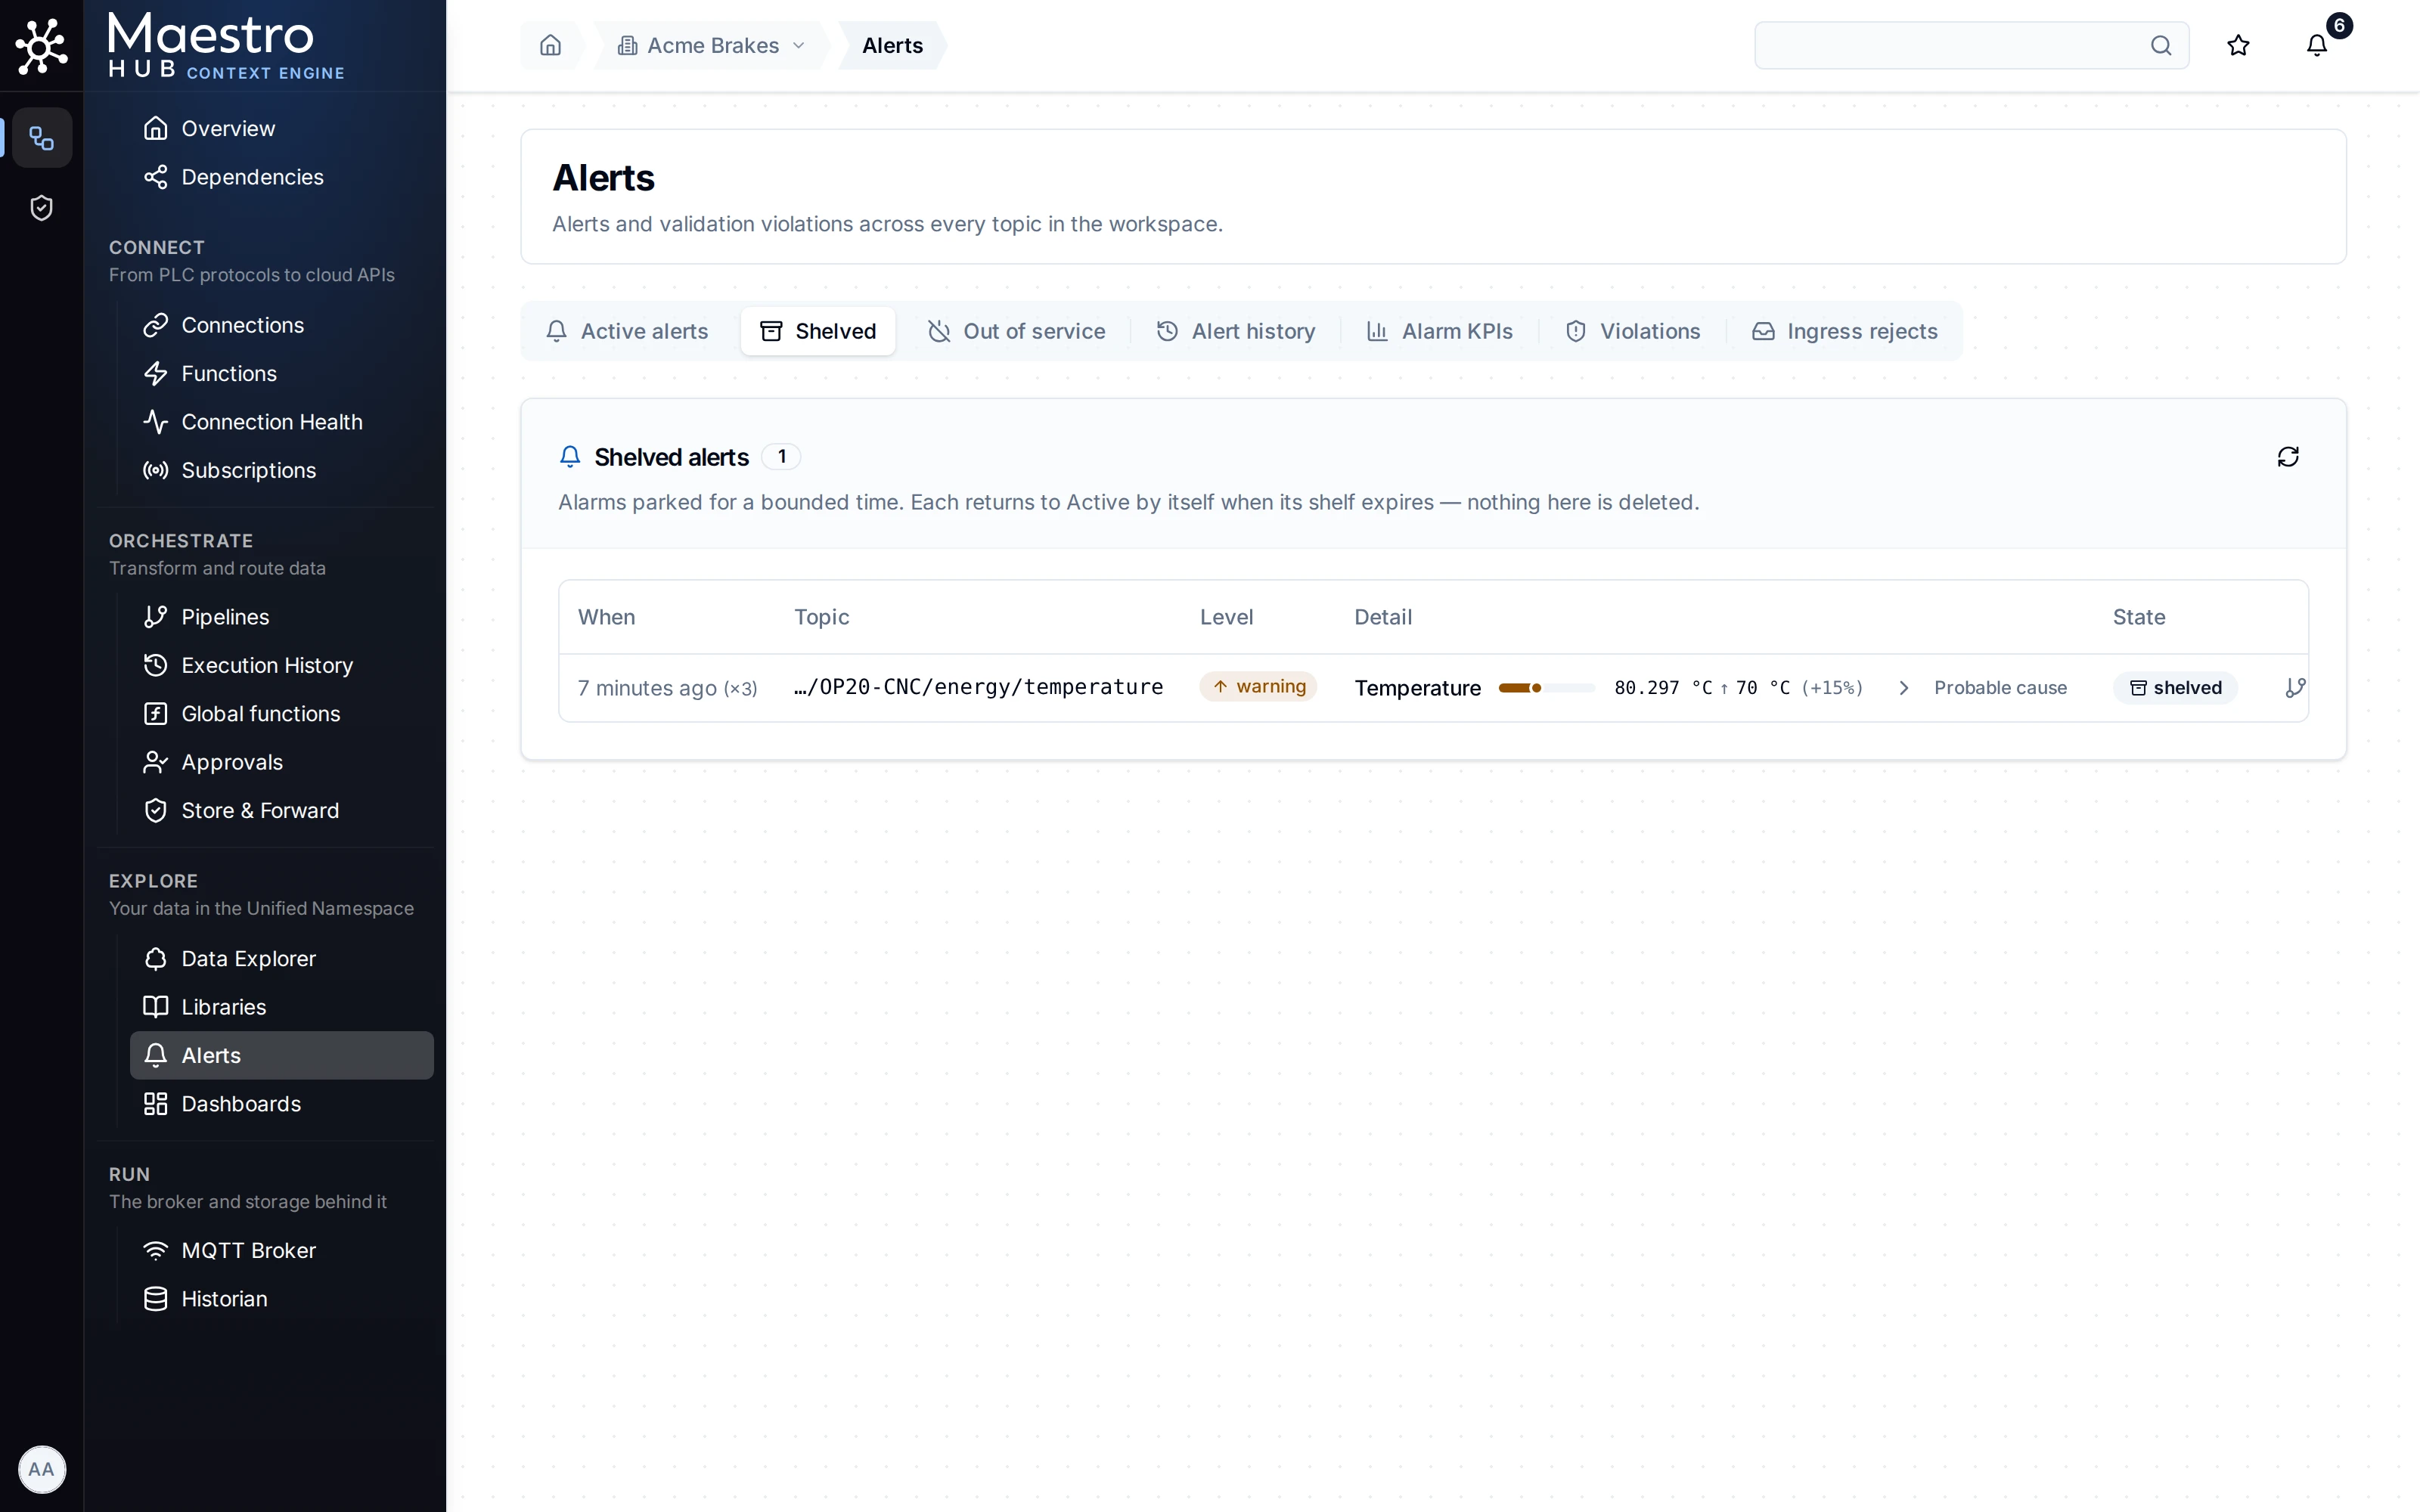
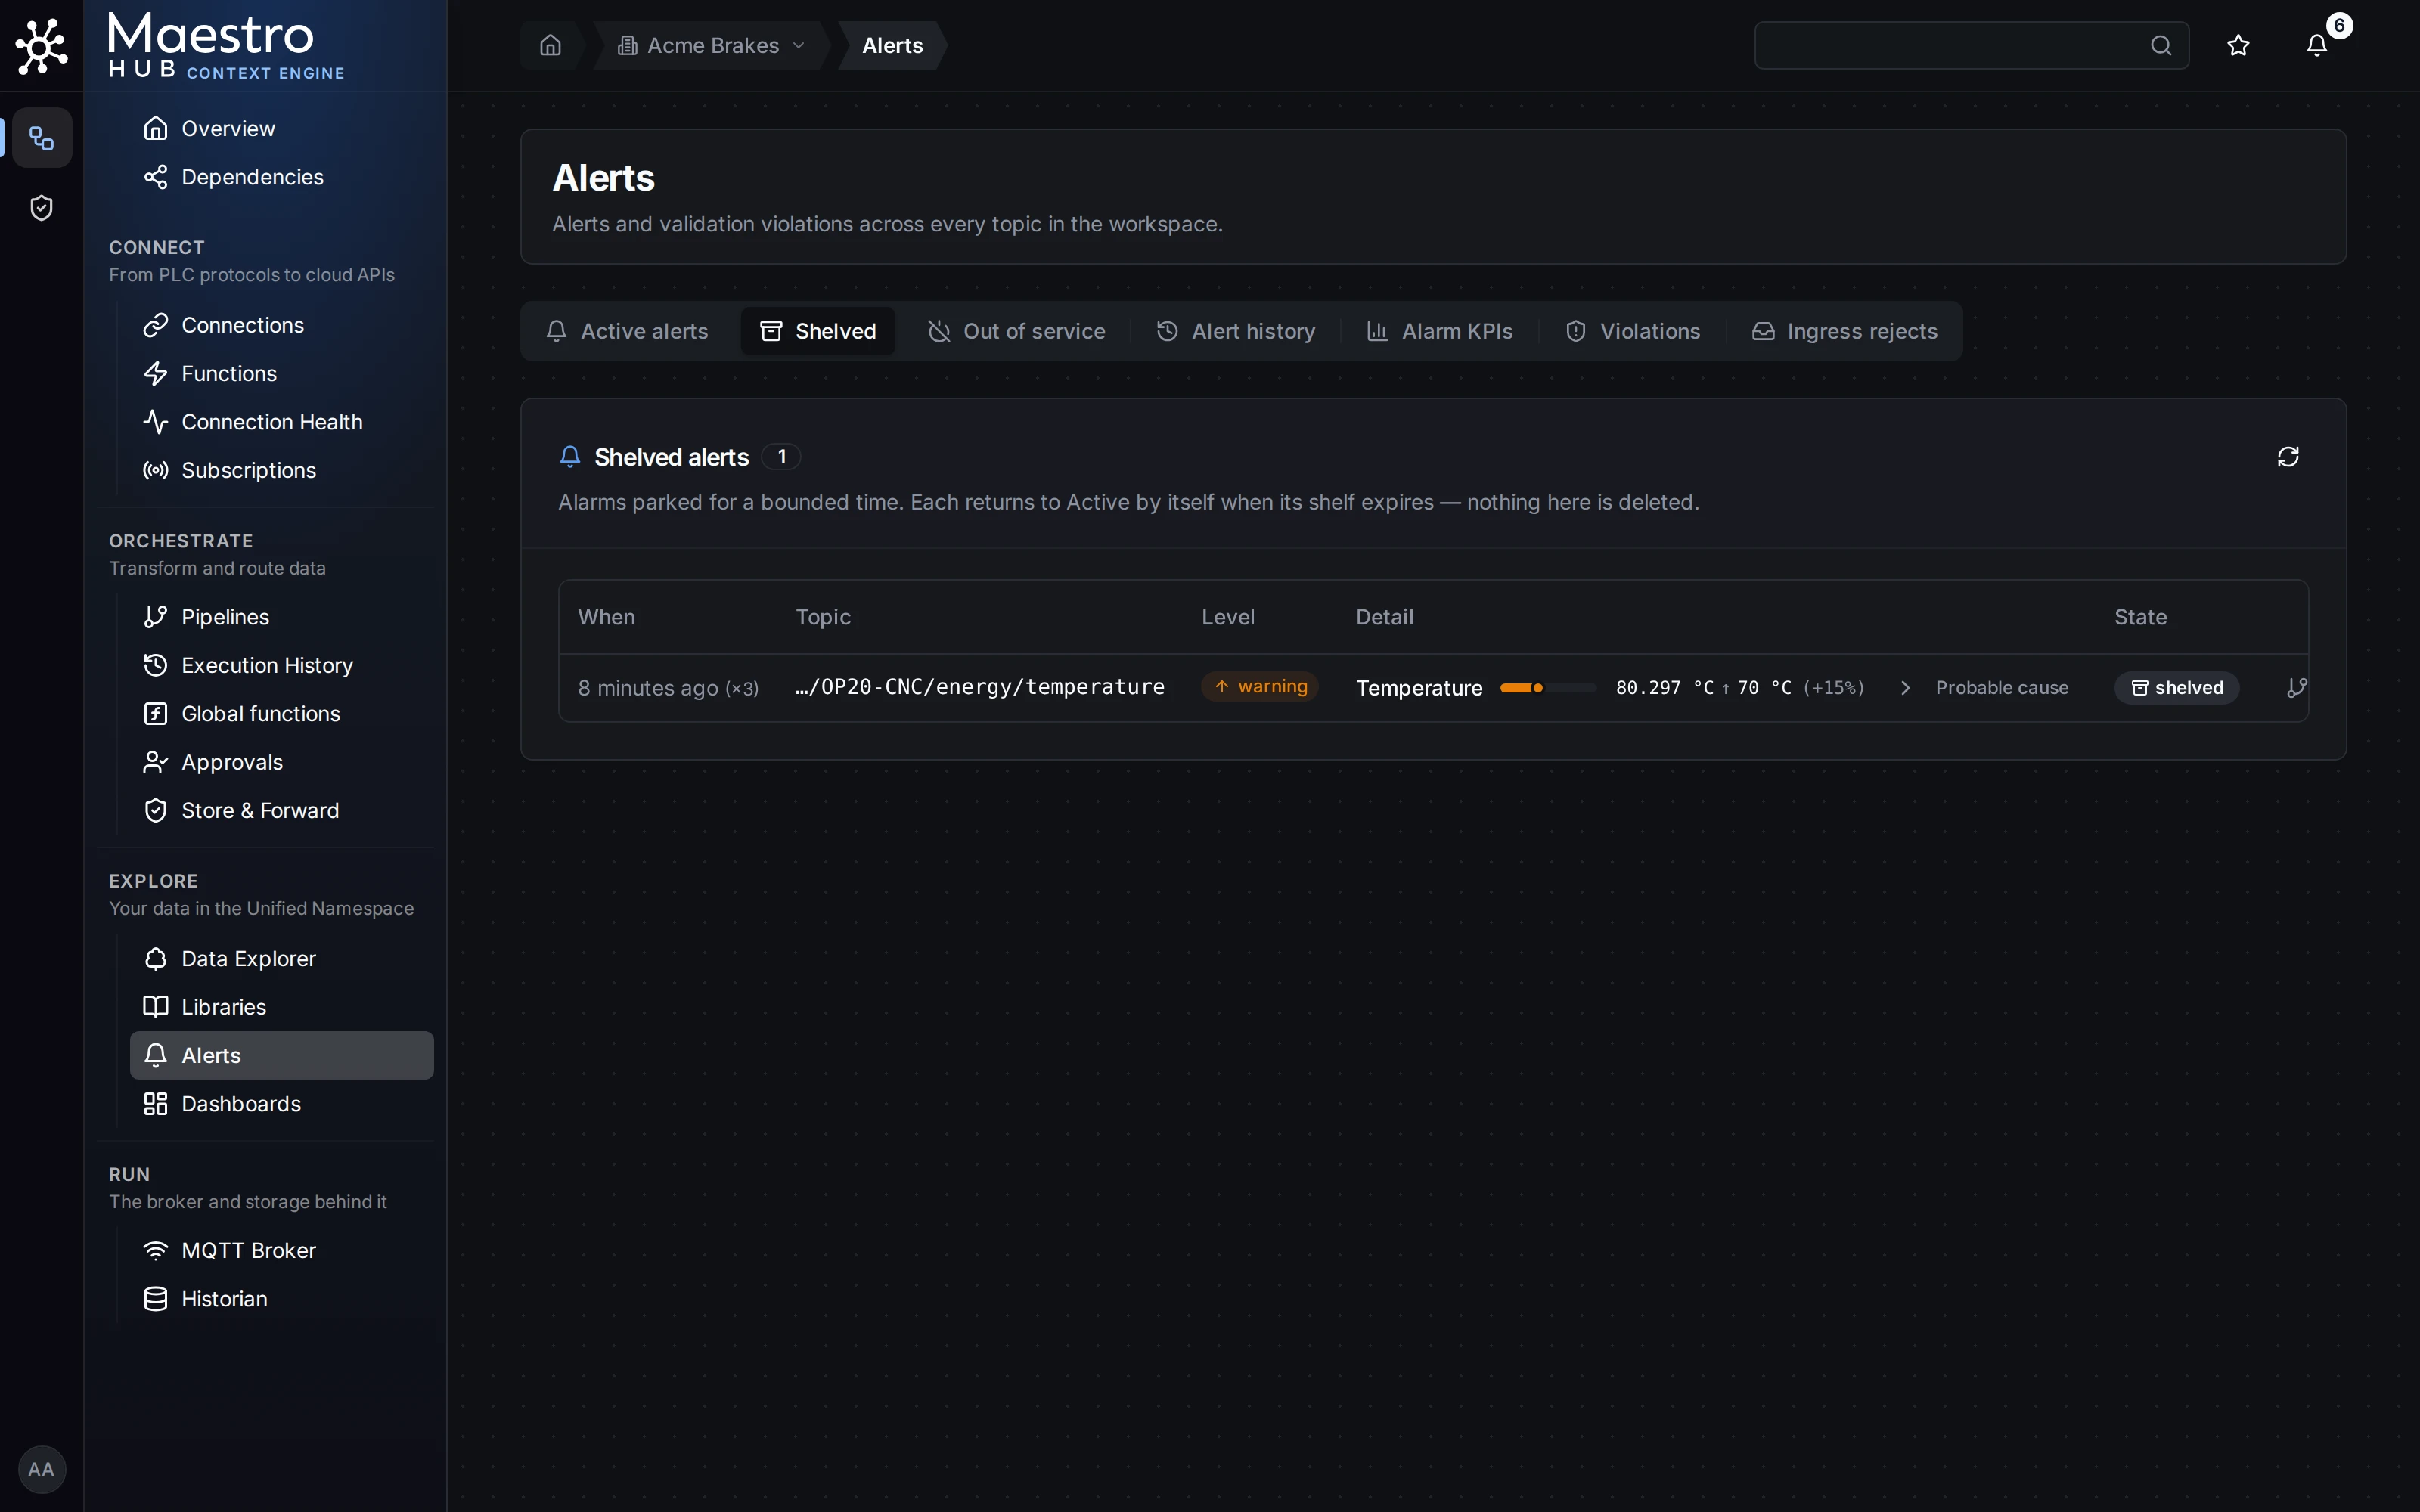
A warning alert shelved for 8 hours, with Unshelve
Worked example: alerting on a CNC temperature topic
This walks the whole loop on one real topic: define a property, give a topic that meaning, watch an alert fire, then trigger both kinds of violation, using a CNC machine's temperature reading.
1. The property. A property named temperature in a CNC library: a number in degrees Celsius, range 0 to 120, warning at 70, critical at 85, deadband 2. It is defined once in Libraries and can be given to every CNC's temperature topic.
2. The meaning. Give the topic …/OP20-CNC/energy/temperature that meaning from its page (see Giving a topic a meaning), with the branch's validation rule left at observe. Every publish to that topic is now converted, validated and alert-checked.
3. An alert fires and clears. The machine heats up to about 90 °C. The readings cross the 85 °C critical threshold, so a critical alert fires.
As the machine cools back to about 74 °C, the readings drop below 85 °C by more than the deadband, which clears the critical alert automatically. It now lives in the Alerts history rather than the active list. 74 °C is still above 70 °C, so the warning alert stays active until the temperature falls below 68 °C (70 °C less the deadband).
4. A range violation. A reading of 130 °C is published. It is a number, so it is not rejected, but it is outside the 0 to 120 range, so it is stored with degraded quality and a range violation is raised. It also crosses 85 °C, so the critical alert fires again: one publish can raise both an alert and a violation.
5. A type violation. A bad reading of "n/a" (text) is published. It is not a number, so it fails type validation and is rejected outright; nothing is stored and no alert fires. It appears on the Violations feed as a type violation, with the action rejected.
The Violations feed keeps one row per topic and property, showing the most recent violation, so after step 5 the topic's row reads as the type violation. The 130 °C reading stays visible in the topic's history, marked with bad quality.
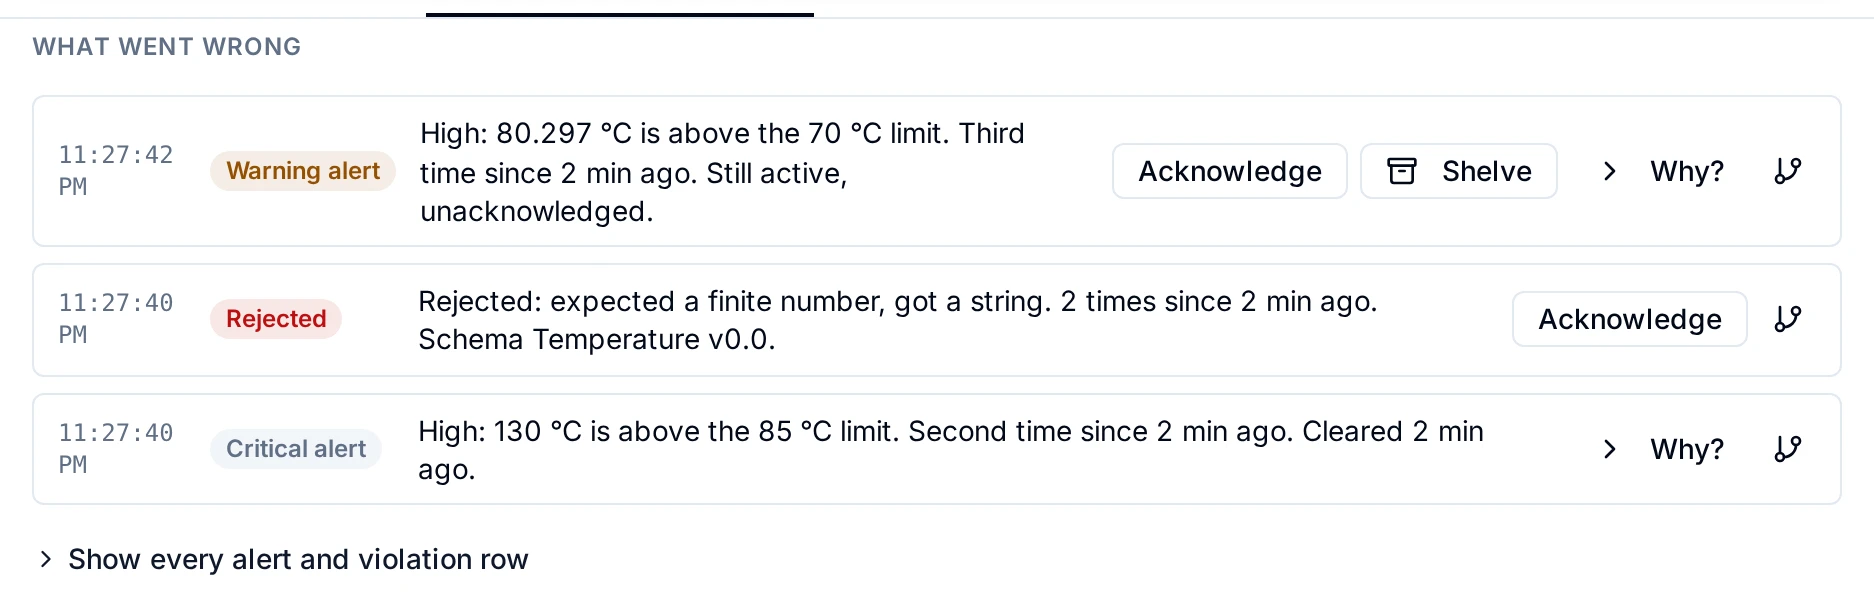
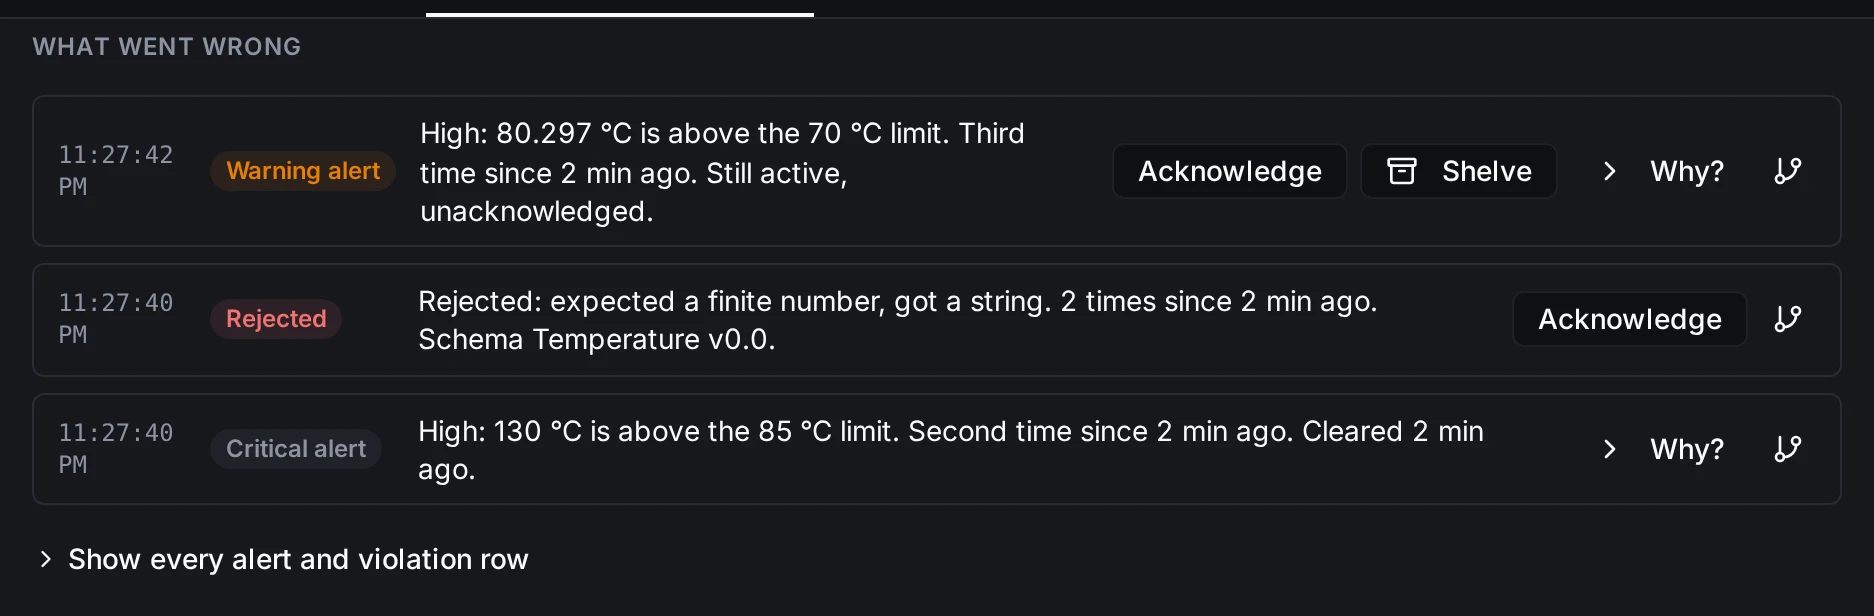
The rejected text reading, the critical alert at 130 °C (cleared earlier) and the warning above 70 °C, still active
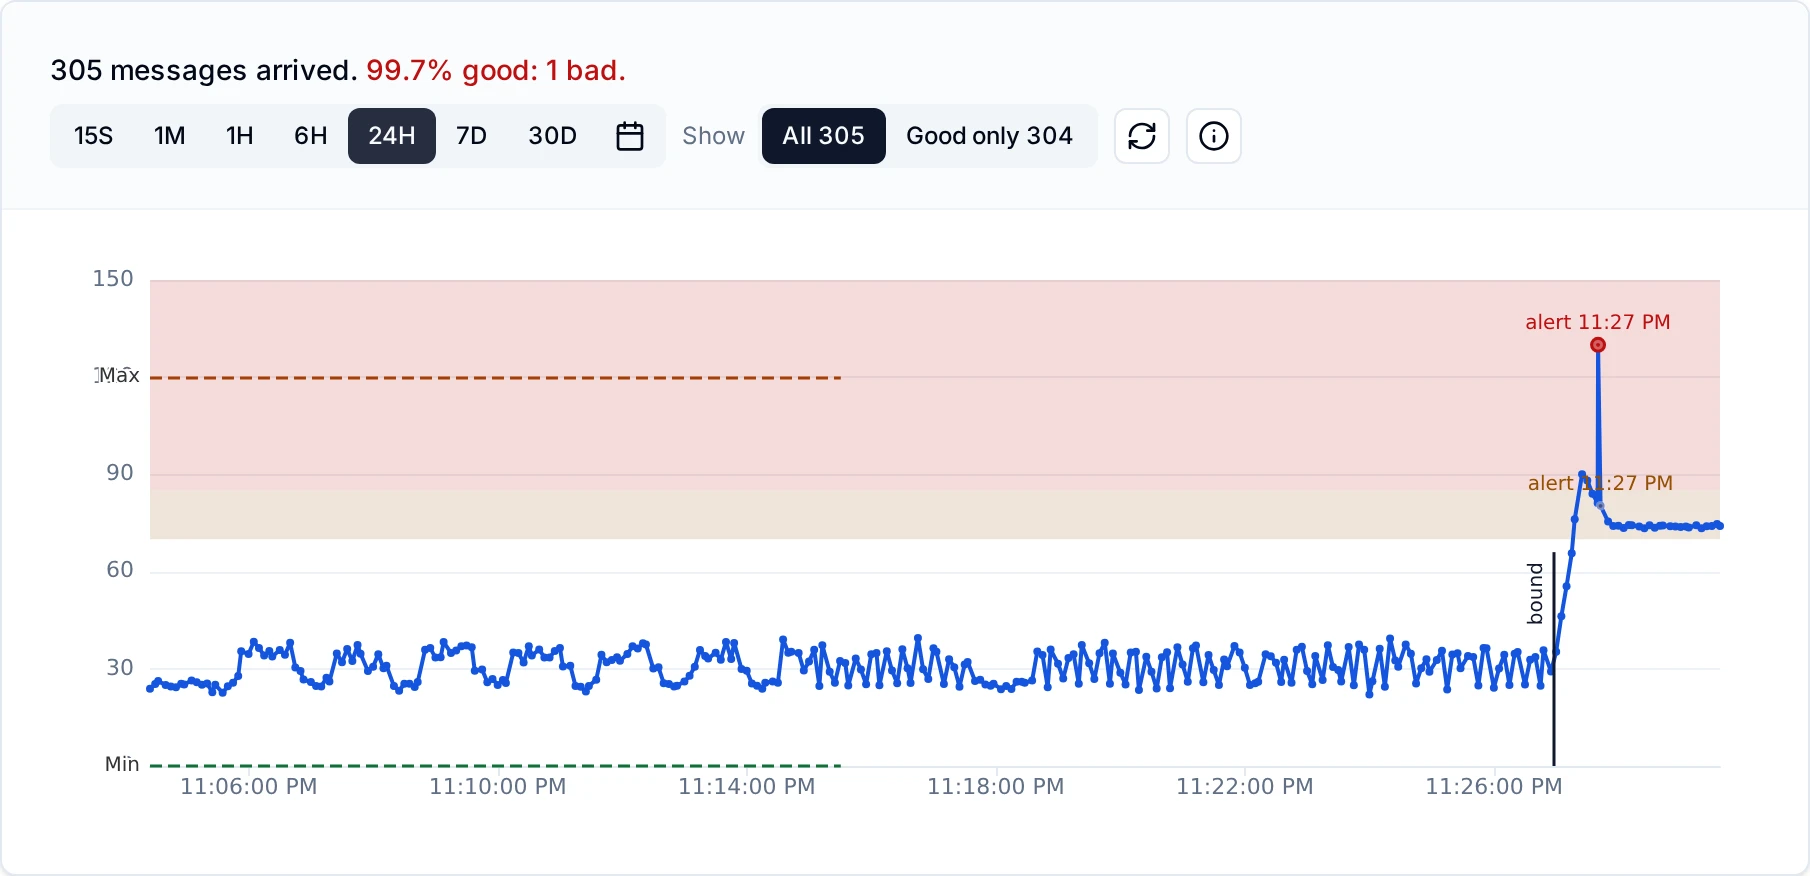
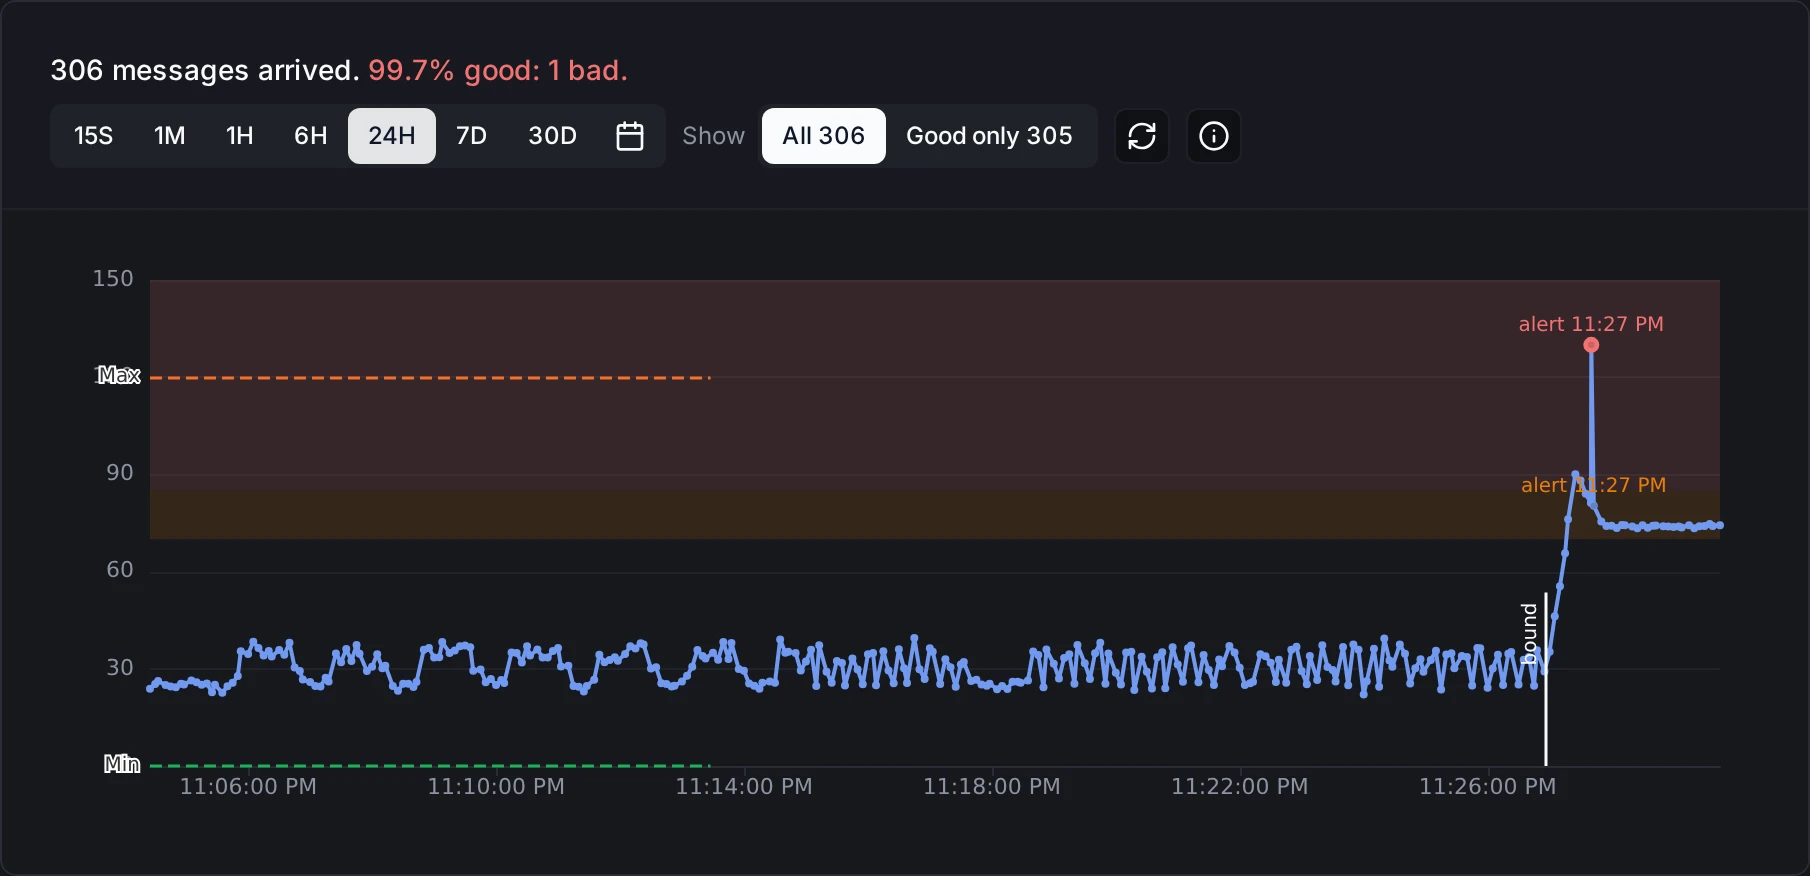
The 130 °C reading above the 120 °C range limit, stored and counted as bad quality


A string where a number was expected, rejected
Common questions
Why did 92 °C raise an alert but no violation?
Because 92 is a valid value: the right type, and inside the property's range (0 to 120). Violations are about the data being broken; 92 is fine data that happens to be operationally high. The range is a hard bound (outside → violation); warn/critical are soft bounds inside the range (crossed → alert). 92 stayed inside the range but crossed the threshold, so: alert, no violation. A reading of 130 does both; see step 4.
Why is the alert in the history but not in the Active list? Because it cleared. The Active list shows only alerts that are not cleared, not acknowledged and not shelved. When the value returned to normal (by the deadband margin), the alert cleared automatically and dropped out of Active, but it stays in the history with its full fire/clear trail. Clearing is automatic (the condition resolved) and is not the same as acknowledging.
What does the Ack button do?
Acknowledging marks the row as seen: "I'm aware, I'm handling it." It removes the row from the Active list (Active = not cleared, not acknowledged and not shelved), but the row stays in the topic's alert list in Data Explorer with an ack'd badge. It does not change the underlying value or fix anything. If the same alert or violation recurs, the acknowledgement is reset and the row becomes active again; a stale ack never hides a fresh problem. Both alerts and violations can be acknowledged. Acknowledging needs alert:ack: someone who can see alerts without it finds the button disabled, with the permission it needs.
Routing alerts to external systems
Every time an alert fires or clears, MaestroHub hands it to the platform's notification service, which delivers it to the notification channels you set up under Admin → Configure → Notifications (see Notifications). Alerts are published there by the uns.alerts producer, listed as Alarms. The page requires the notification_channel:manage permission, because a channel's webhook address works like a password.
To send alerts to Slack, Microsoft Teams or your own system:
- Open Admin → Configure → Notifications and click Add channel.
- Pick the format: Slack, Microsoft Teams or Generic webhook. Slack and Teams receive their own message layout. A generic webhook receives a JSON
POSTwith the alert event:topicPath,attributePath,level,direction,cleared,severity,value,threshold,unit,message,firedAtand thepropertyIdof the property it came from. - Enter a Name and the webhook address.
- Under Subscribed producers, tick Alarms. If you leave every producer unticked, the channel hears every producer, alerts included.
- Set the Minimum severity: Info and above, Warning and above (the default) or Critical only. A cleared alert is routed with the severity of the alert it clears.
- Optionally set Escalate after (minutes). When a critical alert is still active, unacknowledged, not shelved and not out of service after that time, the channel receives a reminder for that incident. Repeat every sends it again at that interval until the alert is acknowledged or clears.
0turns reminders off. Use one channel per escalation tier, each with a longer window. - Optionally set Throttle (seconds). The channel holds any notification that comes within that many seconds of its previous one and sends the held ones when the gap ends, each at its latest state. A critical alert is held only when it repeats an alarm already heard in the gap, and then for at most a minute; escalation reminders are never throttled. A held notification whose alert was shelved or taken out of service meanwhile is not sent.
- Click Create channel.
The Recent deliveries list on the same page shows every send attempt and its result. Failed sends are retried automatically for up to 6 hours; one that gave up can be sent again with Retry, unless its alert is shelved or out of service now.
Some transitions are recorded on the Alerts page but never sent to channels:
- A transition caused by a late value: a reading older than the late threshold when it arrived, for example a gateway replaying its buffer after an outage.
- A transition on an entity whose operating mode says it is not running (for example in maintenance). The alert row shows the mode instead of a state, and the alert is not escalated either.
Alerts also appear in the personal notification feed (the bell) of everyone whose roles grant alert:ack.
Restart behaviour
The deadband state between publishes is held in memory. If the backend restarts, an alert that is still past its threshold may re-fire once on the next publish, since the prior state is rebuilt from scratch. The durable event stream never loses the underlying fire/clear history, so the Alerts page and its history remain complete.
Alerts and violations close the loop opened by Libraries and meanings: the property declares what a value is and its limits, validation catches breaks at publish time, and this page is where operators see, and act on, what crossed the line.