Data Explorer
Watch a topic live, chart its history, see what went wrong with it and trace where a value came from, all on one page.
- Live values
- Up to 20 topics
- Lineage depth
- Up to 10 hops back
- Deleted topics
- Restorable for 7 days
- Batch actions
- Up to 50 topics
Data Explorer is where real-time and historical UNS data come together in a single workspace. Subscribe to any topic in the hierarchy, watch values flow in on a live chart, then switch to a historical view to analyse trends over hours or days, all without leaving the page.
Why Data Explorer? Real-time data only creates value when it is observed. This screen listens to UNS topics, charts their behaviour, and preserves history so teams can act on facts instead of assumptions.
Workspace Overview
When you open Data Explorer you see the Topic Explorer tree on the left and the Live values list on the right. Above both, a strip says what is wrong across the plant in one sentence: "23 signals are not arriving. 22 of them share one cause, press-shop-plc-02 down, since 12:41; 1 with no cause known yet. 1 value is frozen, 1 topic is rejecting messages, 2 topics store messages with violations." A topic is rejecting only when its publishes are refused (a type violation, or a branch whose validation rule is enforce) and the data is not stored; a topic whose messages broke their meaning's rules but were stored with degraded quality is said to store messages with violations. Click a topic in the Live values list and its detail panel opens in place of the list as one scrolling page, titled with the topic's name (its ancestry above it as clickable segments, the version and workspace prefix folded away), while the tree marks that row and scrolls it into view and the breadcrumb ends with the topic: a briefing at the top, then four sections (Now, the selected window (Last hour by default), What went wrong, and Where it comes from) reached from the section bar beneath the briefing. Every section is on the page from the moment it opens; the bar only scrolls, and everything long (the live stream, the records table, the full alert and violation history) is folded behind one line rather than hidden behind a tab.
The briefing
The briefing is what the system would say about the signal if it could talk: "Silent for 12 min, and it was outside its limits when it stopped. Normally every 10 s; the last value arrived at 12:41:52. press-shop-plc-02 down. 21 other signals on the same connection stopped too. One alert is active: critical high at 84.2 °C against a limit of 80 °C…" Every sentence is composed from facts the platform already holds: the freshness verdict on the topic, the workspace's stopped-signal summary, the topic's alerts and violations, the upstream trace and Dependencies. Every underlined phrase opens the surface it names: the connection's health tab, the pipeline in the dependency graph, a section further down the page, or the sibling signals in the live list. Nothing in it is generated, and unknowns stay unknown: No cause found yet is a finding, not a gap.
When a topic stops, the briefing looks upstream before it blames the device. A connection that is failing is named with its error: connection "press-shop-plc-02" is failing: connection refused. An enabled pipeline whose runs keep failing is named too: pipeline "Press shop" is failing: its last 7 runs failed; when its connection is down as well, the connection is named. A paused connection or a disabled pipeline is a silence someone chose, and the briefing says which. Only when the connection and the pipeline are both healthy does the briefing say the device itself has stopped reporting. A topic with a meaning is judged silent by its meaning's expected period, the same rule that reports it as not receiving data, so the briefing, the tree and the strip above agree.
Topic Explorer
The Topic Explorer presents the UNS hierarchy as a searchable tree. Expand from enterprise level down through site, area, line, and equipment nodes to find the exact tag you need. Double-click a topic (or focus it and press Enter, or drag it to the right) to add it to the Live values list. While a topic's detail panel is open, double-clicking another topic switches the detail panel to it instead.
Branch rows carry a rollup chip: 22 silent +2, worst state first, the rest as a count, the full breakdown (22 silent · 1 late · 1 rejecting · 2 violating) in its tooltip (rejecting = publishes refused, violating = stored with violations), counting what is wrong inside the branch, so a folder full of stopped signals stops looking like a folder. Healthy branches stay quiet. The chip counts the topics that are loaded; a branch that is only partly loaded says so in its tooltip.
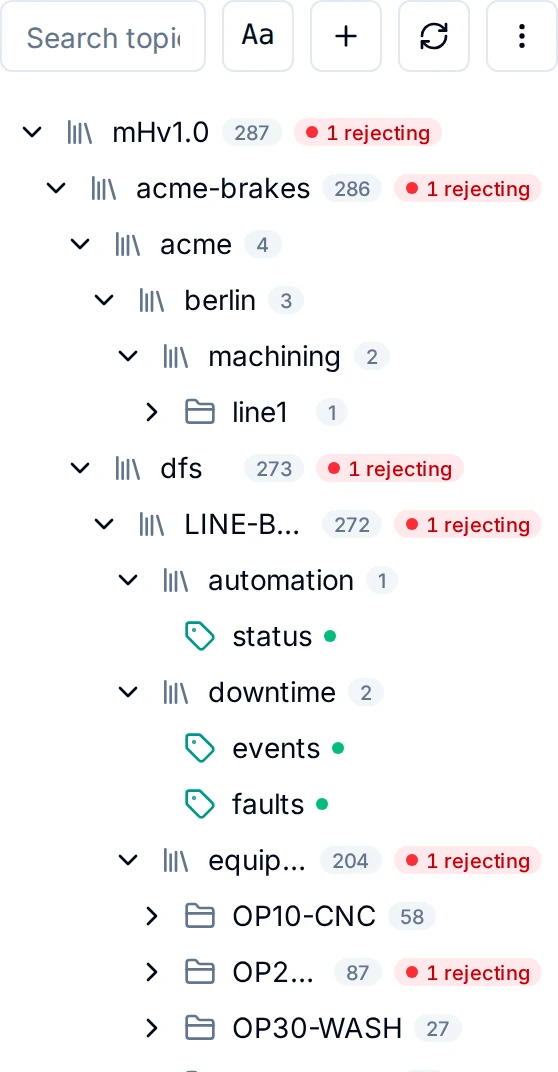
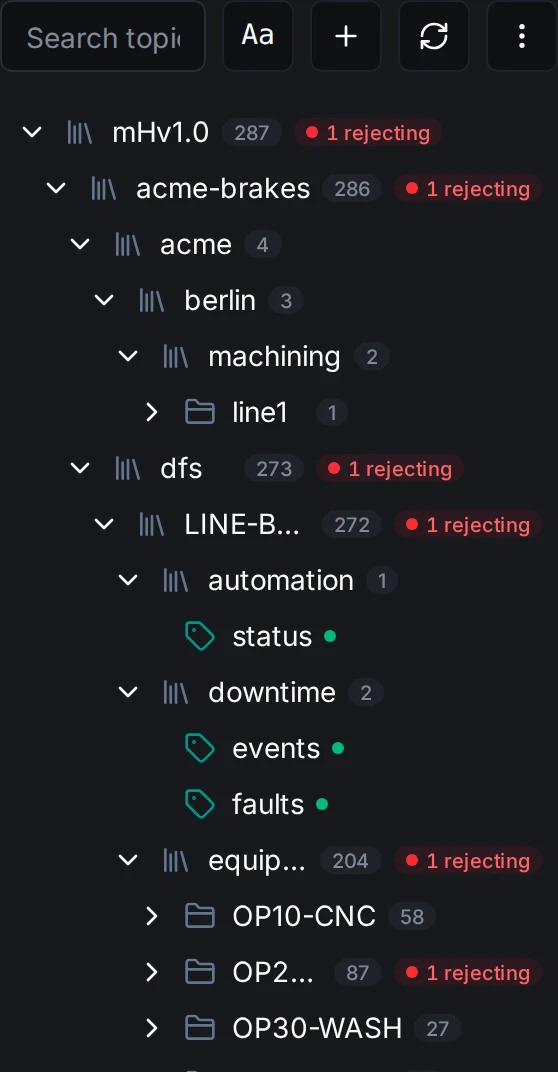
Searchable UNS hierarchy with plant, line, and equipment levels.
Live values
The Live values list on the right is a watch list: each row streams one topic's current value. Add topics by double-clicking them in the tree, by dragging them onto the list, or by selecting several in the tree and clicking Live values in the selection bar. The counter in the header shows how many topics are in the list; it holds at most 20. When the list is full, adding a topic from the tree drops the oldest row, while adding a selection adds only what fits and says how many did not.
Each row shows:
- The topic's name and path, a freshness dot, a red dot when the topic has unresolved violations in the last hour, and an amber dot when it has active alerts.
- A small trend line and how long ago the last update arrived. Before the first live message, the row shows the age of the last stored value instead.
- The value itself. For a JSON payload, click a key to zoom into it; the path next to the topic name then shows where you are, and clicking a part of it zooms back out. The row notes which fields changed and how long ago; for a single value it also shows the previous value.
- When the server refuses the live subscription for that topic, a Denied or Unavailable label with the reason and what to do about it.
Hover a row for its actions: Details opens the topic's detail panel (clicking the row does the same), Duplicate row adds a second row for the same topic so each can focus on a different field, and Remove from watch list drops the row. The header shows whether the stream is Streaming, Connecting…, Disconnected or Paused, with Pause / Resume and Clear all. Once the list has more than one row, you can filter it by name and sort it by topic name or by status (rows with issues first).


Live values with four topics and their sparklines
Topic Settings
Right-click any node in the Topic Explorer to open its context menu:
- Select: start selecting topics for a batch action (see Working with several topics).
- Add Child: create a new child node under the selected topic by entering a name.
- Rename: change the name of the selected topic node.
- Configure…: set the topic's retain and history settings (see Topic Configuration).
- Give this topic a meaning…: say what the topic's values are, with their unit, rules and alert limits (see Giving a topic a meaning). Shown with the Semantic Layer licence feature.
- Validation rule…: what happens to a value on this branch that breaks its meaning's rules (see Libraries › Validation rules on the topic tree).
- View Dependencies: open the topic in the Dependencies graph.
- Delete: remove the topic (and, with cascade, its children) from the hierarchy. The topic is restorable, with its history, for seven days; after that, or at once with Also delete its history permanently, the history is purged for good. The broker's retained message for the topic is cleared on delete, so a client subscribing afterwards is not served the deleted topic's last value.
The menu also carries the topic's access actions.
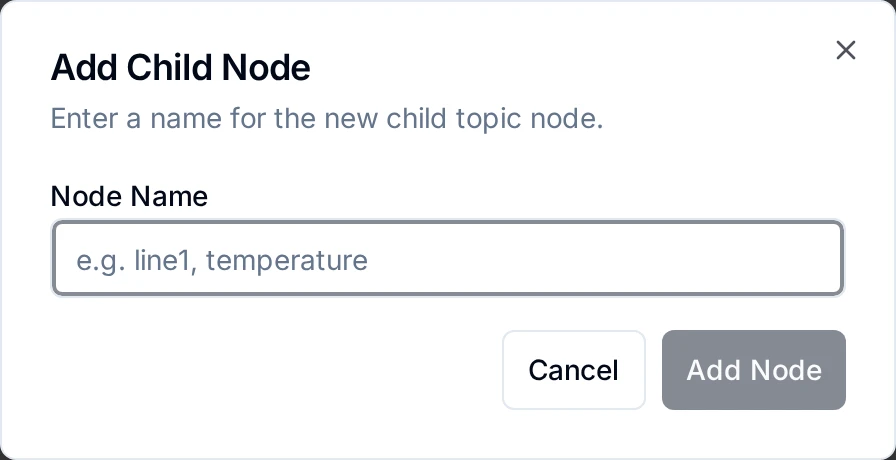
Add a new child node under the selected topic.
The topic's meaning
What a topic carries is its meaning: the property its values are, from a library. The meaning is the single place a topic's type, unit, range and alert limits are declared: it converts and validates every publish, draws the limit bands and lines on the chart, and feeds the search index. To describe or enforce what a topic carries, give it a meaning.
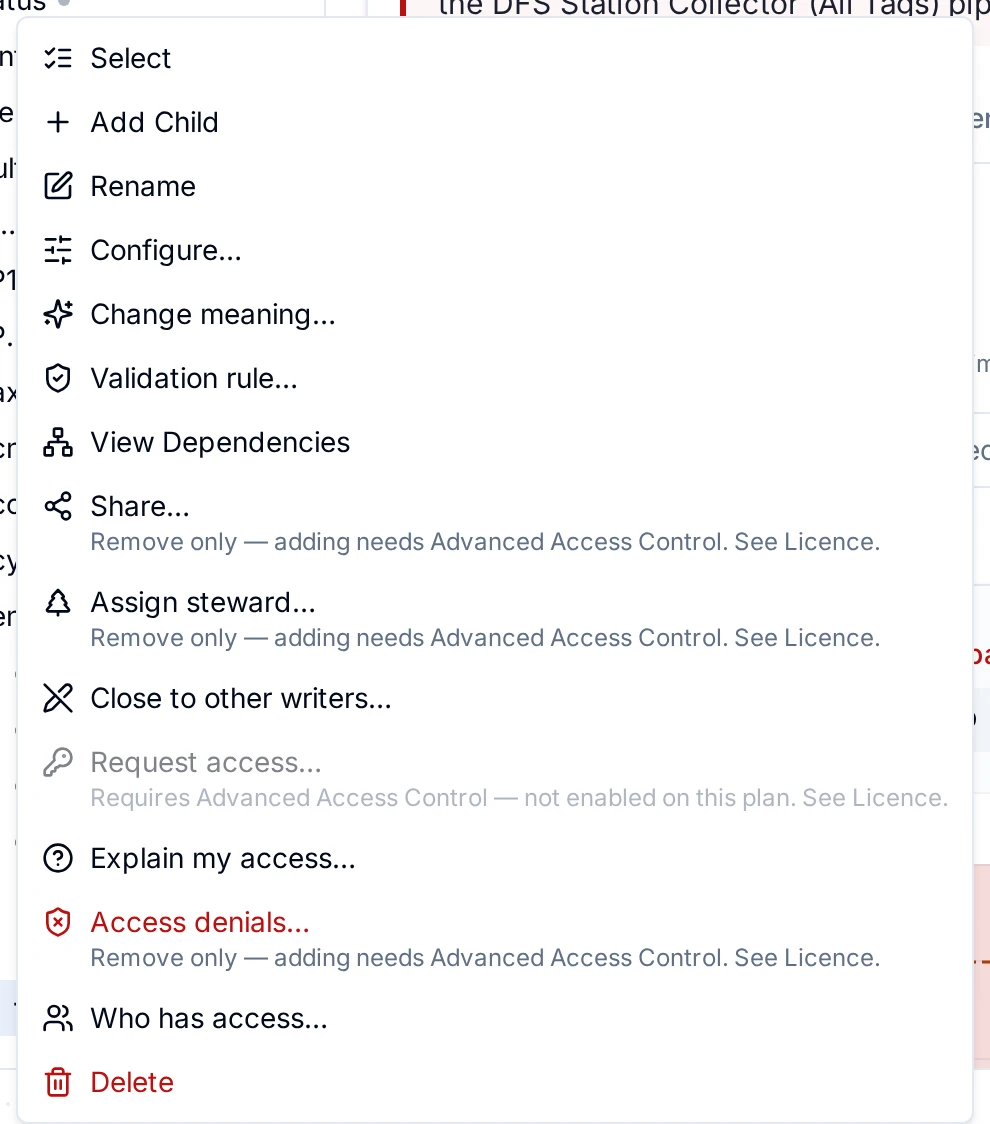
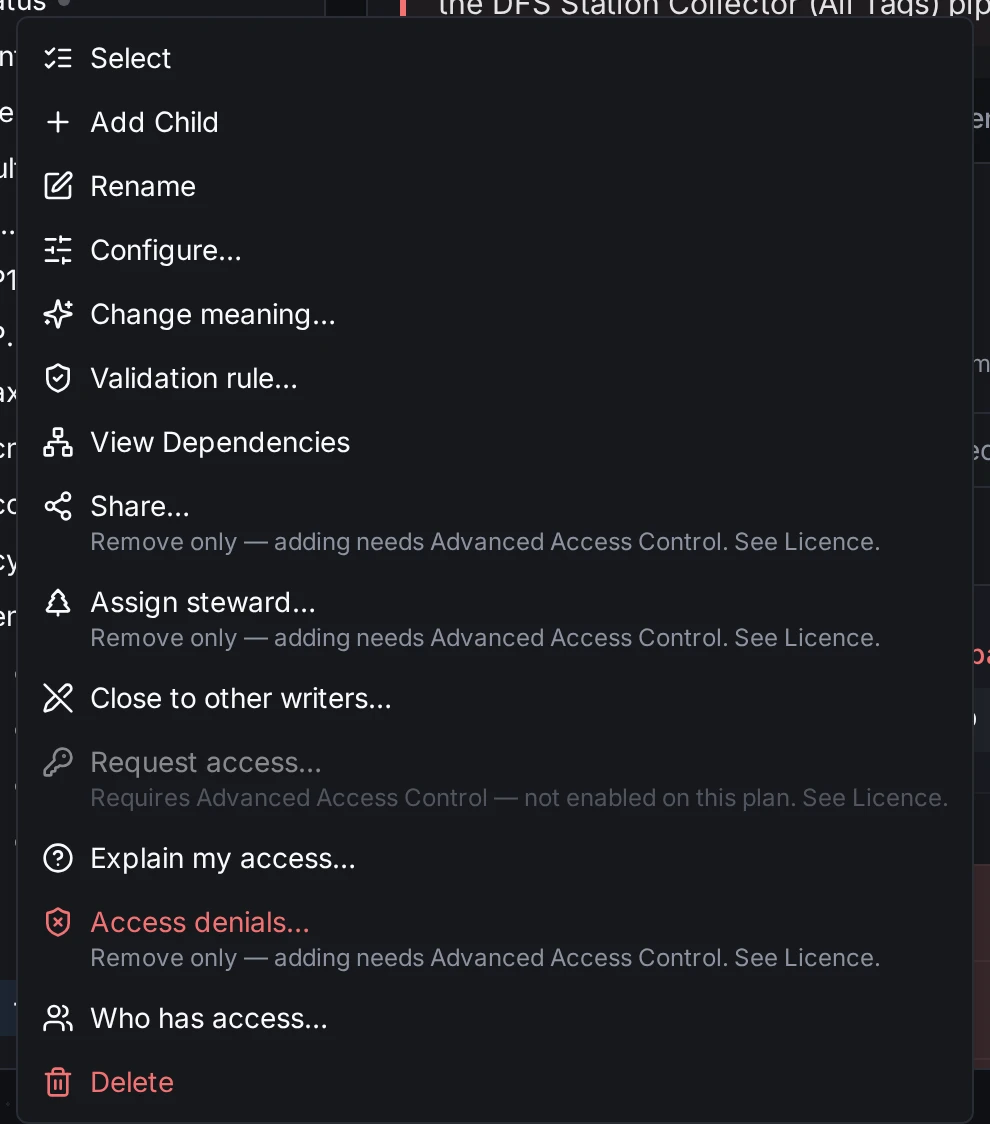
Right-click menu of a topic in the tree
The header
The detail's header is two lines. The place line carries Back and the topic's ancestry as segments (dfs › LINE-BC-01 › equipment › OP10-CNC › energy, the version and workspace prefix folded away); click a segment and the tree shows that branch. The title line carries the topic's name, a copy button for the full path, the chips that describe the topic (field count, retention, and its state when something is wrong: Rejecting · N for refused publishes, Violations · N for messages stored with violations; the meaning, with its unit, is the line under the name), and one toolbar: Dependencies and the lineage anchored at the latest value. The topic's configuration is edited from the tree (right-click → Configure…). The value, the age, the cadence and the source are not repeated here: the briefing and the Now block say them.
Topic Configuration
Right-click a topic in the Topic Explorer and choose Configure… to open the Configure topic dialog. It works on a branch as well as on a leaf: both settings are inherited down the tree, so setting a plant to 32 days sets every line under it that has no setting of its own. Nothing is saved until you click Save. Changing the configuration needs topic:update on the topic.
- Retain latest value: Inherit, On or Off. This is not about how long history is kept. When on, the topic's last value is published as an MQTT retained message, so a client that subscribes later gets it at once instead of waiting for the next publish, and the latest value stays stored after the topic's history has expired. Useful for topics that change rarely, such as set-points or configuration values.
- Keep history for: Inherit,
1 day — hot only, 7 days, 14 days or 32 days: how long the historian keeps the topic's stored values. With 1 day the data stays in the hot tier and no cold-storage files are written. What a shorter or longer setting does, and how the two historians differ (TimescaleDB keeps hourly and daily summaries longer than the readings; Pebble does not), is explained in How history retention works.
Inherit means nothing is set on this topic, so it follows the nearest branch above that sets a value, or the installation default. The line under each setting says what is in effect now and where it comes from, for example Latest value is retained, from dfs/LINE-BC-01 or 7 days (hot tier, then cold storage), installation default. If the installation's historian does not apply per-topic history, the dialog says so under Keep history for.
To change several topics at once, select them and click Configure in the selection bar (see Working with several topics). The Configure N topics dialog has the same two settings plus Keep as is, which leaves each topic's current value alone. It writes the setting on each selected topic; topics under them follow through inheritance. The result lists any topic that could not be updated.
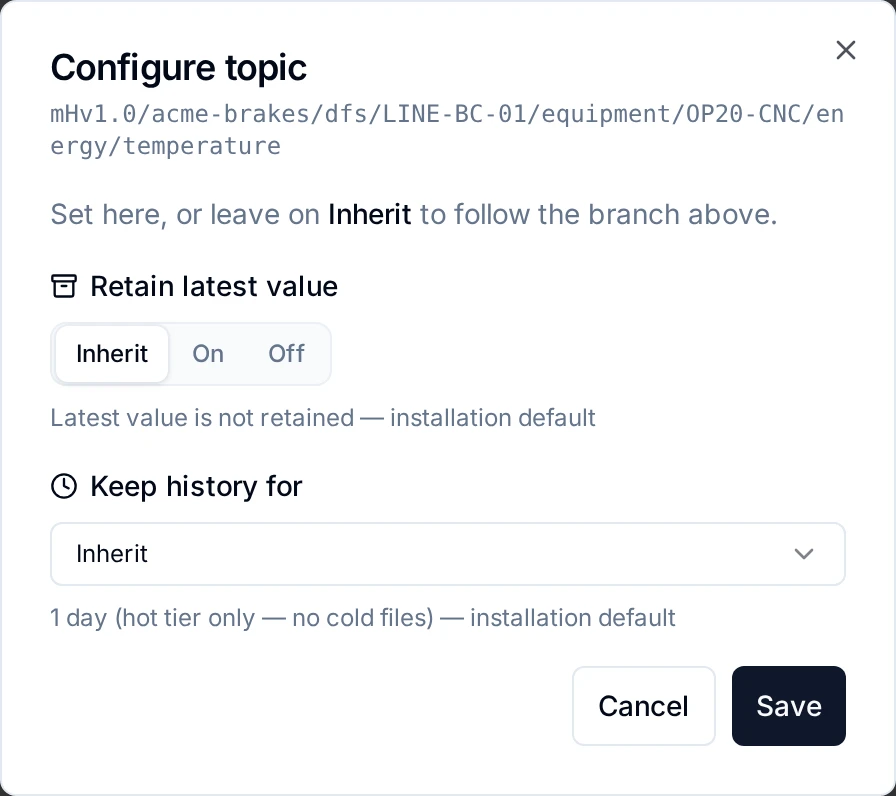
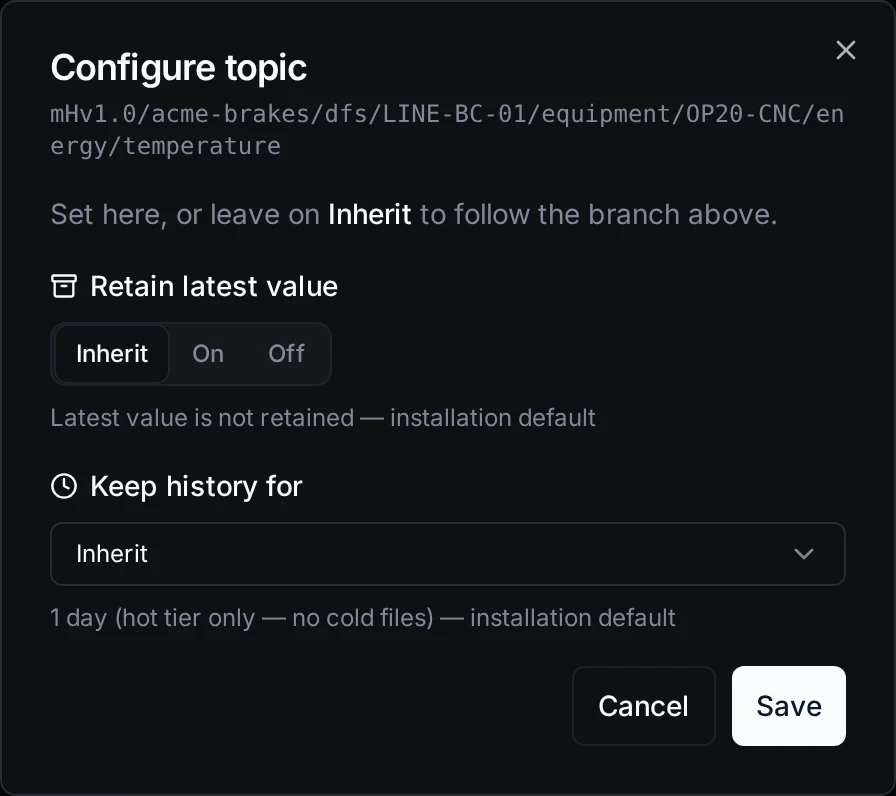
Configure topic with retain and history inherited from a parent
Working with several topics
Choose Select in a topic's context menu, or Ctrl-click (Cmd-click on macOS) a topic, to turn on selection mode. In selection mode, click topics to select them and Shift-click to select a range. Selecting a branch covers everything under it. A bar above the tree shows how many topics are selected and offers:
- Live values: add the selected topics to the Live values list.
- Configure: set retain and history on all of them (see Topic Configuration).
- Share and Stewards: grant or revoke a share, or add or remove a steward, on the selected topics you govern (see Topic access). These need Advanced Access Control, an Enterprise feature.
- Delete: delete the selected topics after a preview.
A batch acts on at most 50 topics (a selected branch counts as one). Close the bar with × or press Esc.
Topic access
The topic context menu also carries the access actions for the topic. Who sees which item:
- Share…, Assign steward…, Access denials… and Who has access… appear only for people who hold
topic:shareon the topic, for example workspace admins, and a branch's stewards on that branch. Adding a share, a steward or a denial needs Advanced Access Control, an Enterprise feature; without it Share…, Assign steward… and Access denials… open their dialogs captioned as remove only, so what exists can still be revoked, and Who has access… works as before. - Close to new topics and Close to other writers… also need
topic:shareon the topic, but no licence feature. - Request access… and Explain my access… are offered to everyone. Request access needs Advanced Access Control and is shown disabled with the reason without it; Explain my access works on every licence.
What each one does:
- Share…: grants a user, group, API client or role direct access to the topic. Pick the actions (
read,create,update,delete,share,publish,subscribe), choose This topic only or This topic + subtree, and optionally set an expiry; leave it empty for a permanent share. Shares add to role-based access, they never narrow it. The dialog lists the current shares, each with a revoke button. - Assign steward…: opens Stewards, where you add or remove the stewards of the branch. A steward has full authority over the topic and everything beneath it, including topics created under it later: they can grant and revoke access and approve access requests for the branch. Until a branch has a steward, its access requests go to an administrator. Prefer a group over a single person so stewardship survives staff changes. Branches with a steward show a shield icon in the tree.
- Access denials…: blocks a user, group, API client or role from chosen actions on the topic, or on the topic and its subtree. A denial overrides every grant, including one the owner gave. A Reason is required and is recorded on the denial and in the audit trail. An optional Condition (a CEL expression such as
request.time_of_day < 9 || request.time_of_day >= 17) makes the denial apply only while the condition holds. Use denials to hard-stop access; for routine changes, remove the share instead. - Close to new topics: on a branch, stops anyone except its stewards and admins (holders of
topic:sharethere) from creating topics under it. Existing topics keep receiving data. A closed branch shows a lock icon; the same menu item then reads Open to new topics. - Close to other writers…: sets the list of writers allowed to publish under the topic. The list starts from who is publishing there now; add others as
user:…,group:…(its members),client:…,agent:…,pipeline:…,schedule:…,webhook:…orapp:…. A role cannot be a writer. Once saved, anyone not on the list is refused, whatever else they hold, and each refusal is recorded in the audit trail. An empty list stops every publish under the topic. A topic with a writers list shows a crossed-pen icon, and the menu item reads Writers…, where Open to all writers removes the list. - Who has access…: lists every way someone reaches the topic: its owner, its stewards, direct shares, the roles that grant a chosen action (this part needs
audit_log:read), and the active denials that override them. - Request access…: asks for an action on the topic, with an optional note for the reviewer. The request goes to the nearest steward of the branch, or to an administrator when there is none.
- Explain my access…: pick an action and see whether you can perform it on the topic, and why.
Settings history
A topic keeps a version for every change to its own settings, so you can see who changed what and when. Click the Settings history button (the clock icon) in the topic header.
A version is recorded when the topic is:
- created, by hand or by the first publish to a new path,
- renamed (the version says the old path; topics under it keep their own history),
- given or cleared a writers list, or closed or opened to new topics,
- given its own retain or retention settings,
- deleted or restored.
Changes compares a version with the one before it; Body shows the settings the version stored. A setting the topic does not set itself reads inherits. Settings history is read-only: change a setting the usual way to change it again. It records the topic's settings, not the values published to it; those are in the topic's data history.
Deleted topics
To see deleted topics, open the ⋮ menu above the tree and choose Show Deleted. A deleted topic's context menu has two items:
- Restore: brings the topic back with its history. Deleted parent topics are restored with it, and you can also restore its deleted children. Restoring needs
topic:update. - Delete permanently…: deletes the topic's history for good. The topic stays deleted and can still be restored, but empty. The history is purged on the historian's next pass; a restore before then cancels the purge. You can include the history of its deleted children. This needs
topic:delete.
A deleted topic's history is kept for seven days, then purged. If it was already purged, Restore without history brings the topic back empty: its next value starts a fresh history.
Now
The Now section is where the page opens. It leads with the value as the eye wants it: the charted field's last reading, large, with its unit and one line of what it means (last value · 12:41:52 · above the 80 °C critical limit), and, beside it, the last fifteen minutes as a sparkline. A stopped signal shows the silence as width in that sparkline and says in the caption how many messages it owes: expected 72 messages since 12:41, received 0. The header carries the state as a chip (Silent · 12 min, Rejecting · 14 for refused publishes, Violations · 20 for messages stored with degraded quality) so the word is said before anything is read.
Below the block, Field Statistics lists the fields of a multi-field payload and toggles which are charted. The Live stream line folds two components, a real-time trend chart and a live messages table; open it when the evidence matters.
Line Trend
A continuously updating line chart plots every incoming value as it arrives. The chart makes it easy to spot spikes, drops, or gradual drifts at a glance.
- Time-period selector: adjust the visible time window to focus on the last few minutes or a wider range.
- Pause: freeze the chart at the current moment so you can examine a value without the display scrolling away.
Live Messages
Below the chart, a Live Messages table logs every incoming message with columns for Time, Timestamp, Value, and Source. This gives you the raw data behind the chart so you can verify exact values, check sources, and correlate events down to the millisecond.
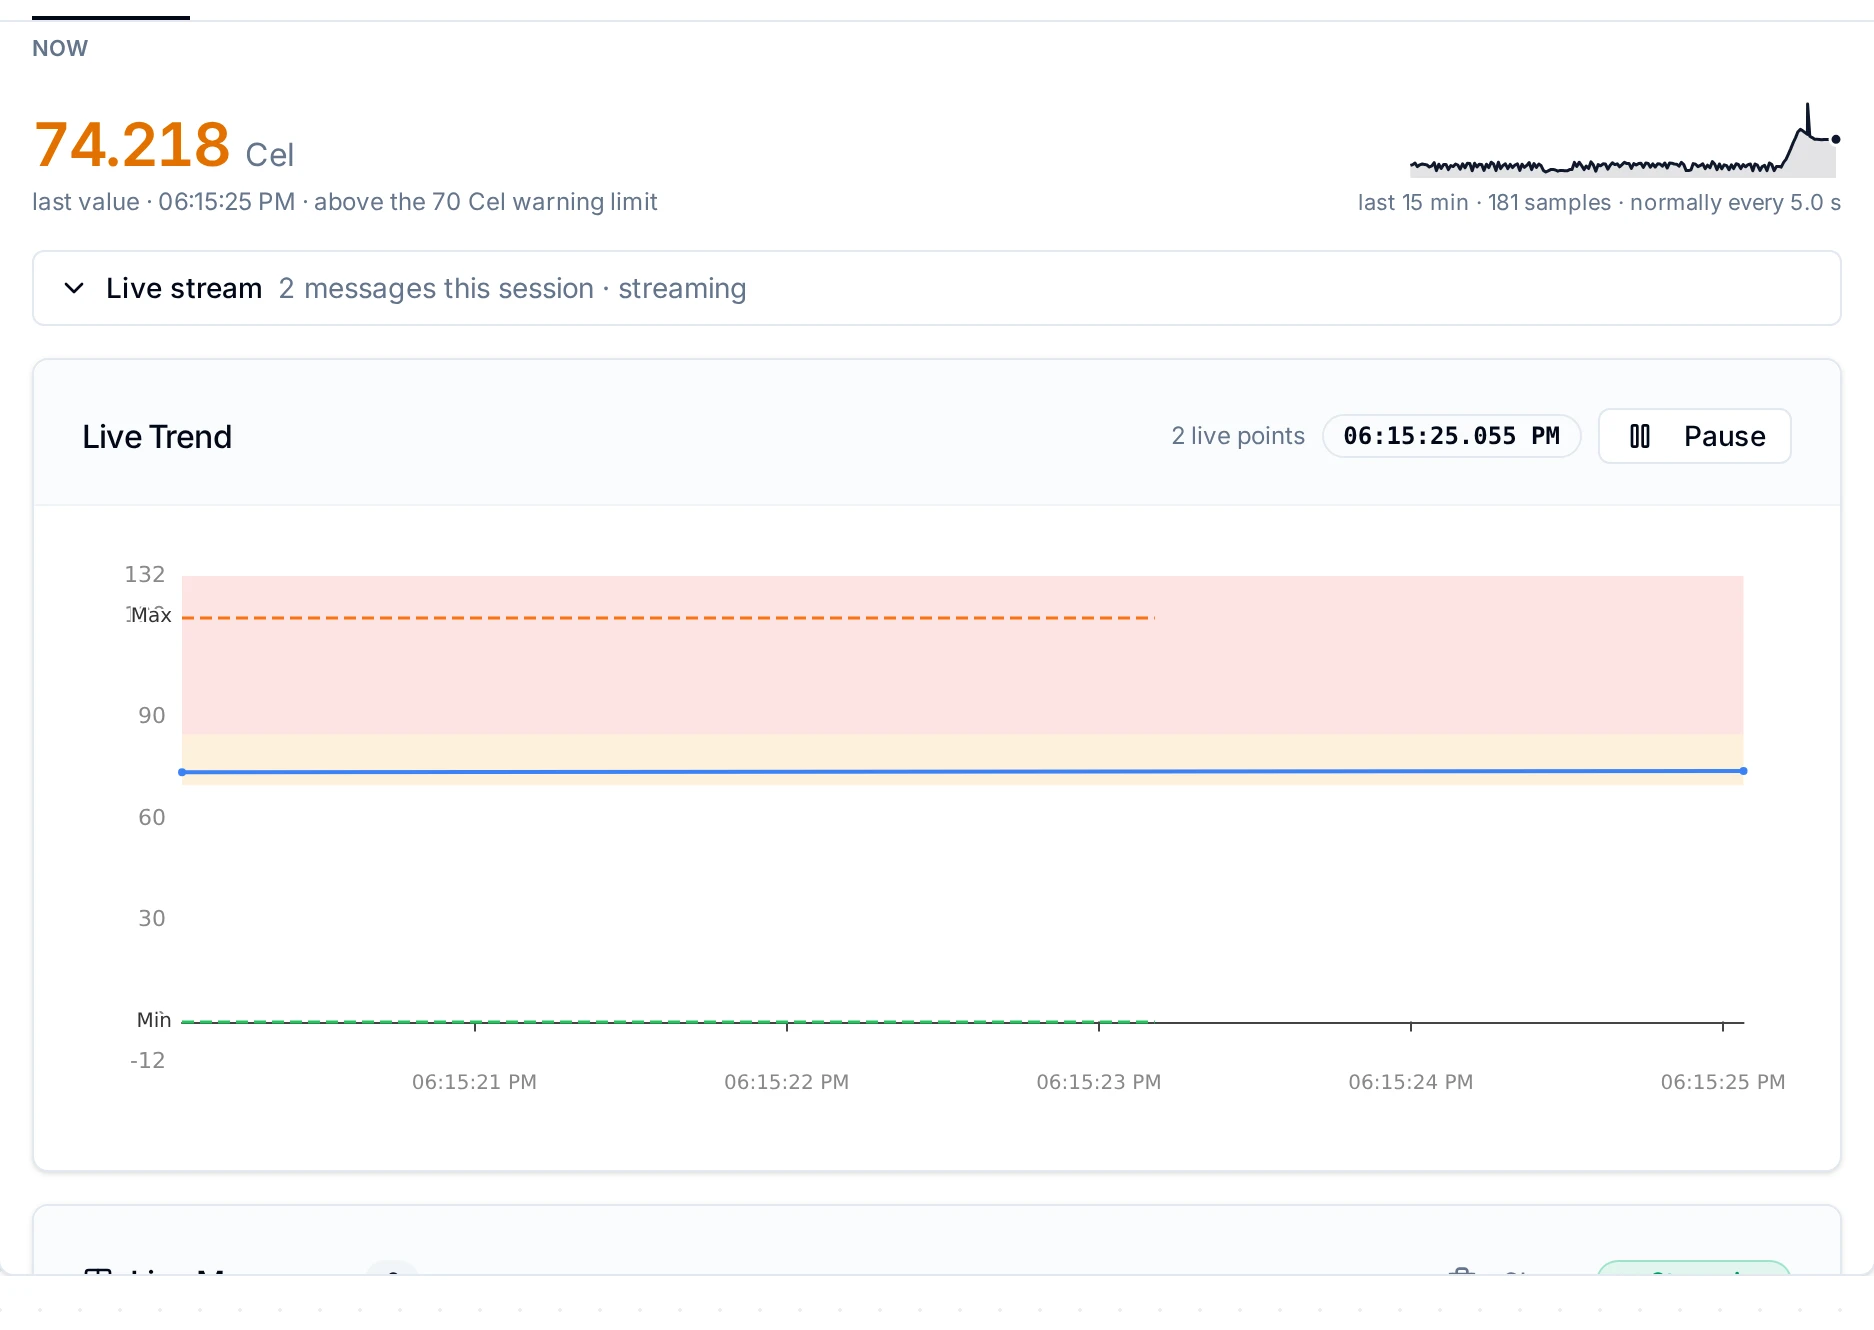
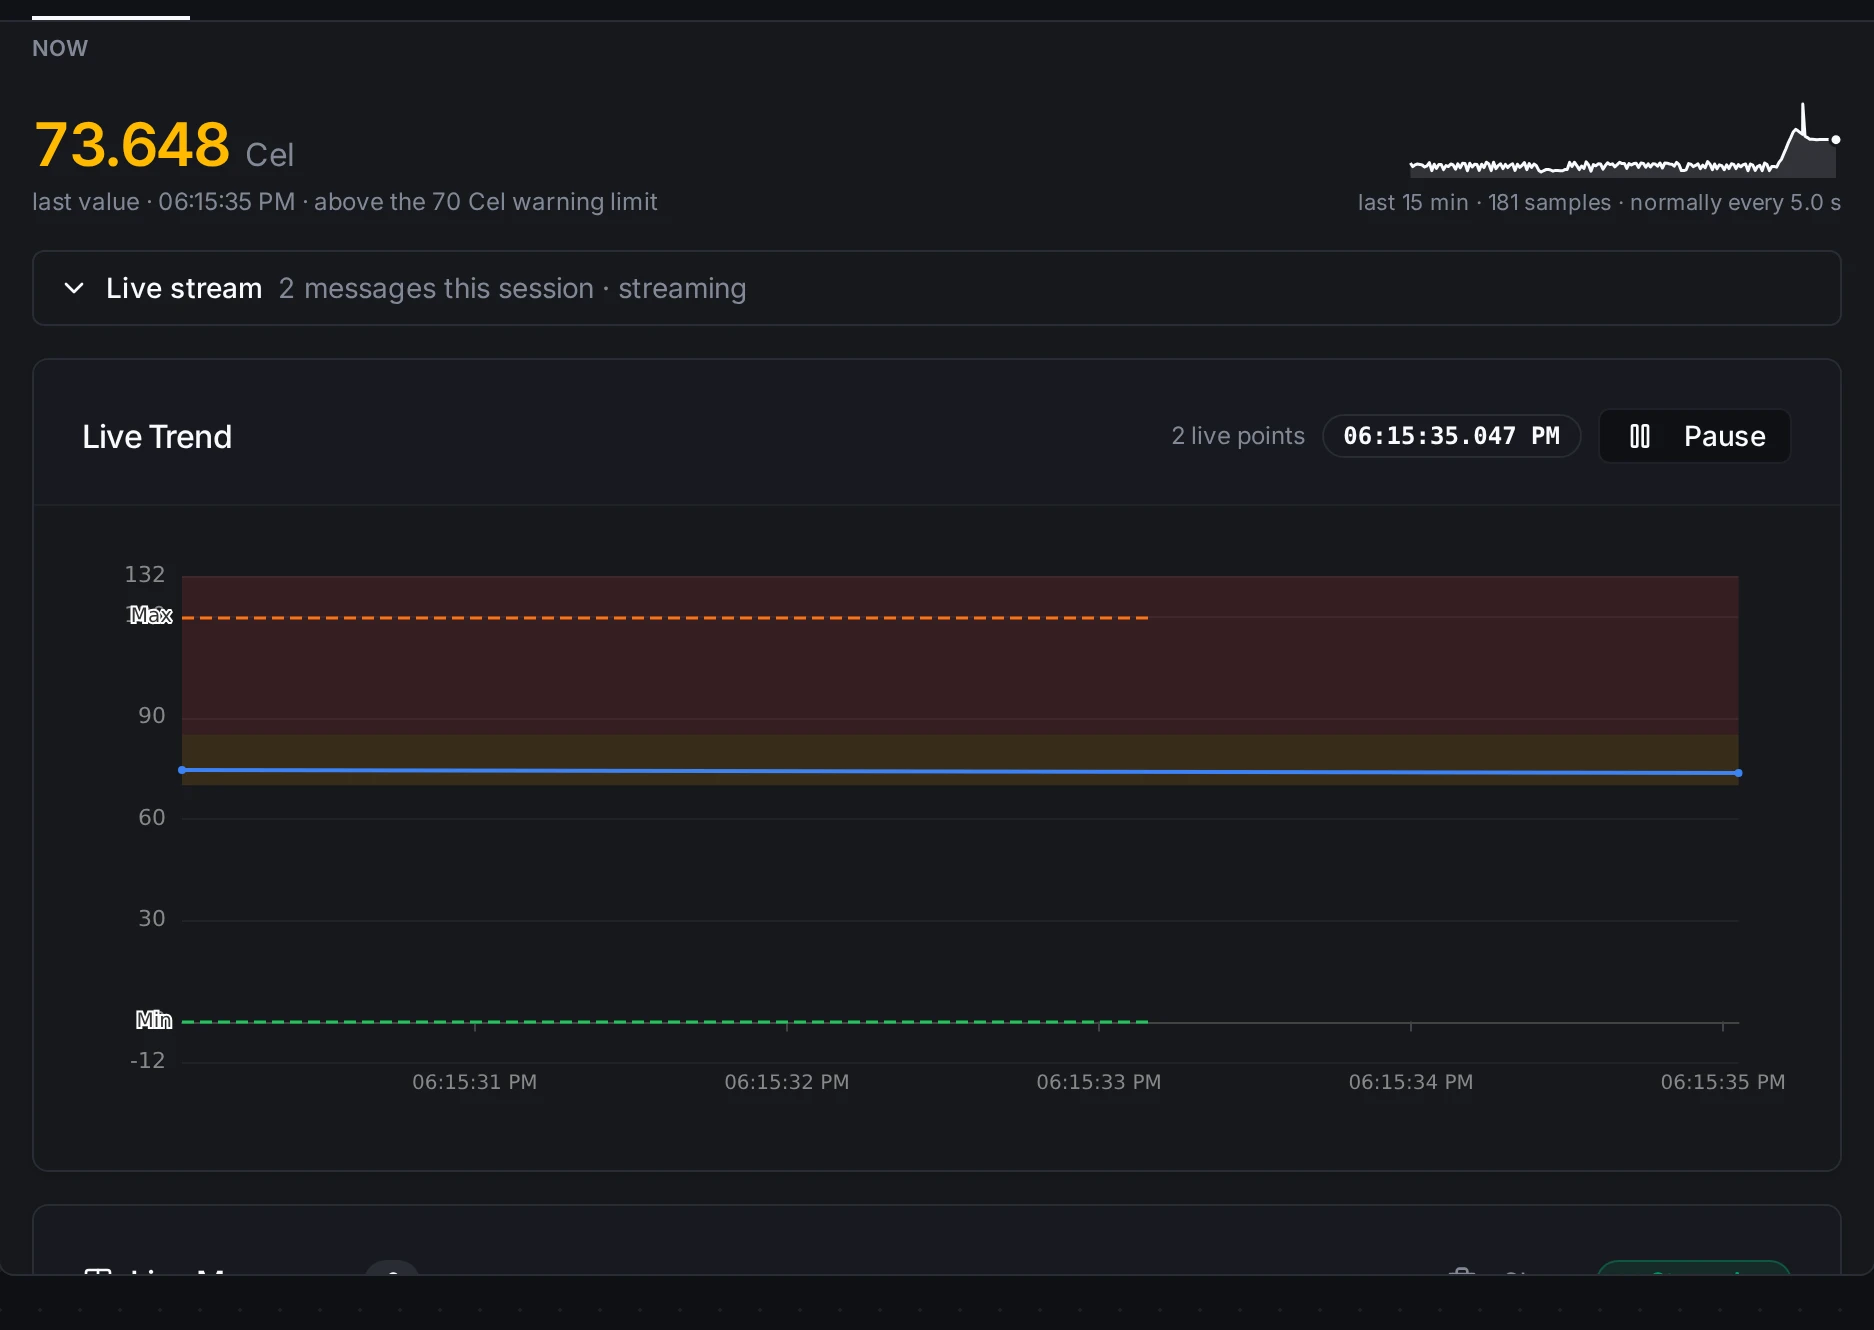
The Now section with the live stream expanded
The window
The window section, named after the range you pick (Last hour by default, Last 6 h, Last 24 h, or Selected range), analyses past data for the same topic. It opens with one sentence that replaced three badges: 355 of 360 expected messages arrived (98.6%). 99.2% good: 3 uncertain. One gap, ongoing since 12:41. The gaps phrase opens the list of silences. When the window holds uncertain or bad samples, a Show control beside the range offers All 716, Good and uncertain 713, Good only 700, each choice saying how many samples it shows (a sample's quality is the verdict the device or pipeline published with it, or the meaning's, for a value outside its range or of the wrong type or shape); the sentence then names what the choice hides. When every sample is good there is nothing to filter and no control. The trend chart beneath it draws the story the sentence tells: the meaning's limits as lines labelled Warning and Critical (Warning low and Warning high when both sides are set), on a scale that covers the data and the limits (the property's plausible range is added only when the data comes near it), every alert that fired inside the window as a marked point, past gaps as grey bands and the current silence as a red band that says how long. The records table sits under the chart behind its count line (Records · 355 in the last hour), with Export beside it.
Historical Trend
The Historical Trend chart renders all recorded values within the selected time range. Use it to identify patterns across shifts, compare days, or trace the timeline of an incident after the fact.
Time Range Selection
Choose a preset window or pick a custom range:
- 15S / 1M / 1H / 6H / 24H / 7D / 30D: quick presets from the last few seconds up to the month the historian keeps.
- Calendar picker: click the calendar icon to open a date picker and define an exact start and end date for your query.
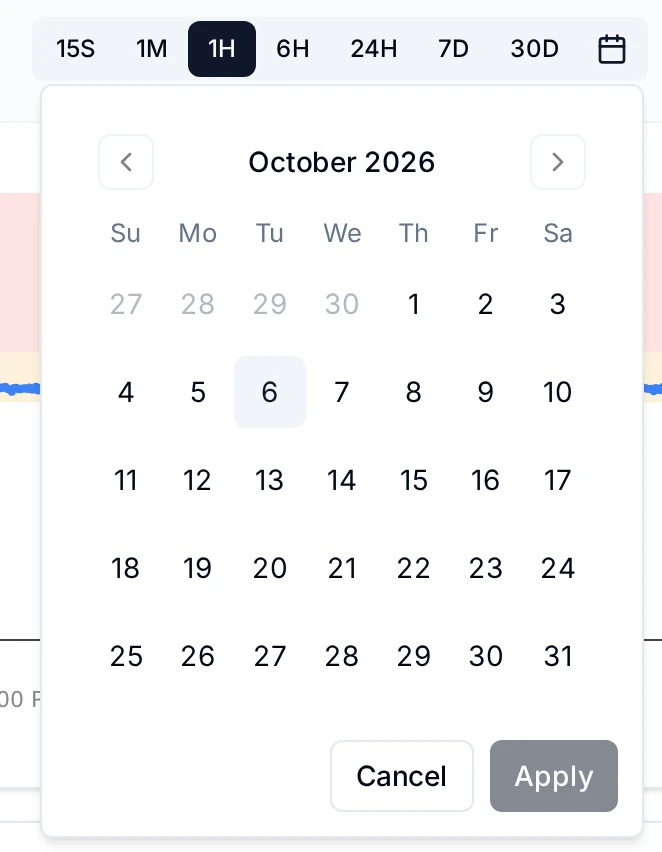
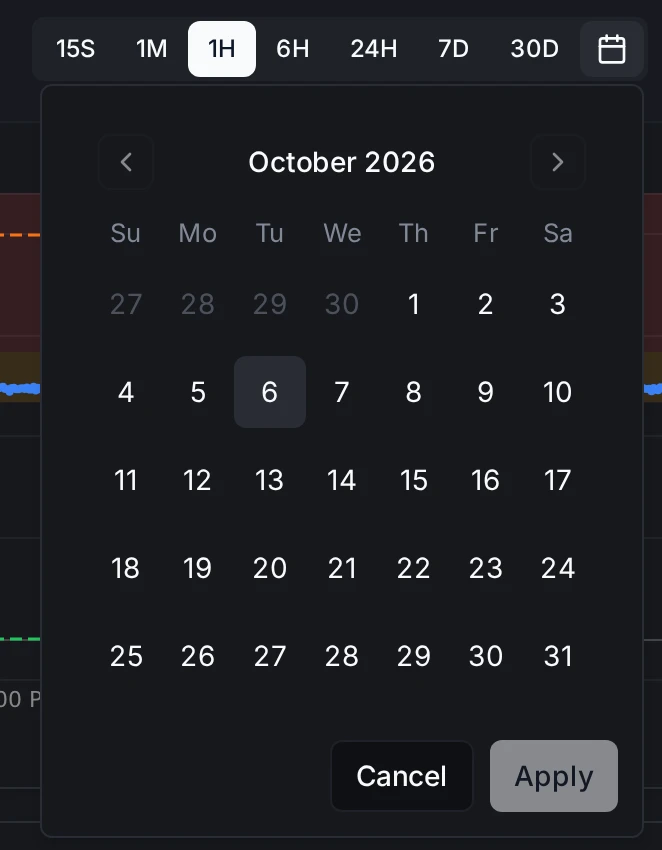
Select a preset time window or use the calendar to define a custom range.
Data Records
Below the chart, the Data Records table lists every historical message with the same columns as the live view: Time, Timestamp, Value, and Source. A record count is shown so you know exactly how many data points fall within your selected range.
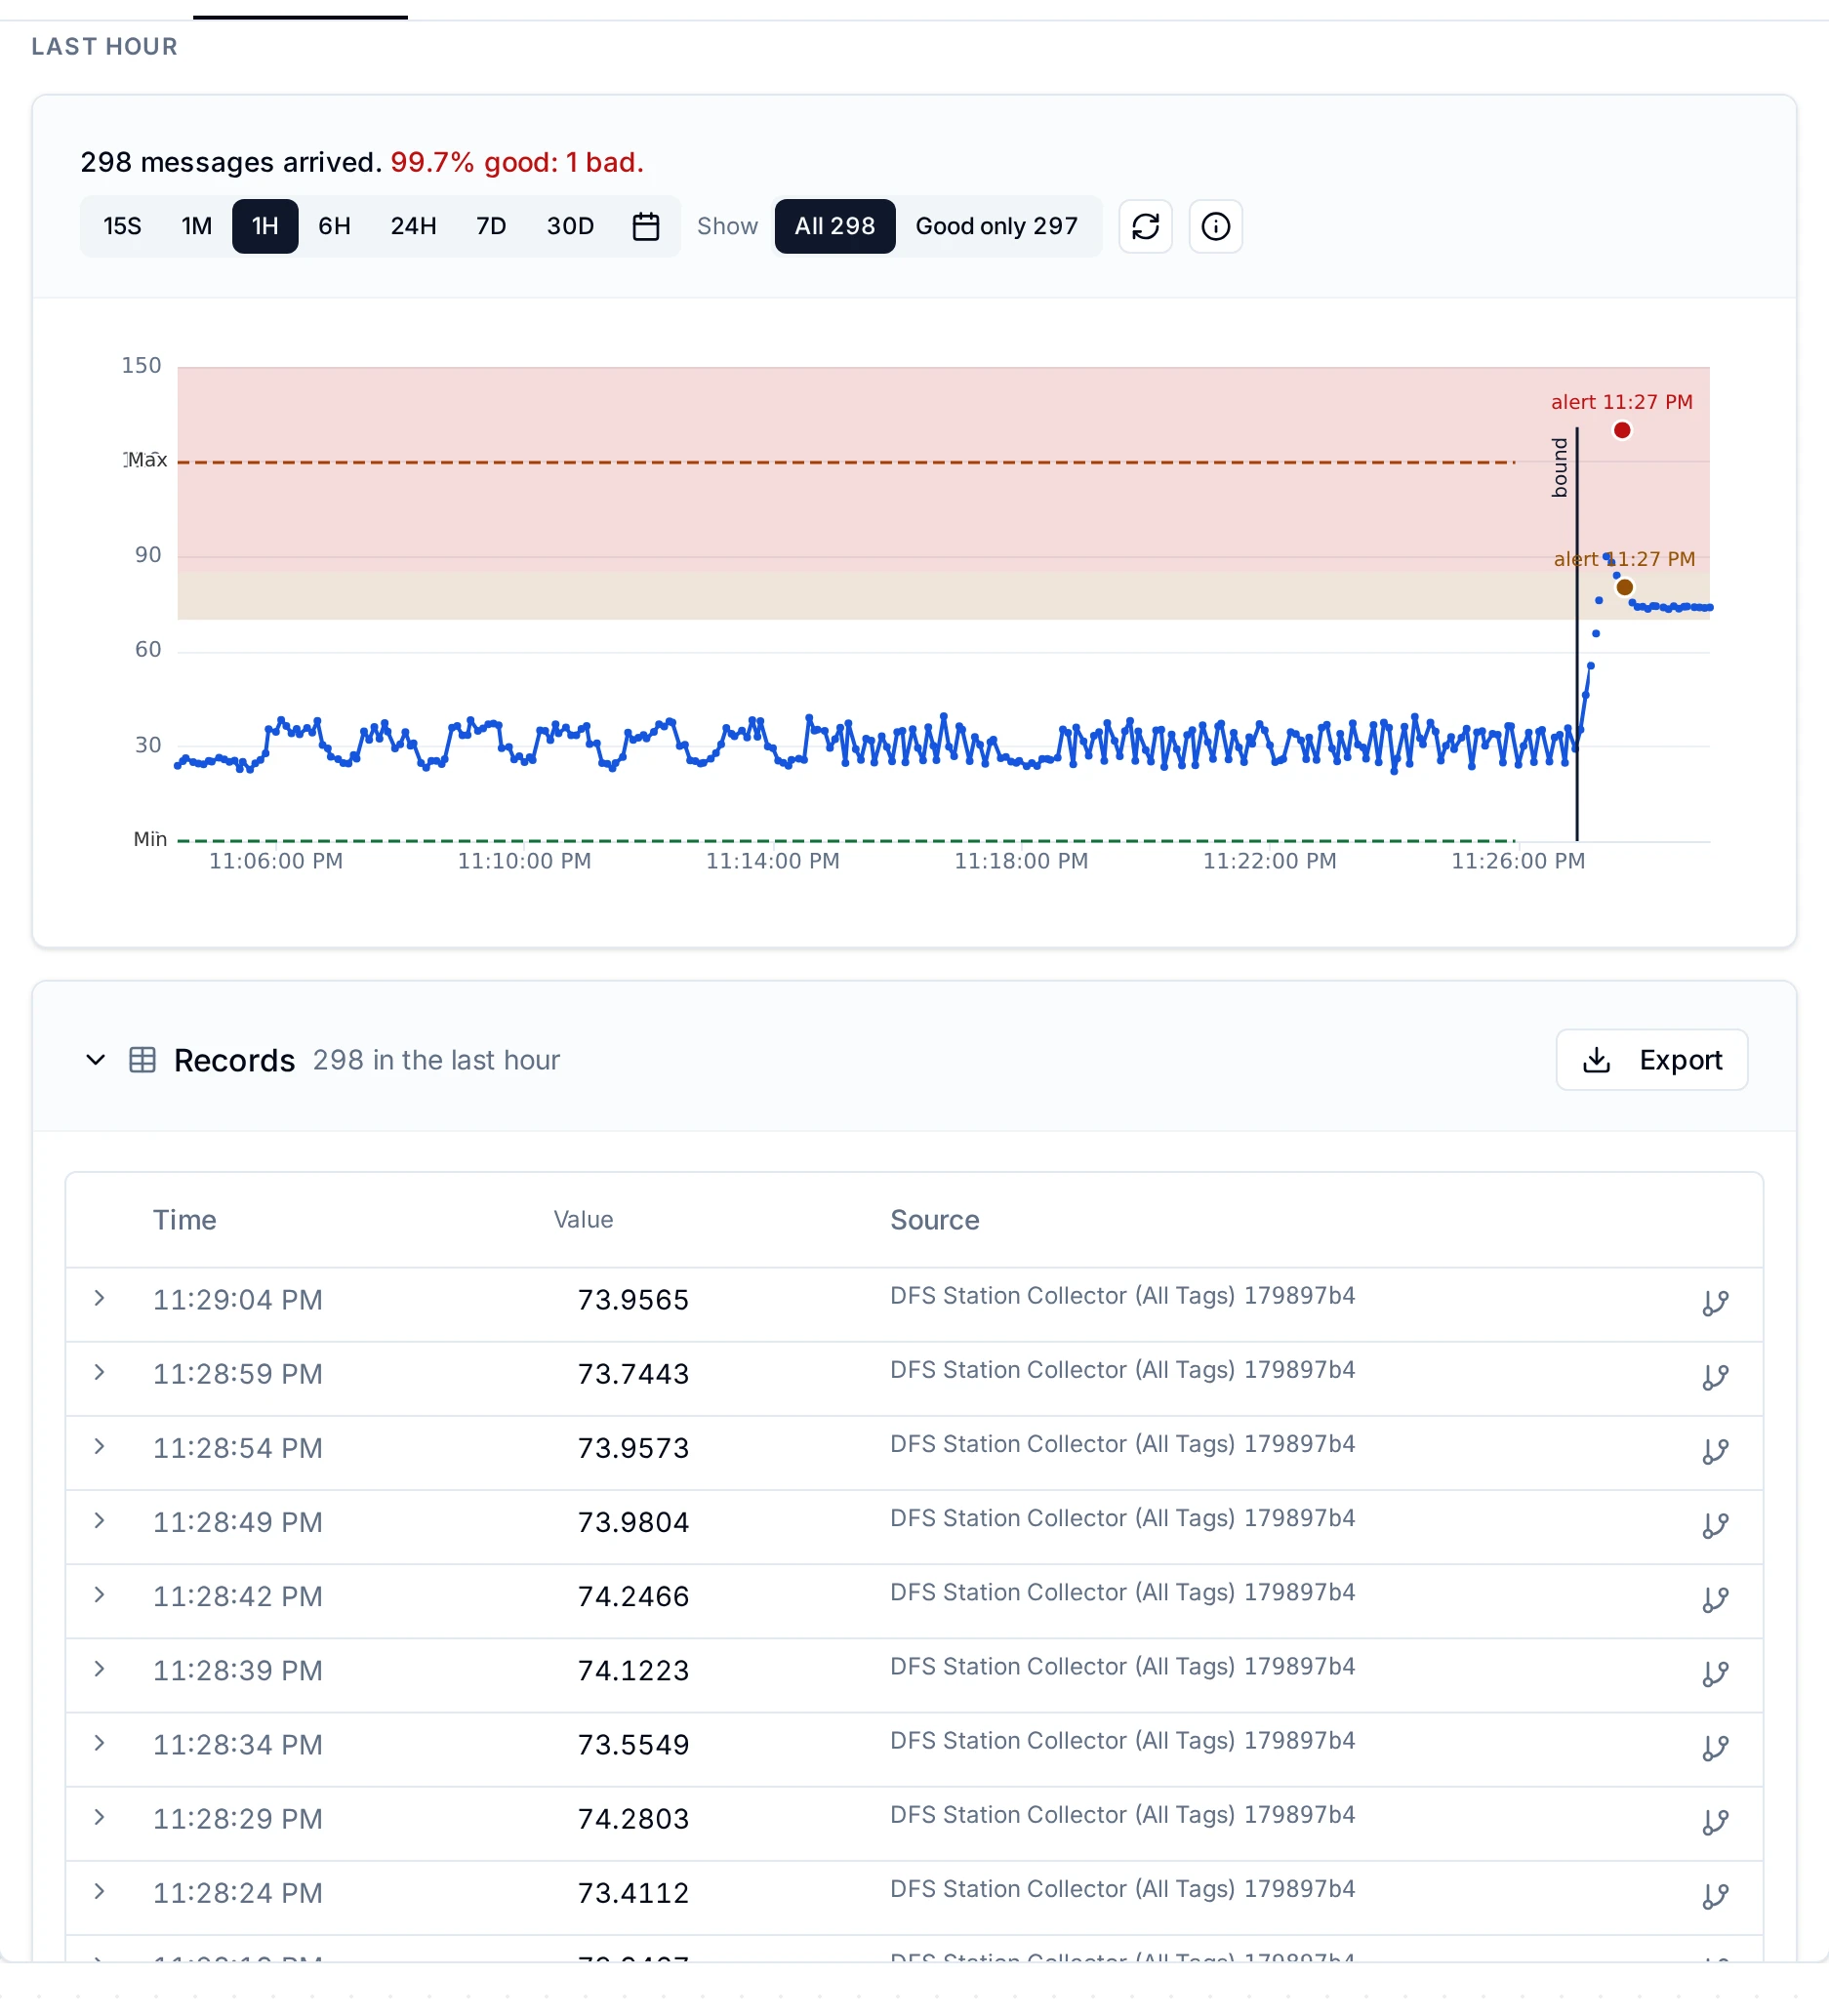
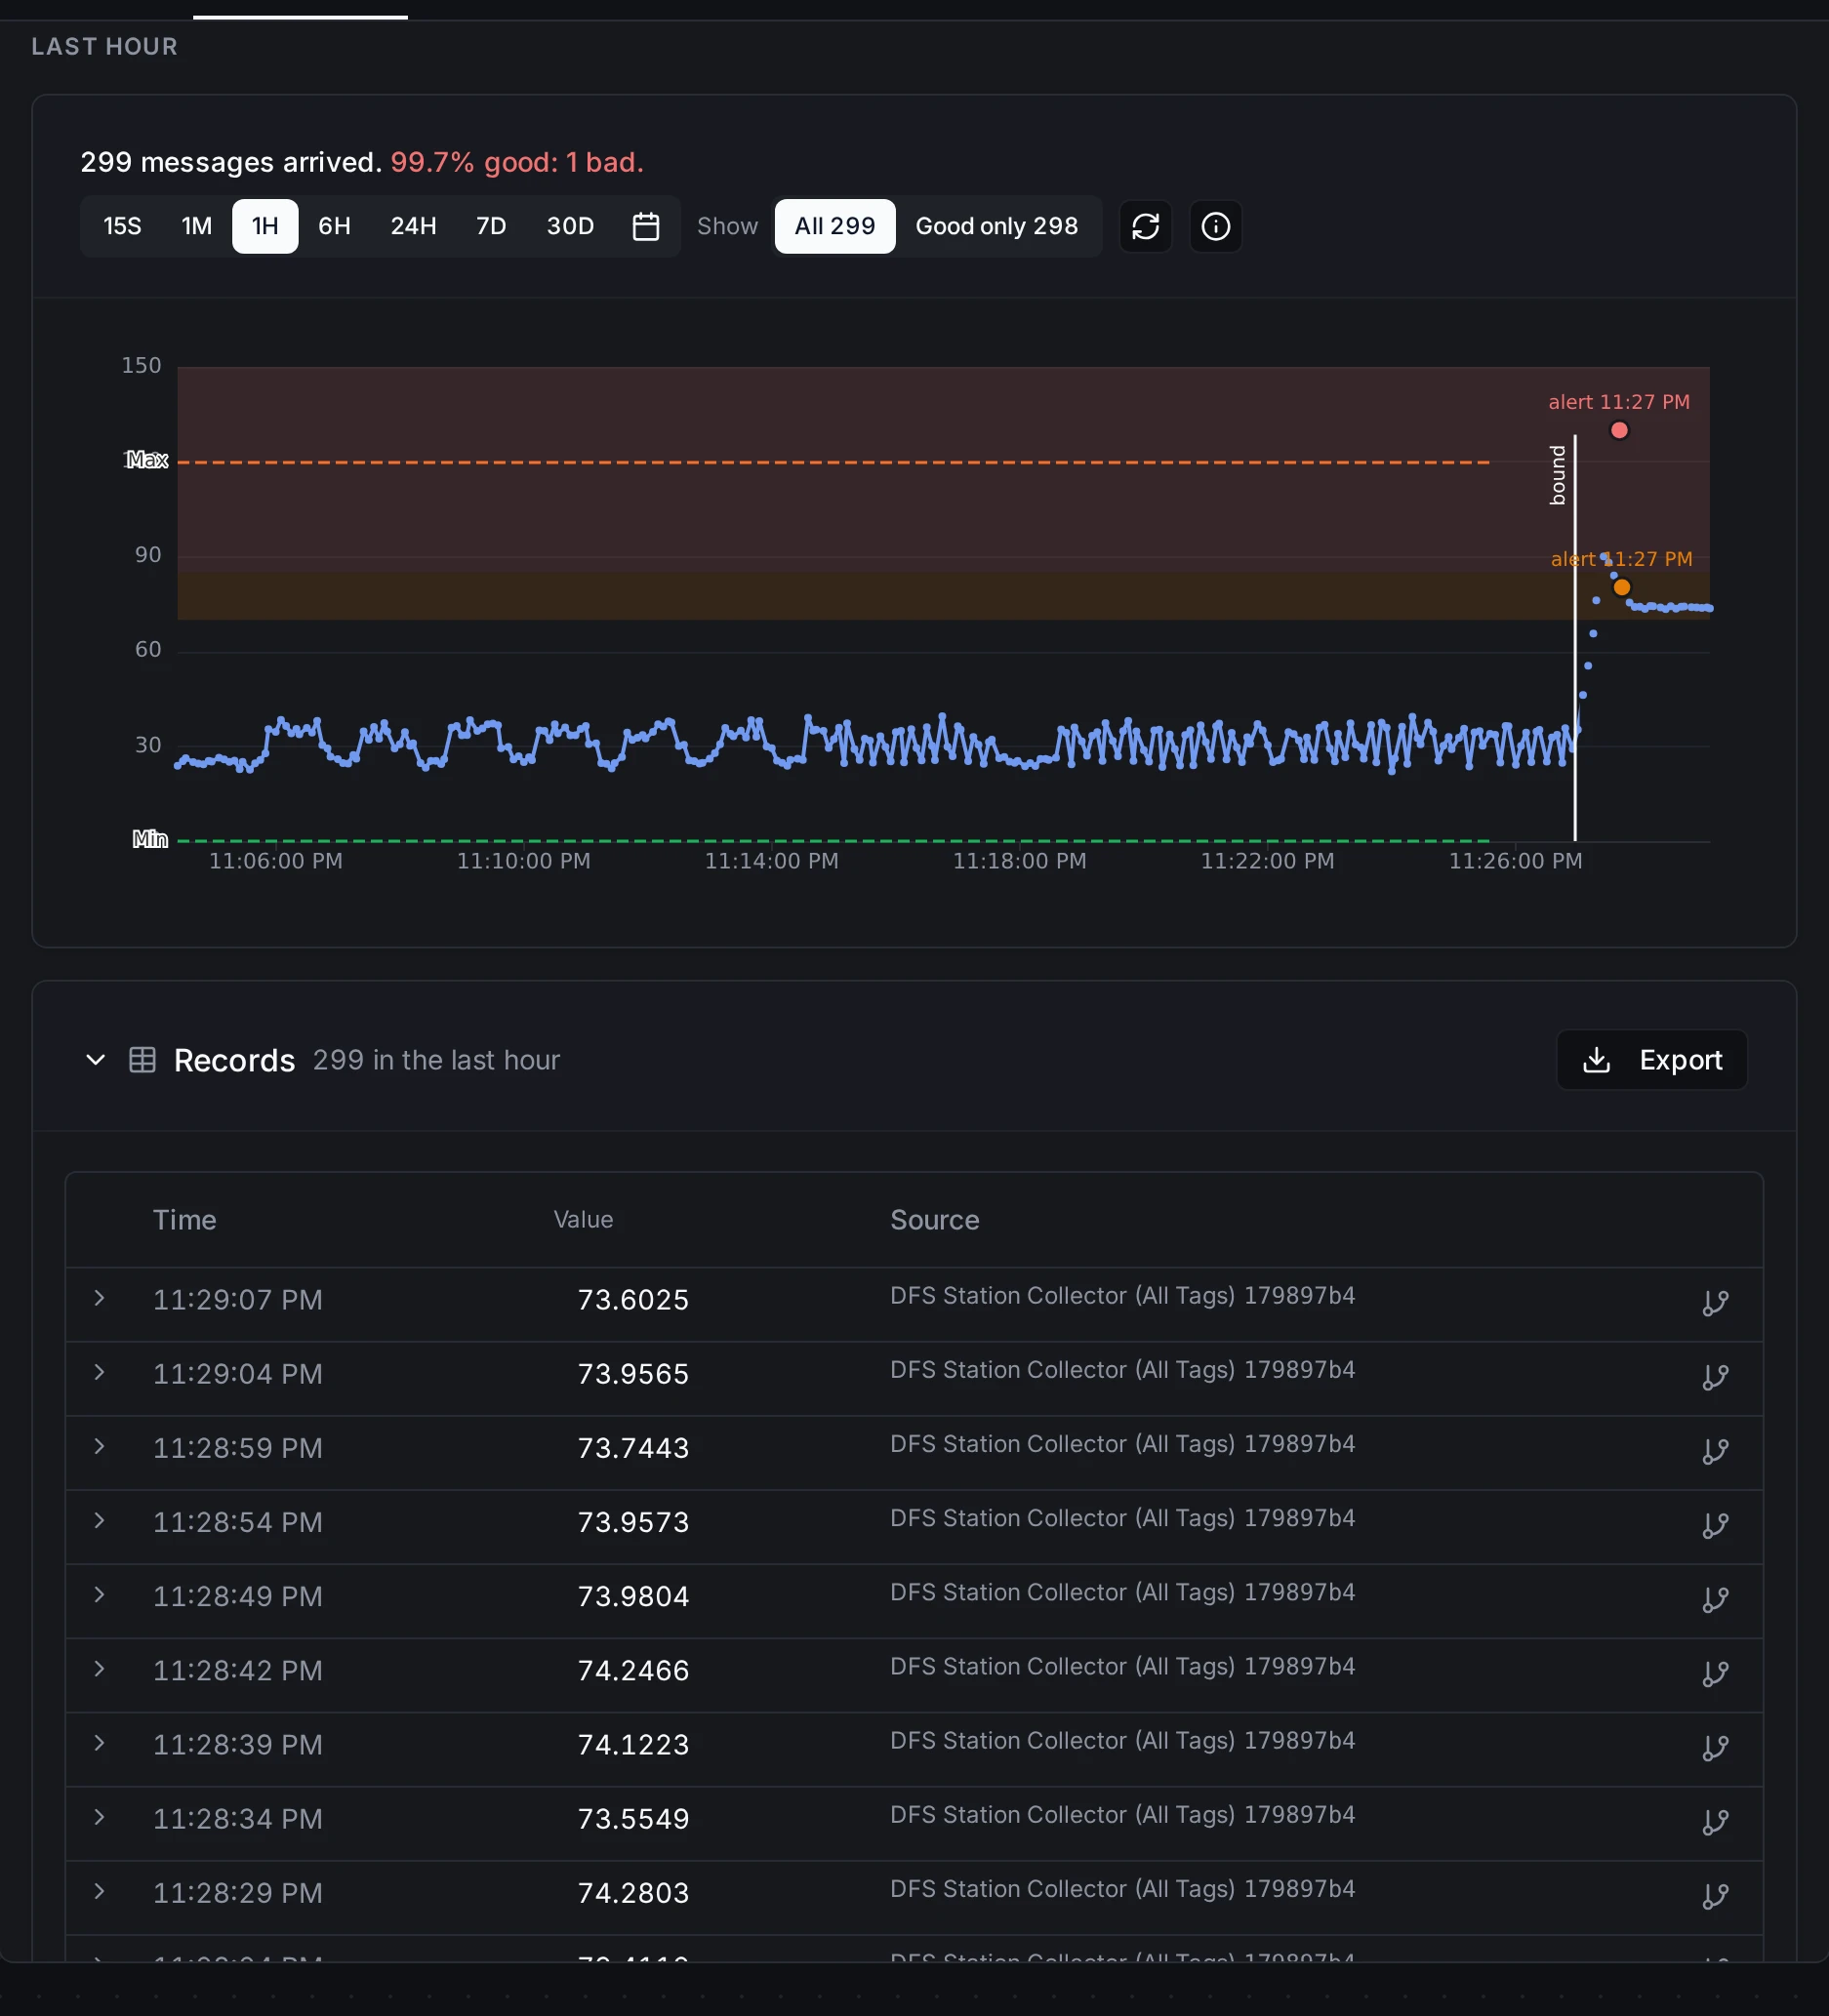
Trend chart with limit bands and the Records table for the last hour
Export
Click the Export button in the top-right corner of the Data Records section to download the visible records as a JSON file. This is useful for sharing evidence with other teams, attaching data to root-cause reports, or feeding records into external analysis tools.


Export historical records as JSON for offline analysis or reporting.
What went wrong
The What went wrong section keeps every problem on the page as one list in time order: the silence, every alert, every violation, each a time, a chip, one sentence and its next action. 12:41:53 · Silent · press-shop-plc-02 down. 21 other signals on the same connection stopped too. with Open connection, Restart and Why? (the same investigation drawer the Overview's stopped-signal list uses); 12:37:04 · Critical alert · High: 84.2 °C is above the 80 °C limit. Third time since 49 min ago. Still active, unacknowledged. No value has arrived to clear it. with Acknowledge, Shelve and Why? (the probable-cause walk). When a feed has nothing, the list says so in a quiet row, No rejections. Every message matched Discharge pressure., because silence about violations should be a statement, not an absence. Show every alert and violation row opens the two full panels described next.
Alerts
Alerts on this topic shows alert threshold crossings for the current topic. When a numeric value published here crosses a warning or critical limit set on its meaning's property, or on the meaning itself, an alert is raised by the deadband evaluator, showing the level (warning/critical), the breaching value, the limit, and the property's remediation message. You can acknowledge or shelve an alert from its row.
When the topic is healthy you see No alerts: "This topic has been within its alert thresholds. Alerts will appear here when values cross warn or critical bounds."
This is the topic-scoped view of the workspace-wide feed. For thresholds, the deadband state machine, acknowledging vs clearing, and how alerts differ from violations, see the Alerts page.
Alerts only appear once the topic has a meaning with warn/critical limits. Use Give this topic a meaning under the topic's name; see Giving a topic a meaning.
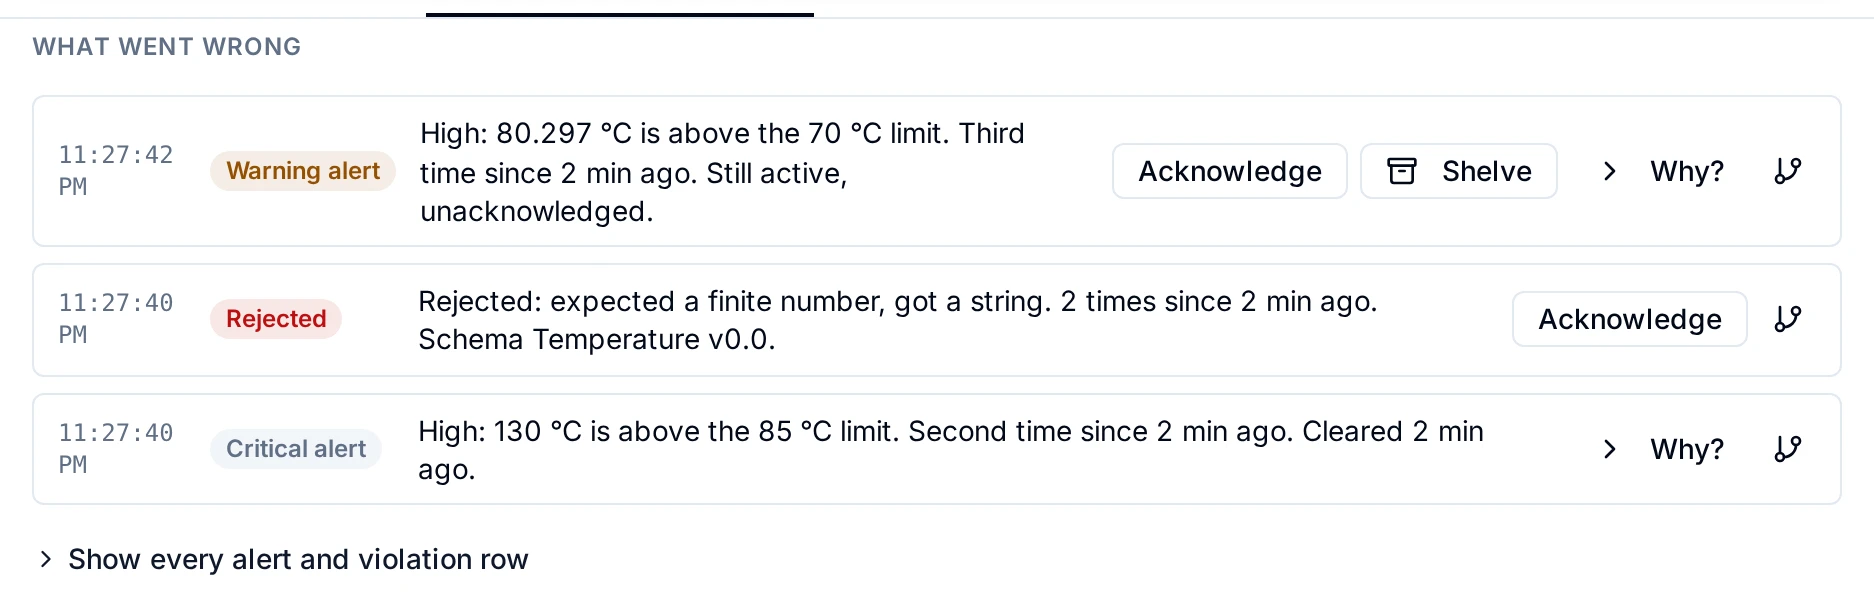
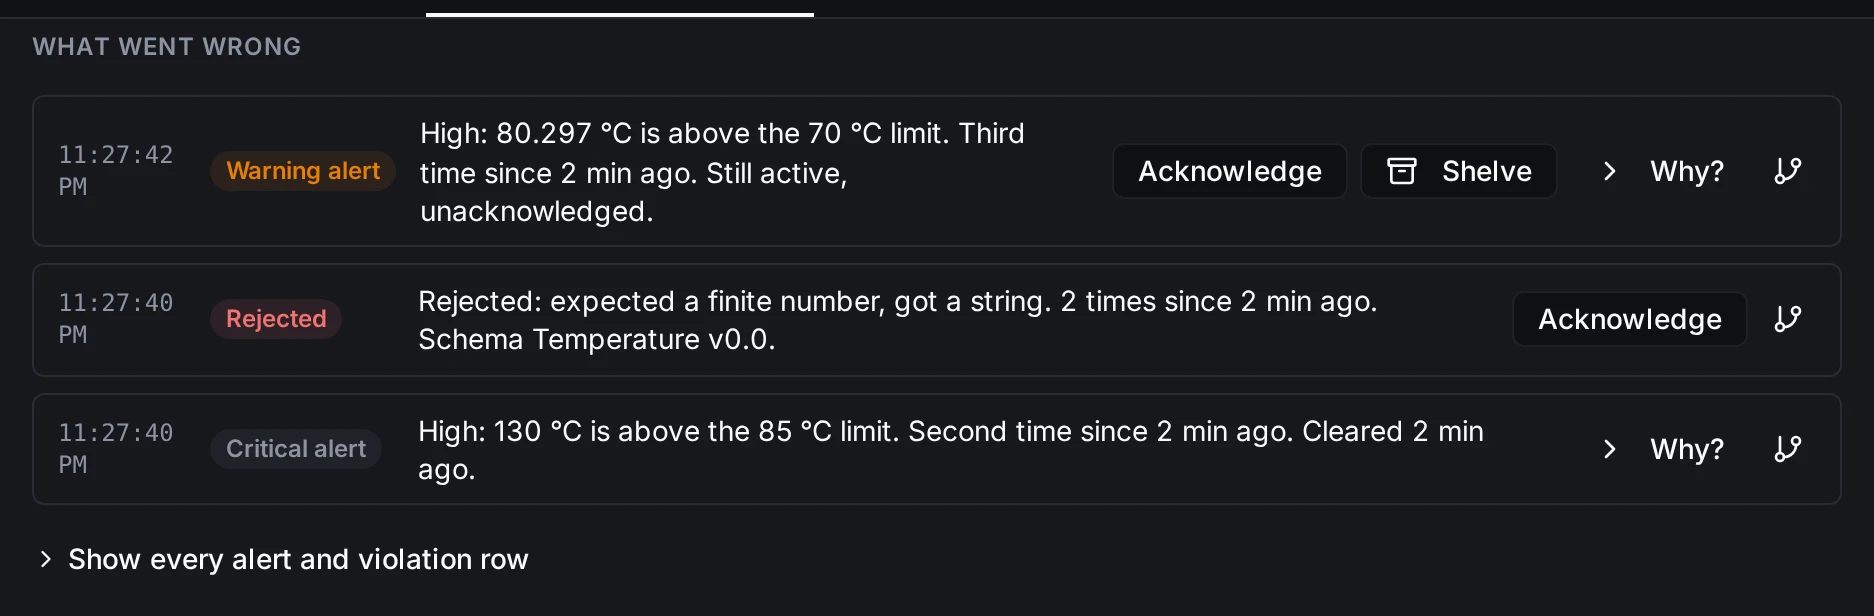
A topic's alerts: a cleared critical alert and an active warning
Violations
Violations on this topic shows publishes that broke the rules of the topic's meaning. Each row identifies the offending value and whether it was rejected or stored with degraded quality. Type errors are always refused. Other failures (range, shape, stale, overflow or constraint) are stored with degraded quality, unless the branch's validation rule is enforce, which refuses them. The row also names the property, the reason and the validation rule.
When every publish has kept to the meaning you see No violations: "Every publish on this topic has kept to its meaning. Violations appear here when a publish fails validation."
This is the topic-scoped view of the workspace-wide feed. For the full list of violation kinds, how validation and alerting run in order, and the difference between the two, see the Alerts page and Libraries › Validation rules on the topic tree.
Violations only appear once the topic has a meaning. A topic with no meaning accepts every publish as it is. Use Give this topic a meaning under the topic's name; see Giving a topic a meaning.


A type violation that was rejected
Where it comes from
The Where it comes from section answers the single most-asked operator question, "why is this number?", as a sentence and a map. The sentence comes first: This 84.2 °C was published at 12:41:52 by press-telemetry from two inputs. The newest input, temperature_raw at 83.9, was read from register read 40021 on press-shop-plc-02 1 s earlier; that connection is down now. Two things read this topic: the OEE dashboard and the shift-report pipeline. Every noun in it is a link to the surface it names, and every noun is a card on the map beneath it.
Why Lineage? When a computed KPI looks wrong, an OEE of 0.36, a counter that never moves, the next question is always where did this come from? Lineage replaces log-diving with a picture: every value carries a record of the inputs it was derived from, so you can walk from the result back to the sensor that started it.
This works because lineage is not inferred after the fact. When a pipeline computes a value, it records every input it consumes as it runs and stamps that provenance onto the record at publish time. The map simply reads back what was already saved with the value.
Reading the map
The map is laid out in lanes from left to right, the way lineage is usually drawn: upstream on the left, the value you asked about fixed near the right, its readers on the far right. Lanes alternate between data and the jobs that made it:
- Sources · reads: the register reads, fetches and queries a pipeline made against its connections, one card per read, named after the register or the request and captioned with the connection it ran on. A connection the graph knows the pipeline uses, but that no read names, appears as a plain connection card.
- Pipelines: the pipeline (or computed KPI) that wrote each value, with the run time.
- Inputs · N hops: the topics whose values were consumed, each with the value as it was at that moment, its time and its quality.
- This value: the anchor, outlined.
- Read by: the dashboards, pipelines and apps that subscribe to the topic.
Every card is the same shape: a tile for its kind, a name, a caption, and one small fact. The tiles are the dependency graph's colors and icons: a pipeline is blue, a topic magenta, a function amber, a connection green with its protocol's icon, a dashboard pink. A read made through a function is that function's tile, with its connection's small tile beside the connection's name. Arrows converge on the value: a topic consumed twice is one card with two arrows, and fan-in draws itself. A dead connection is red where it sits.
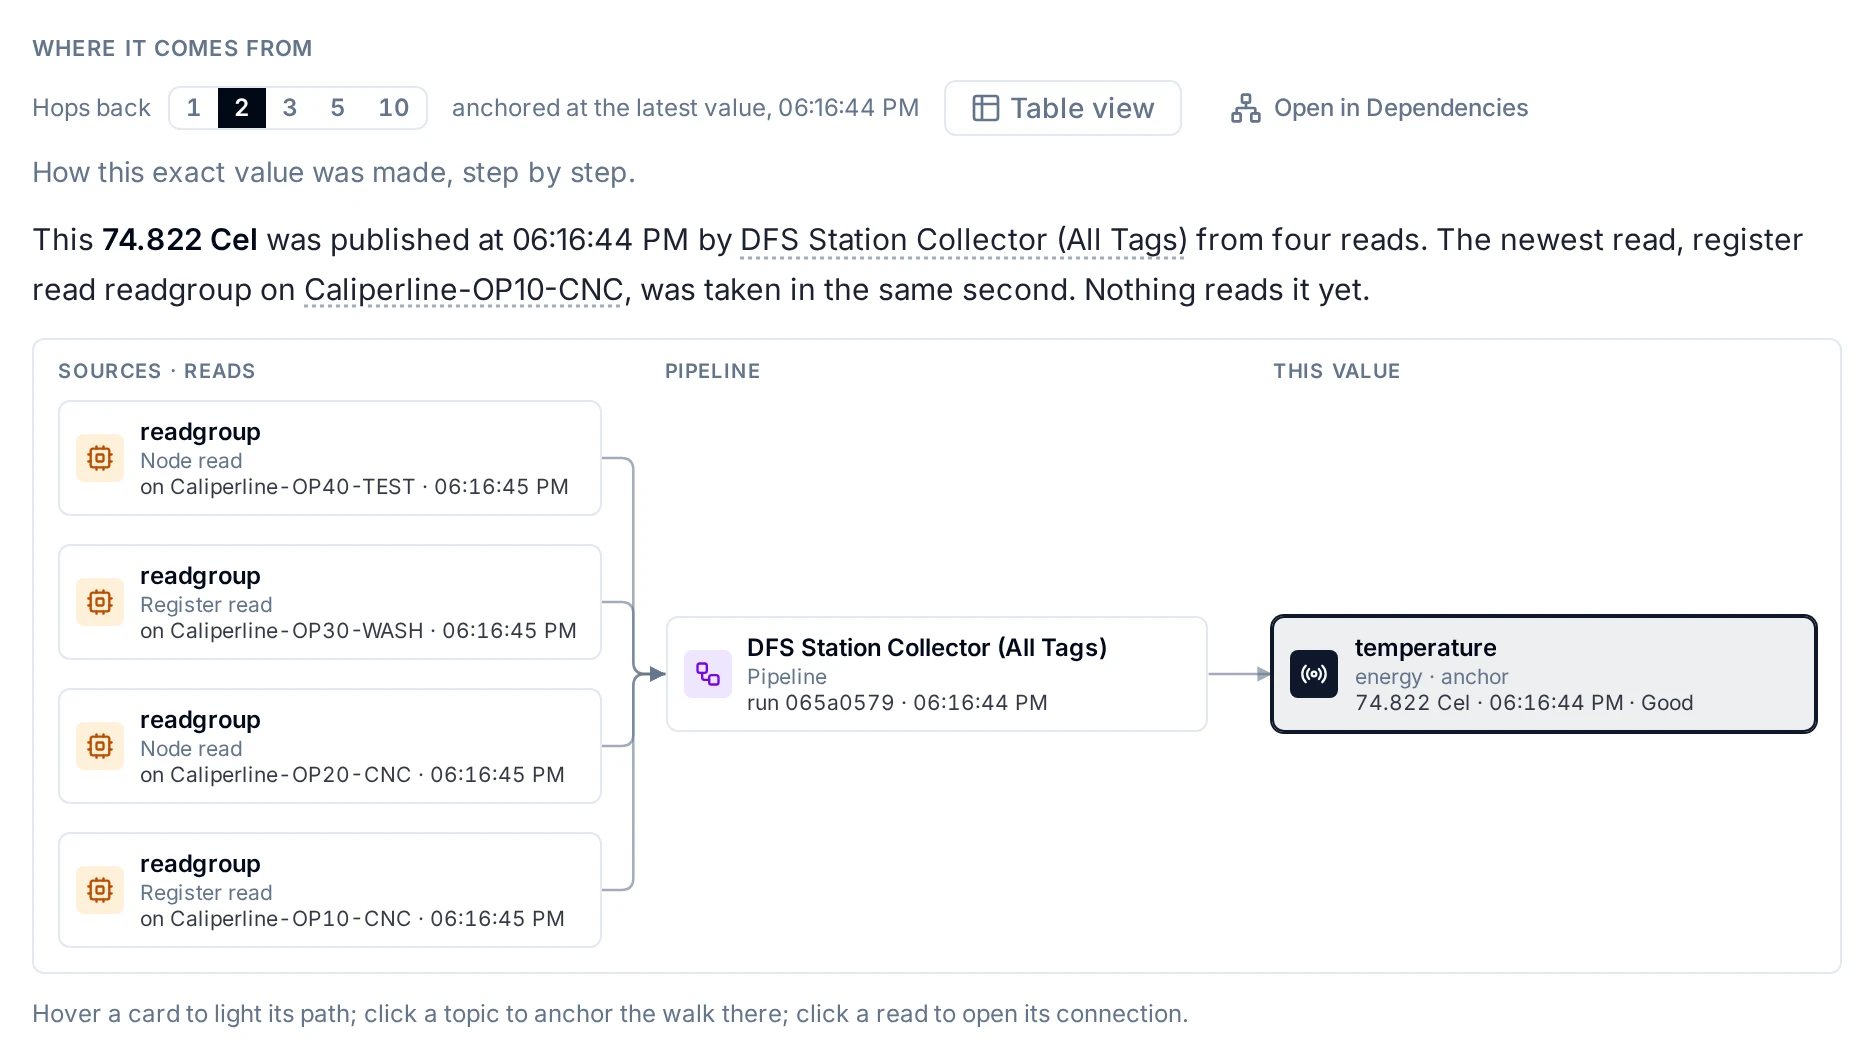
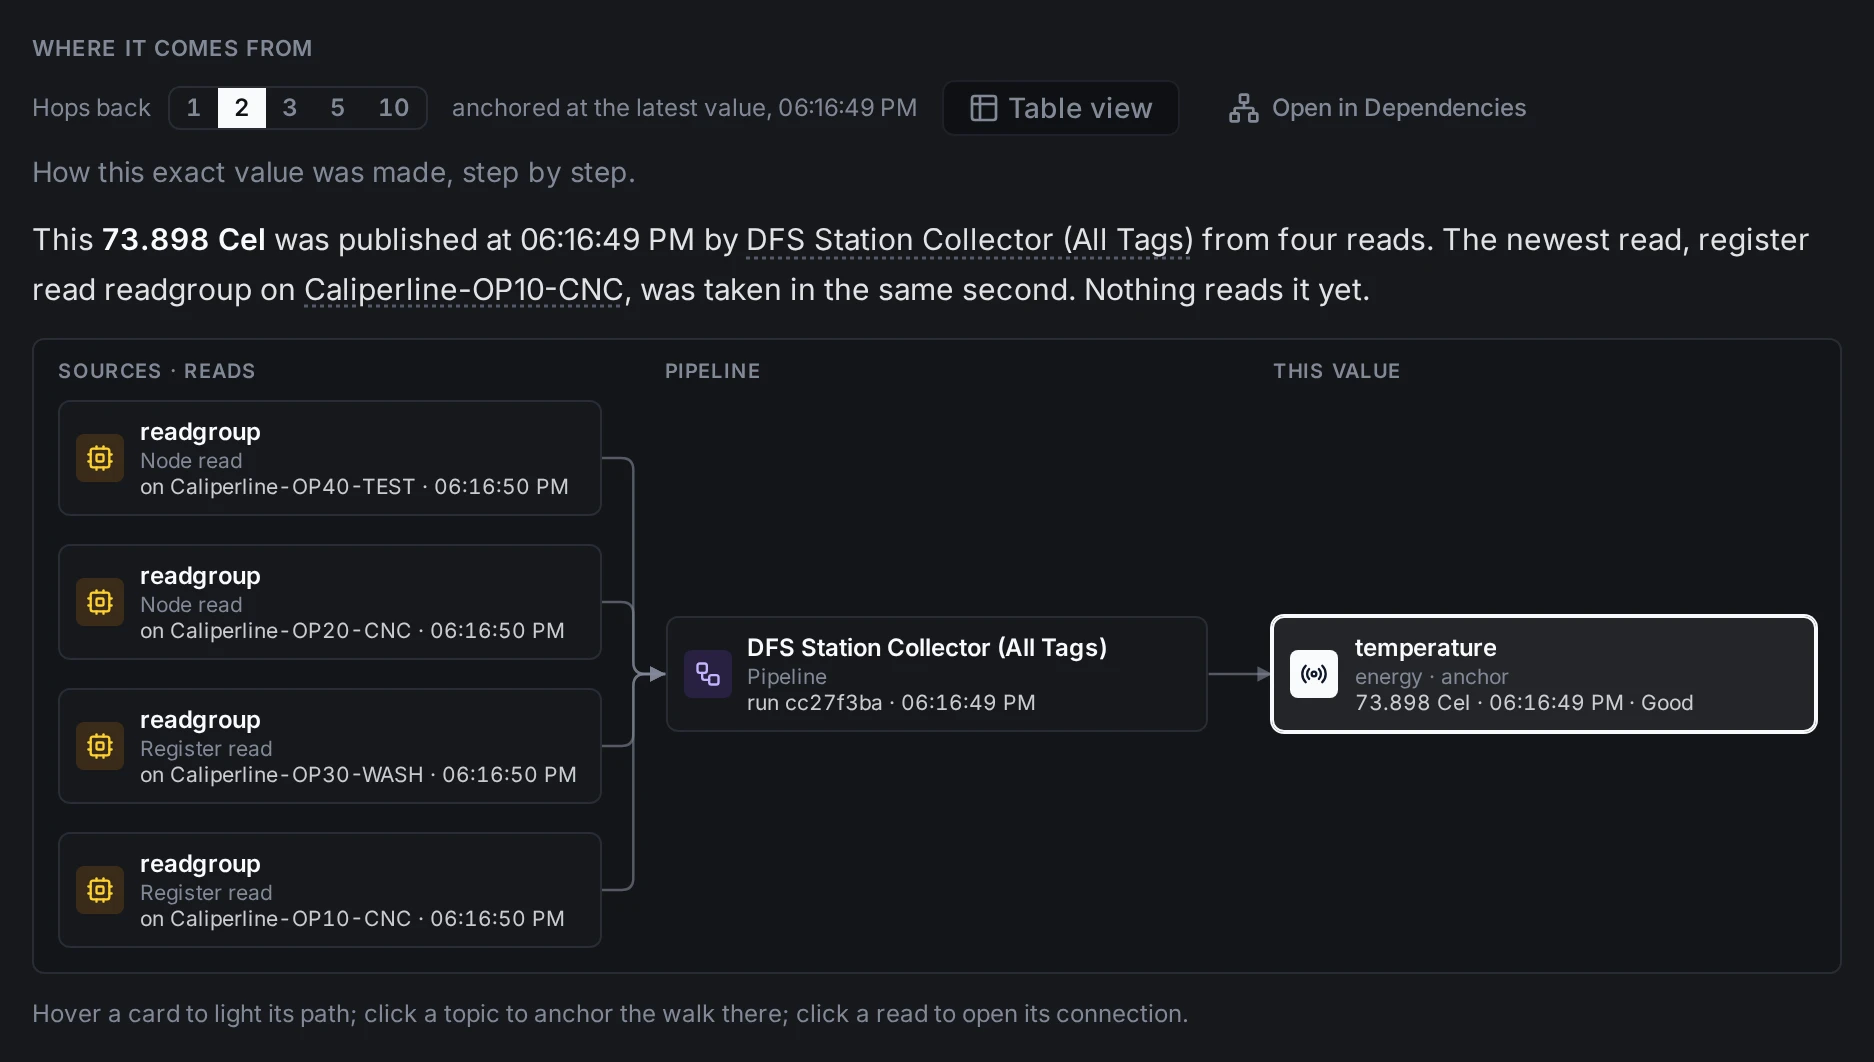
The sentence says the answer; the map beneath it draws the same walk in lanes, upstream on the left.
Hops back at the top is the width of the map: 1 shows the inputs that made the value, 2 shows what made those, and so on up to 10. Depth adds lanes on the left; the anchor and the readers never move. The phrase beside it says which record the map is anchored on. Opening the map from a chart point, a record row or an alert anchors it at that record, and back to latest hands the anchor back.
- Hover a card to light the path through it, upstream and downstream. Each lit line takes the color of the card it starts at and says what it is, in the dependency graph's words: uses, publishes to, uses topic.
- Click a topic to open that topic anchored at the value the card shows: the walk continues from there.
- Click a pipeline to open the run that made the value in the pipeline designer; when the value names no run, the pipeline opens in Dependencies. A read opens its connection's health tab, a reader the dashboard, app or pipeline.
- The pipeline named in the sentence and in the table opens in Dependencies as it was wired when it made the value: the graph as it stood at the moment the platform accepted that value, with what the pipeline was called and connected to then. Open in Dependencies does the same for the topic while the map is anchored at a past value. The moment is when the value arrived, not the time it carries, which a device or a replayed buffer can set much earlier.
- A card that says More upstream means the walk stopped at the chosen depth; clicking it walks one stop further. Clipped means the walk hit its node budget and some chains are not drawn.
Names and wiring as they were
The map tells a value's story as it was when the value was made, not as things stand today.
- Names. Every pipeline, connection and function on the map carries the name it had when its record was made. When it has changed since, its caption says so: Pipeline · now OEE v2, or Pipeline · deleted since. The sentence adds the same in brackets: by OEE calc (since renamed OEE v2). A pipeline deleted since opens in Dependencies as it was then, since there is no pipeline left to replay its run in.
- Who published and who read it. Anchored at a past value, the pipelines that published to the topic, their connections and the topic's readers are the ones the graph held at the moment the value arrived. A pipeline that was added later, or a dashboard that started reading the topic since, is not drawn next to an older value. A line above the sentence says so: Names and wiring as they were when this value was made, 3 Oct 2026, 14:32.
- State is today's. Whether a pipeline is enabled or a connection is down is a fact about now. The map keeps showing it for what still exists, and the sentence says now (that connection is down now).
- Older than the graph's history. The graph keeps its history for a year by default. For a value older than that, the map draws who publishes and reads the topic today and says so; each name is then the one the item has now.
- The latest value is told with today's wiring and state: it was made under them.
A dashed card marked Input unavailable means the parent's provenance names a topic whose value could not be retrieved: it was deleted, retention expired it, you lack read access to it, or it was never published. The card is shown rather than hidden so you can see the trace is incomplete, not pretend it isn't.
The trace loads in a single request: the server walks the whole graph and returns it at once, so deep chains don't get slower per hop.
The table view
Table view replaces the map with the same walk as an indented list: the value first, each input one level in, each read one level further, with the time, the quality and who made it on every row. It is the map's accessible twin and the record an auditor can take away: Copy as text puts the whole derivation on the clipboard.
Where the chain ends
A value published directly, by a broker client, a user or an API caller, has no pipeline card: its source card says who published it, for example broker client edge-gw-3 · Published directly. A value with no provenance at all is said plainly in the sentence: with no record of who made it; when the dependency graph knows a pipeline publishes to the topic, that pipeline is drawn and captioned publishes here, with the note that this particular value carries no provenance.
You rarely need to scroll to the map by hand. Every value surface offers a Trace lineage — why this value? affordance: rows in the records table, points on the live and historical charts, alert and violation rows, dashboard chart points, and entity live-state timestamps all open the topic anchored at exactly that record. Lineage views are also linkable: the URL carries the topic, a tab=lineage marker and the anchor timestamp, so a trace can be shared with a teammate as-is.
A worked example
Suppose oee/score reads 0.684. Opening Lineage on that topic shows three input columns feeding it (availability, performance, and quality) because the OEE pipeline recorded those three topics as the inputs it consumed when it computed the score. Walk back one of them, say availability, and its own chain appears: the downtime and planned-time topics it was calculated from. Keep walking and you eventually reach a card that says chain ends here, listing the read group that pulled the raw counts off the line. At no point did you read a log: every hop was recorded with the value when it was published.
When an unexpected downtime alert appears, subscribe to the relevant topic and watch the Now chart to confirm whether the anomaly repeats. Then scroll to the window section to see when it first started.
Quality Deviation Tracking
Quality teams can monitor tolerance thresholds on the Now chart. The moment a deviation occurs, the window section reveals whether it is an isolated event or part of a recurring pattern.
Maintenance Verification
After preventative maintenance, subscribe to the sensor topic and check the Now chart to confirm accurate readings. Use the window section to compare post-maintenance values against pre-maintenance baselines.
Shift Handover
Outgoing operators can export the last shift's historical data and attach it to the handover report, giving the incoming team a clear picture of what happened.
Root-Cause Tracing
When a computed KPI reads wrong, open the lineage graph and walk the chain back to find which input (or which raw edge read) is responsible, without diving through pipeline logs.
For alerts, this walk is automated: an alert row's Probable cause section walks the lineage of the exact record that fired the alert and ranks anomalous inputs: bad quality first, then unavailable inputs, then uncertain quality, then staleness evidence. An empty result is an answer too: every input was present, Good, and fresh, so the alert is a genuine threshold breach on healthy data.
Asking an AI Agent
An AI client connected to the MCP server has the same capability through the trace_lineage tool. Ask "why is line 3 efficiency 47?" and the agent walks the provenance graph and explains the chain: the producing pipeline, the input values as they were at eval time, and the raw sources where the data entered the system.
Data Explorer brings real-time observation, historical analysis, and data lineage into a single workspace. Whether you are tracking a live anomaly, investigating a past event, or tracing why a value is what it is, every team works from the same source of truth.