Process flow and graph
Your plant as a graph, linked to live data. All questions
Can we model our process flow and the relationships between machines?
Partly
Today MaestroHub publishes the plant structure, the meanings and the process flow to your graph database, keyed by the same topic paths, so a graph question comes back with values and quality. A graph model inside MaestroHub, the Knowledge Graph, is in development and has no release date.
What you can do today
A pipeline on a schedule reads the namespace and writes it to Neo4j:
- The structure: site, areas, lines and machines, from the topic tree.
- The signals: each topic with its path, meaning, unit, latest value, quality and alarm state.
- The process flow: which machine feeds which (product, steam, air), from a list you keep: a table, a file or the pipeline itself.
Every node in the graph carries its topic path, so an answer from the graph ("what feeds Filler 3, and is any of it in alarm?") leads straight back to the live value and its history in MaestroHub.
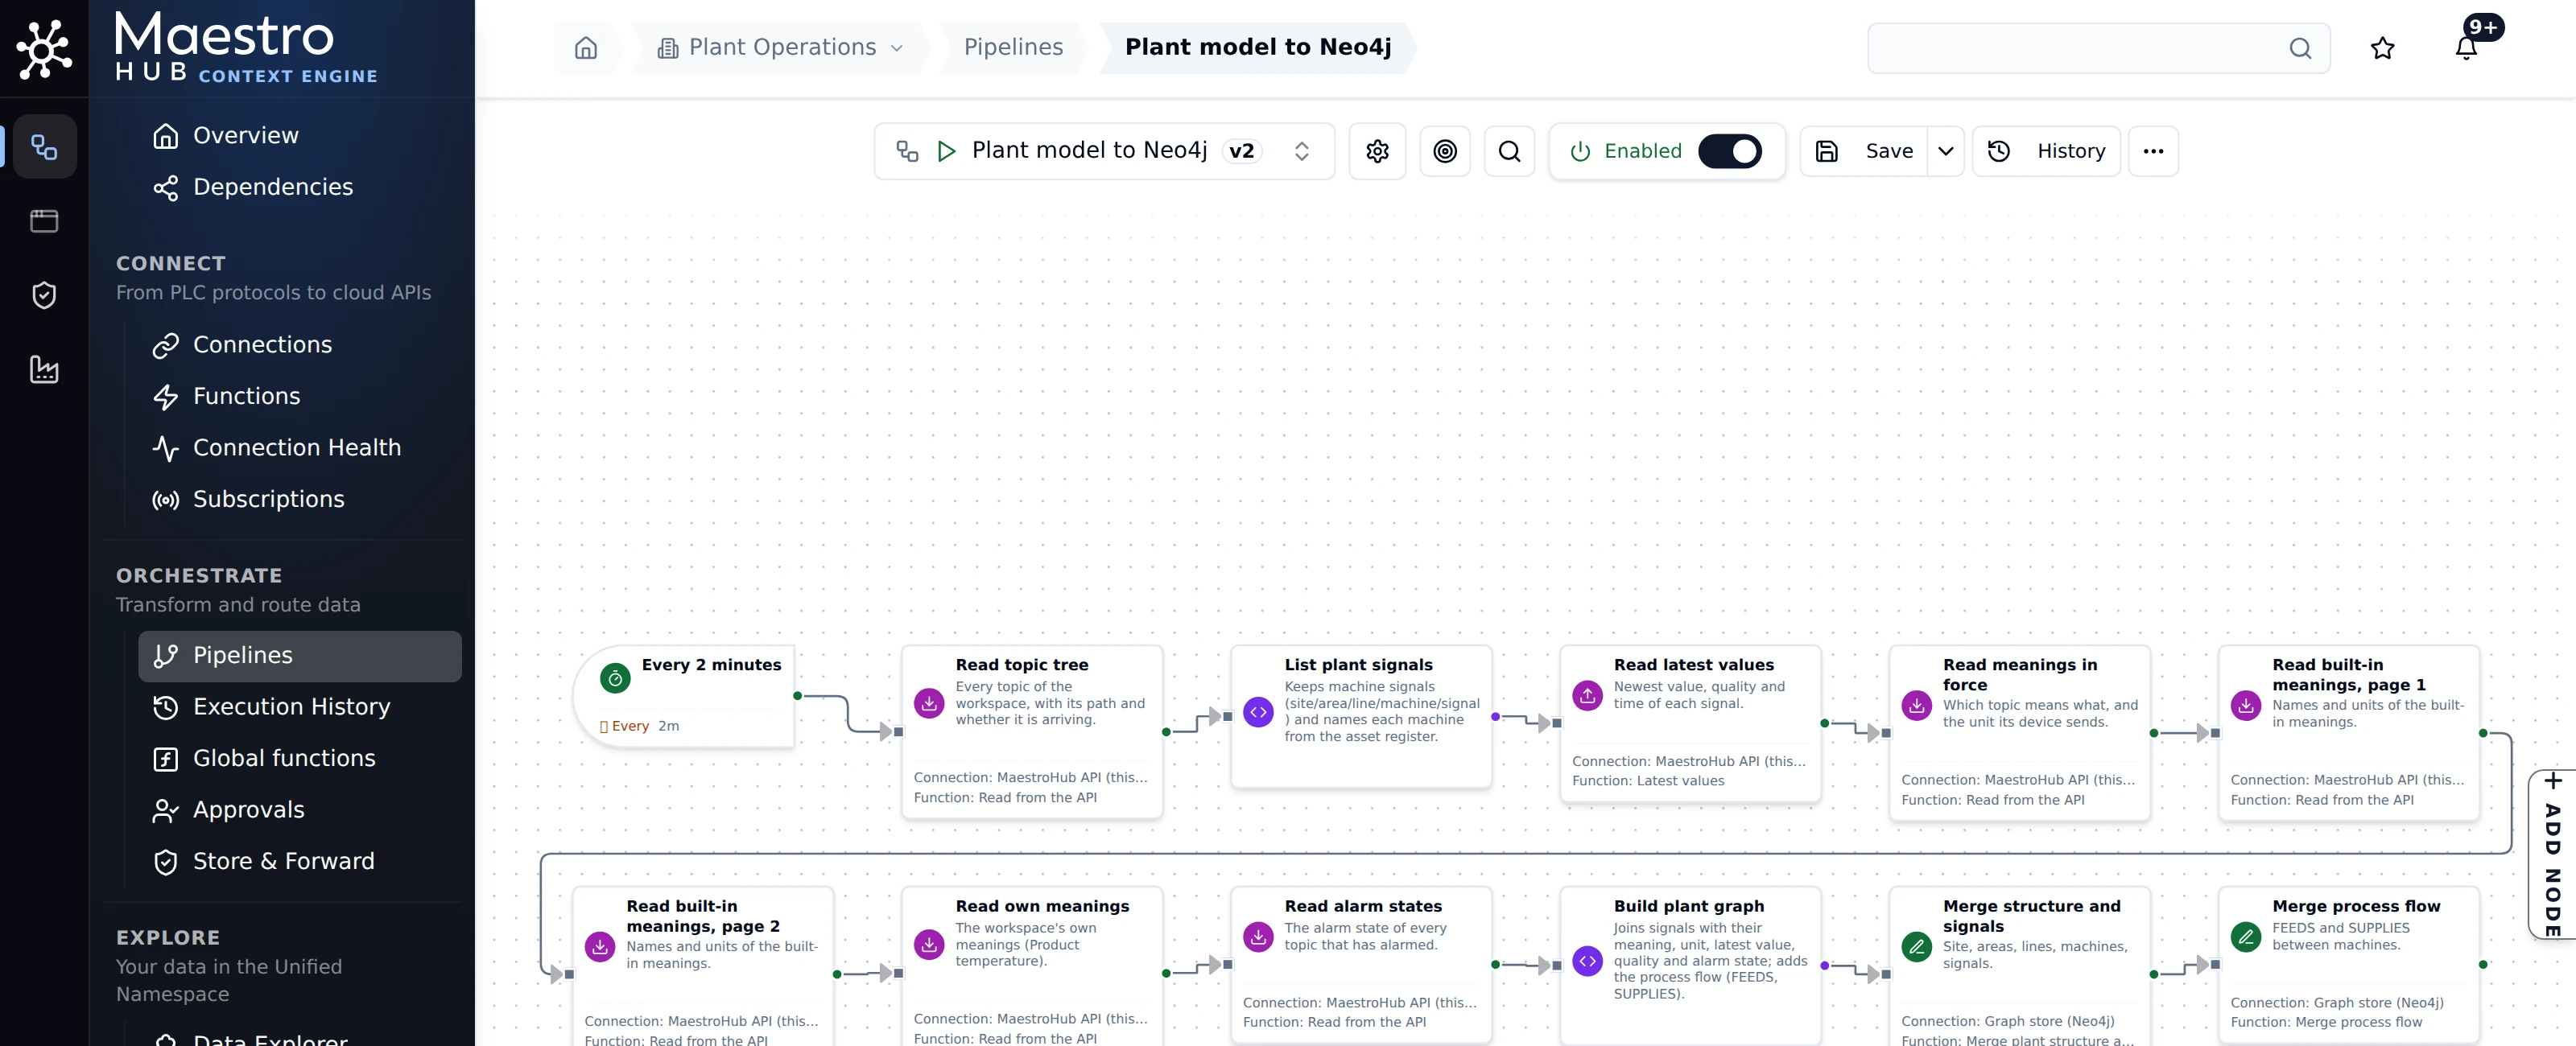
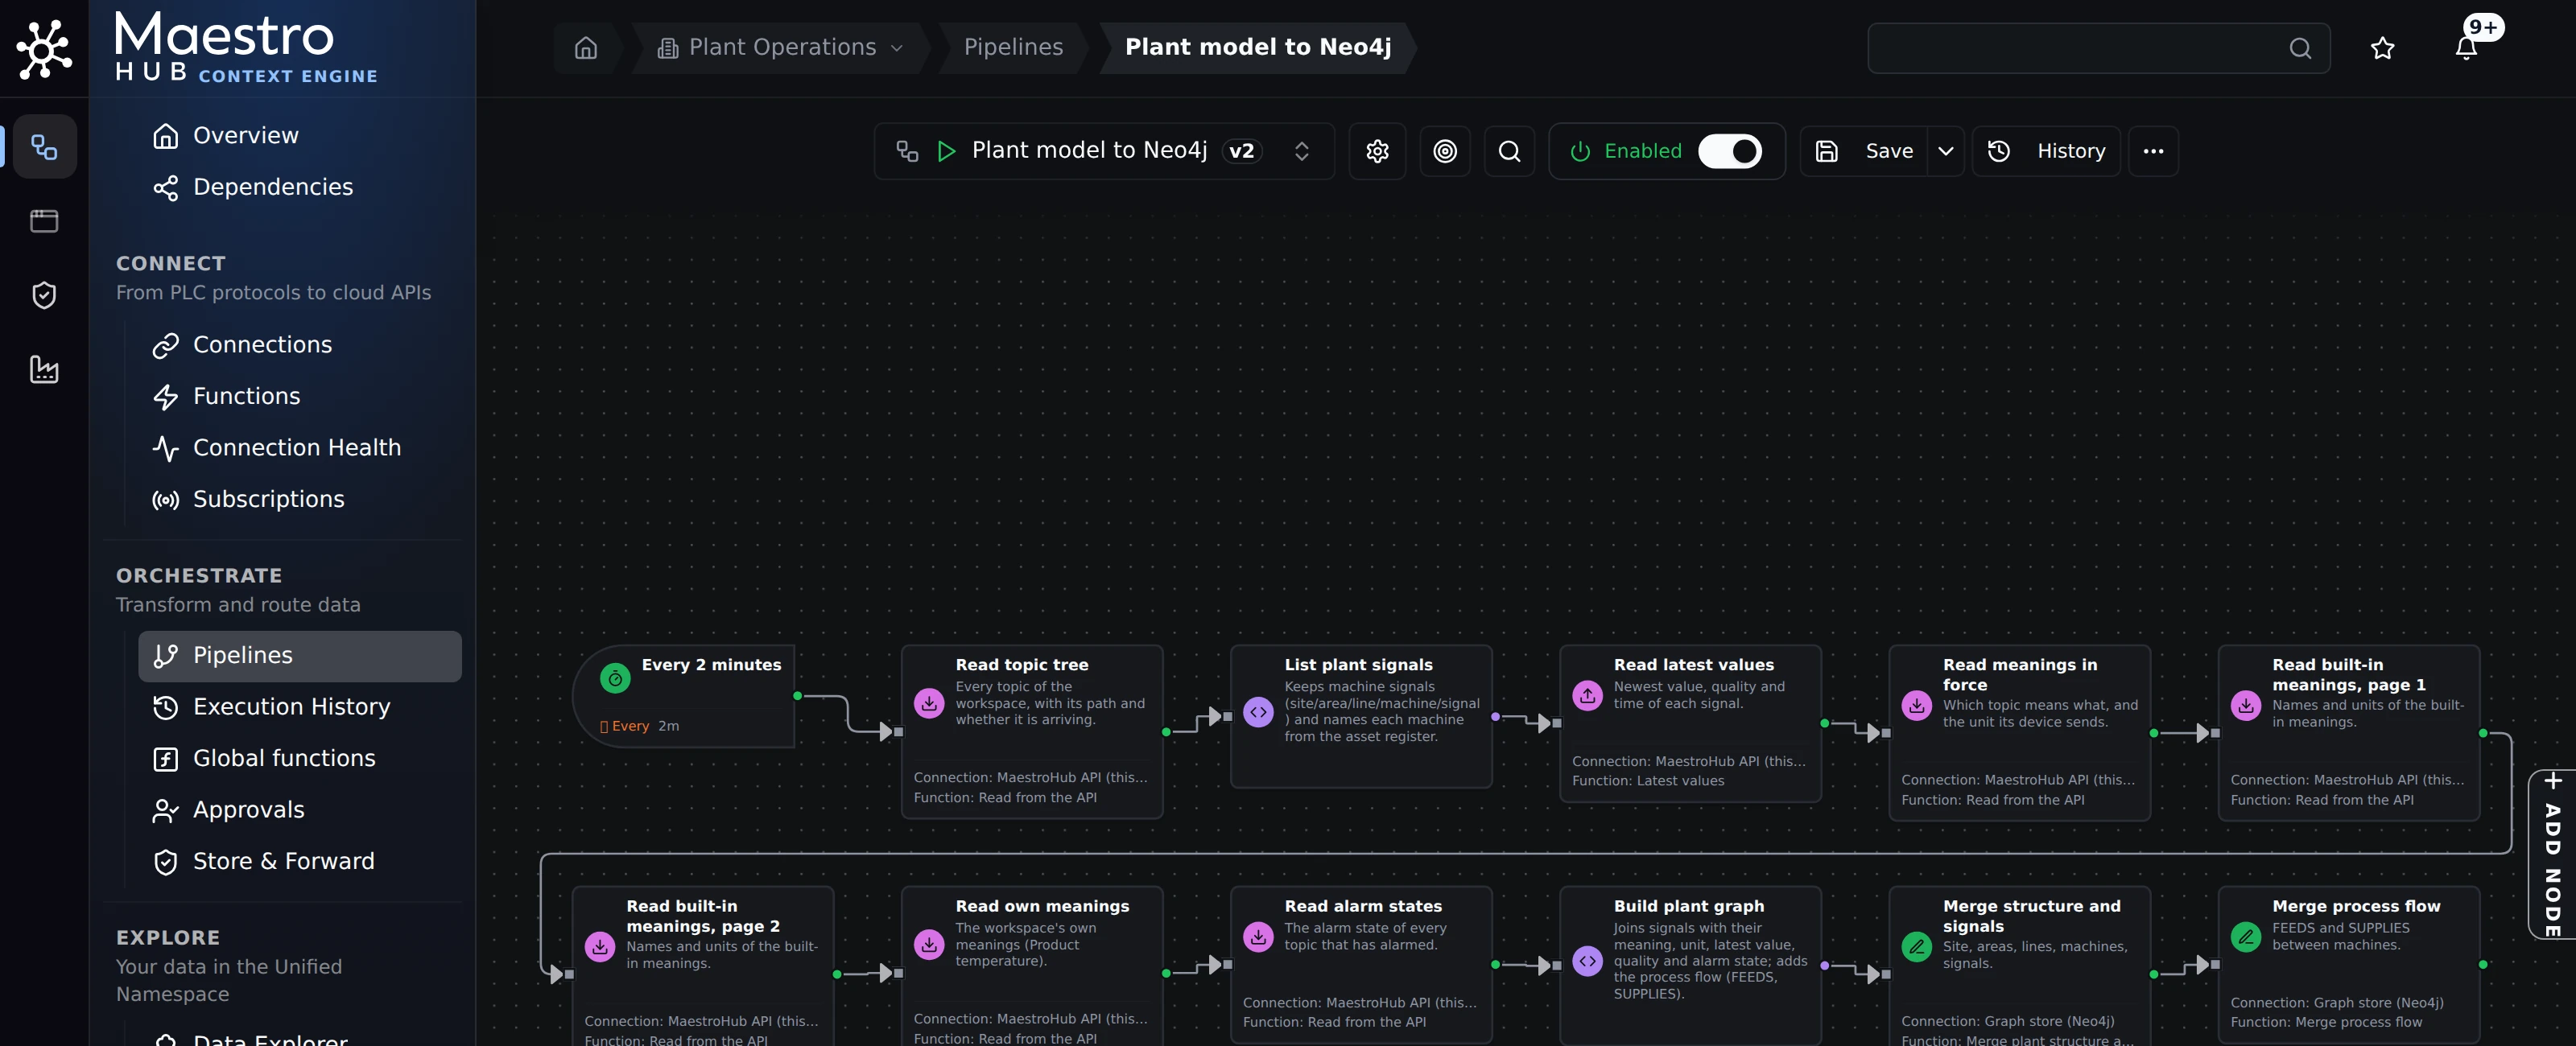
Every two minutes, one pipeline writes the plant, its signals and its process flow to Neo4j.
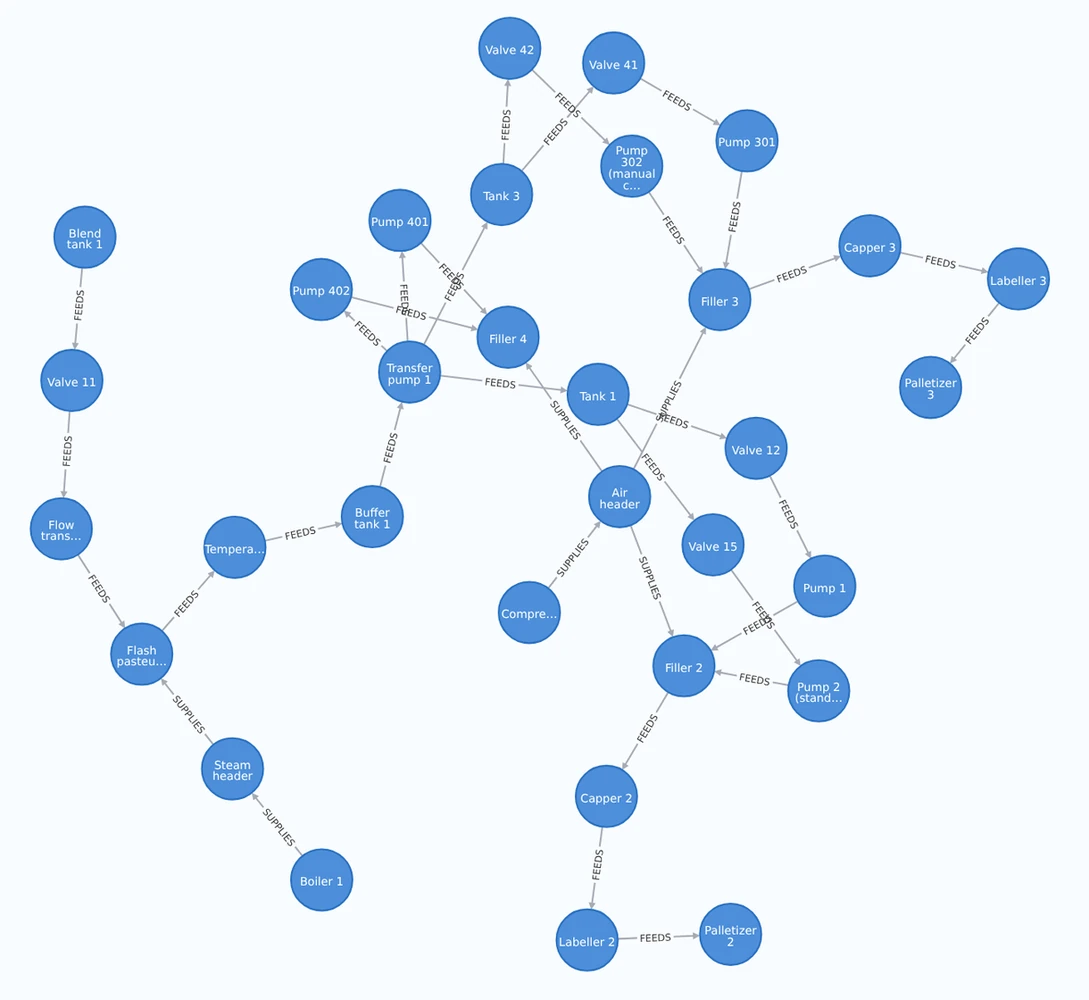
The result in Neo4j's own browser: the process flow as FEEDS and SUPPLIES links.
Try it: connect Neo4j, then build a pipeline that reads topics with the UNS nodes and writes with the Neo4j node. The same pattern works for any graph store that a connector or REST reaches.
Modelling the process flow inside MaestroHub: equipment types, things and their links, and asking the plant as it was on a past day. That is the Knowledge Graph, which is in development and has no release date; these docs label it Coming soon. Until then, the flow is a list you keep and the graph lives in your graph database.