From raw tags to one alarm for all your pumps (10 minutes)
Three pumps on two lines report pressure in psi and bar. Ten minutes from now they read in kPa on one chart, one alarm limit covers all three, and a stuck sensor is flagged.
- Time
- About 10 minutes
- You need
- Data arriving through a connection and a pipeline
- You get
- One unit, one alarm, stuck sensors flagged
- Licence
- Semantic layer (Foundation, Enterprise, trial)
Your devices already send numbers. What they do not send is what the numbers are: one pump says 4.2, another says 62, and only the person who wired them knows that the first is bar and the second psi. Giving those topics a meaning writes that knowledge down once. From then on MaestroHub converts, compares, alarms and checks the values for you, whatever each tag is called.
This tutorial does it on a small example you can copy. The pages that explain each part in depth are Libraries and Giving a topic a meaning.
What you'll get
Three pumps send their discharge pressure:
line1/pump1/discharge_pressure_barsends bar, around 4.3.line1/pump2/discharge_pressure_psisends psi, around 63.line2/pump3/discharge_pressuresends psi too, but nothing says so.
Side by side, 4.3 and 63 cannot be compared, and an alarm "above 450" means nothing to either. After this tutorial:
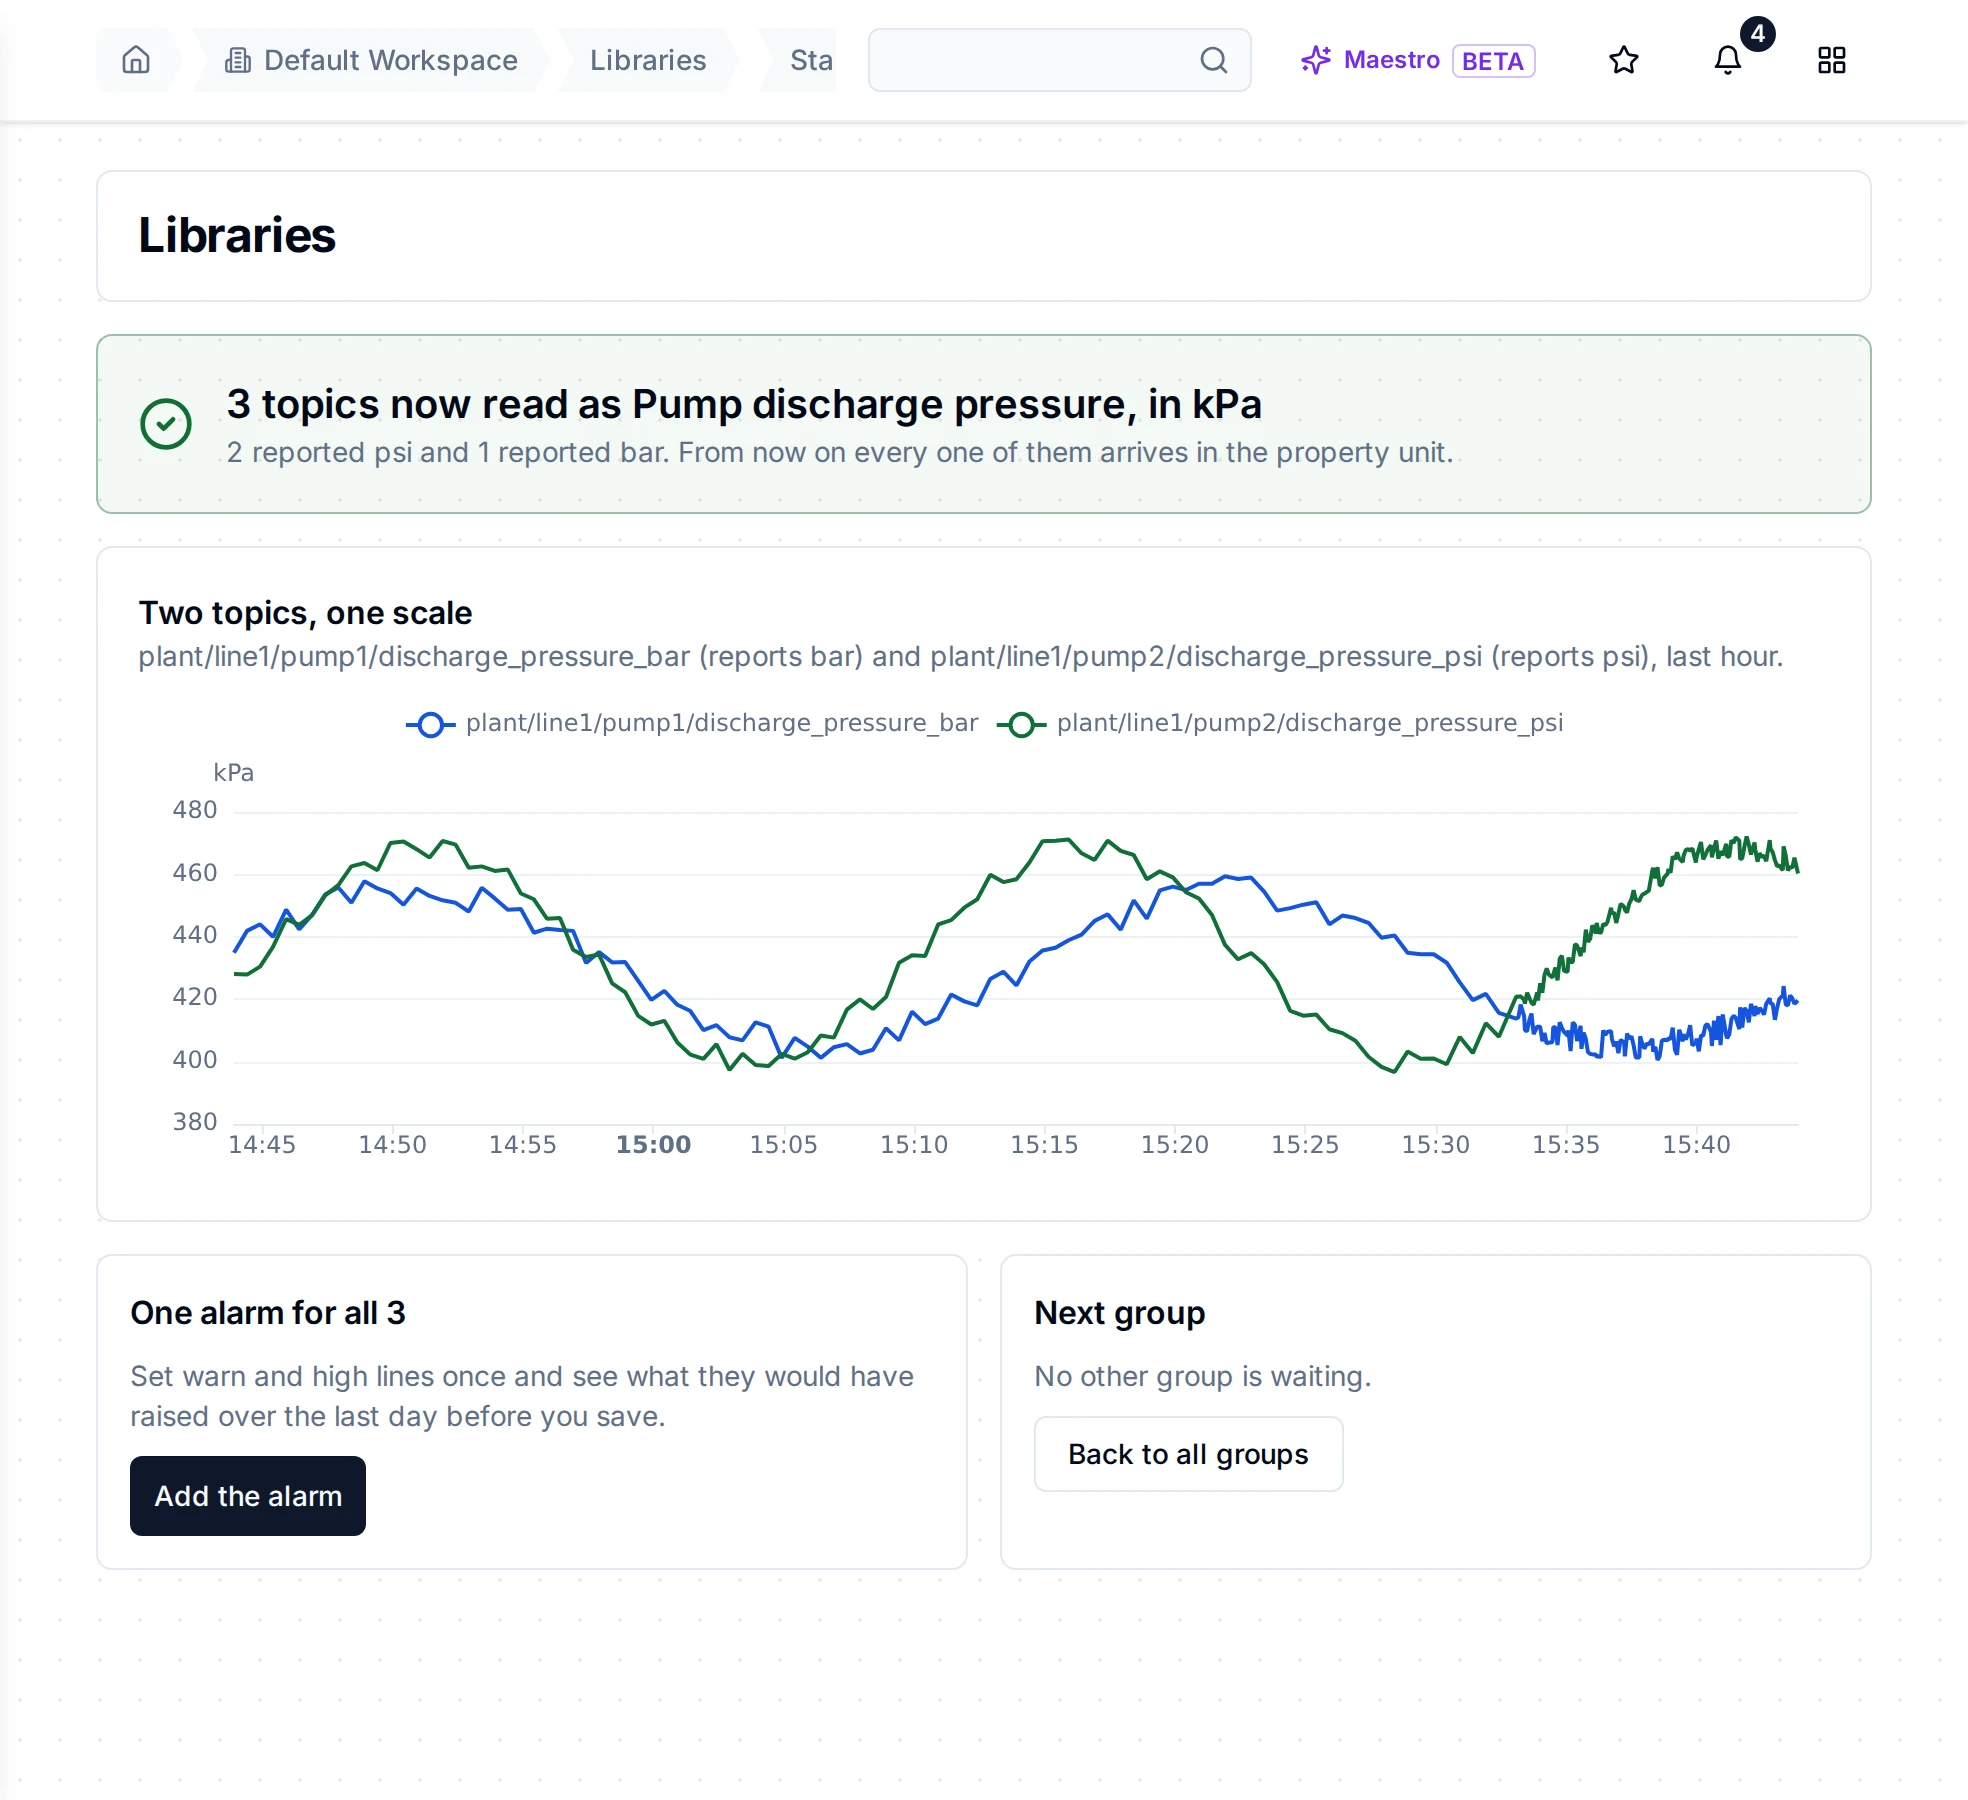
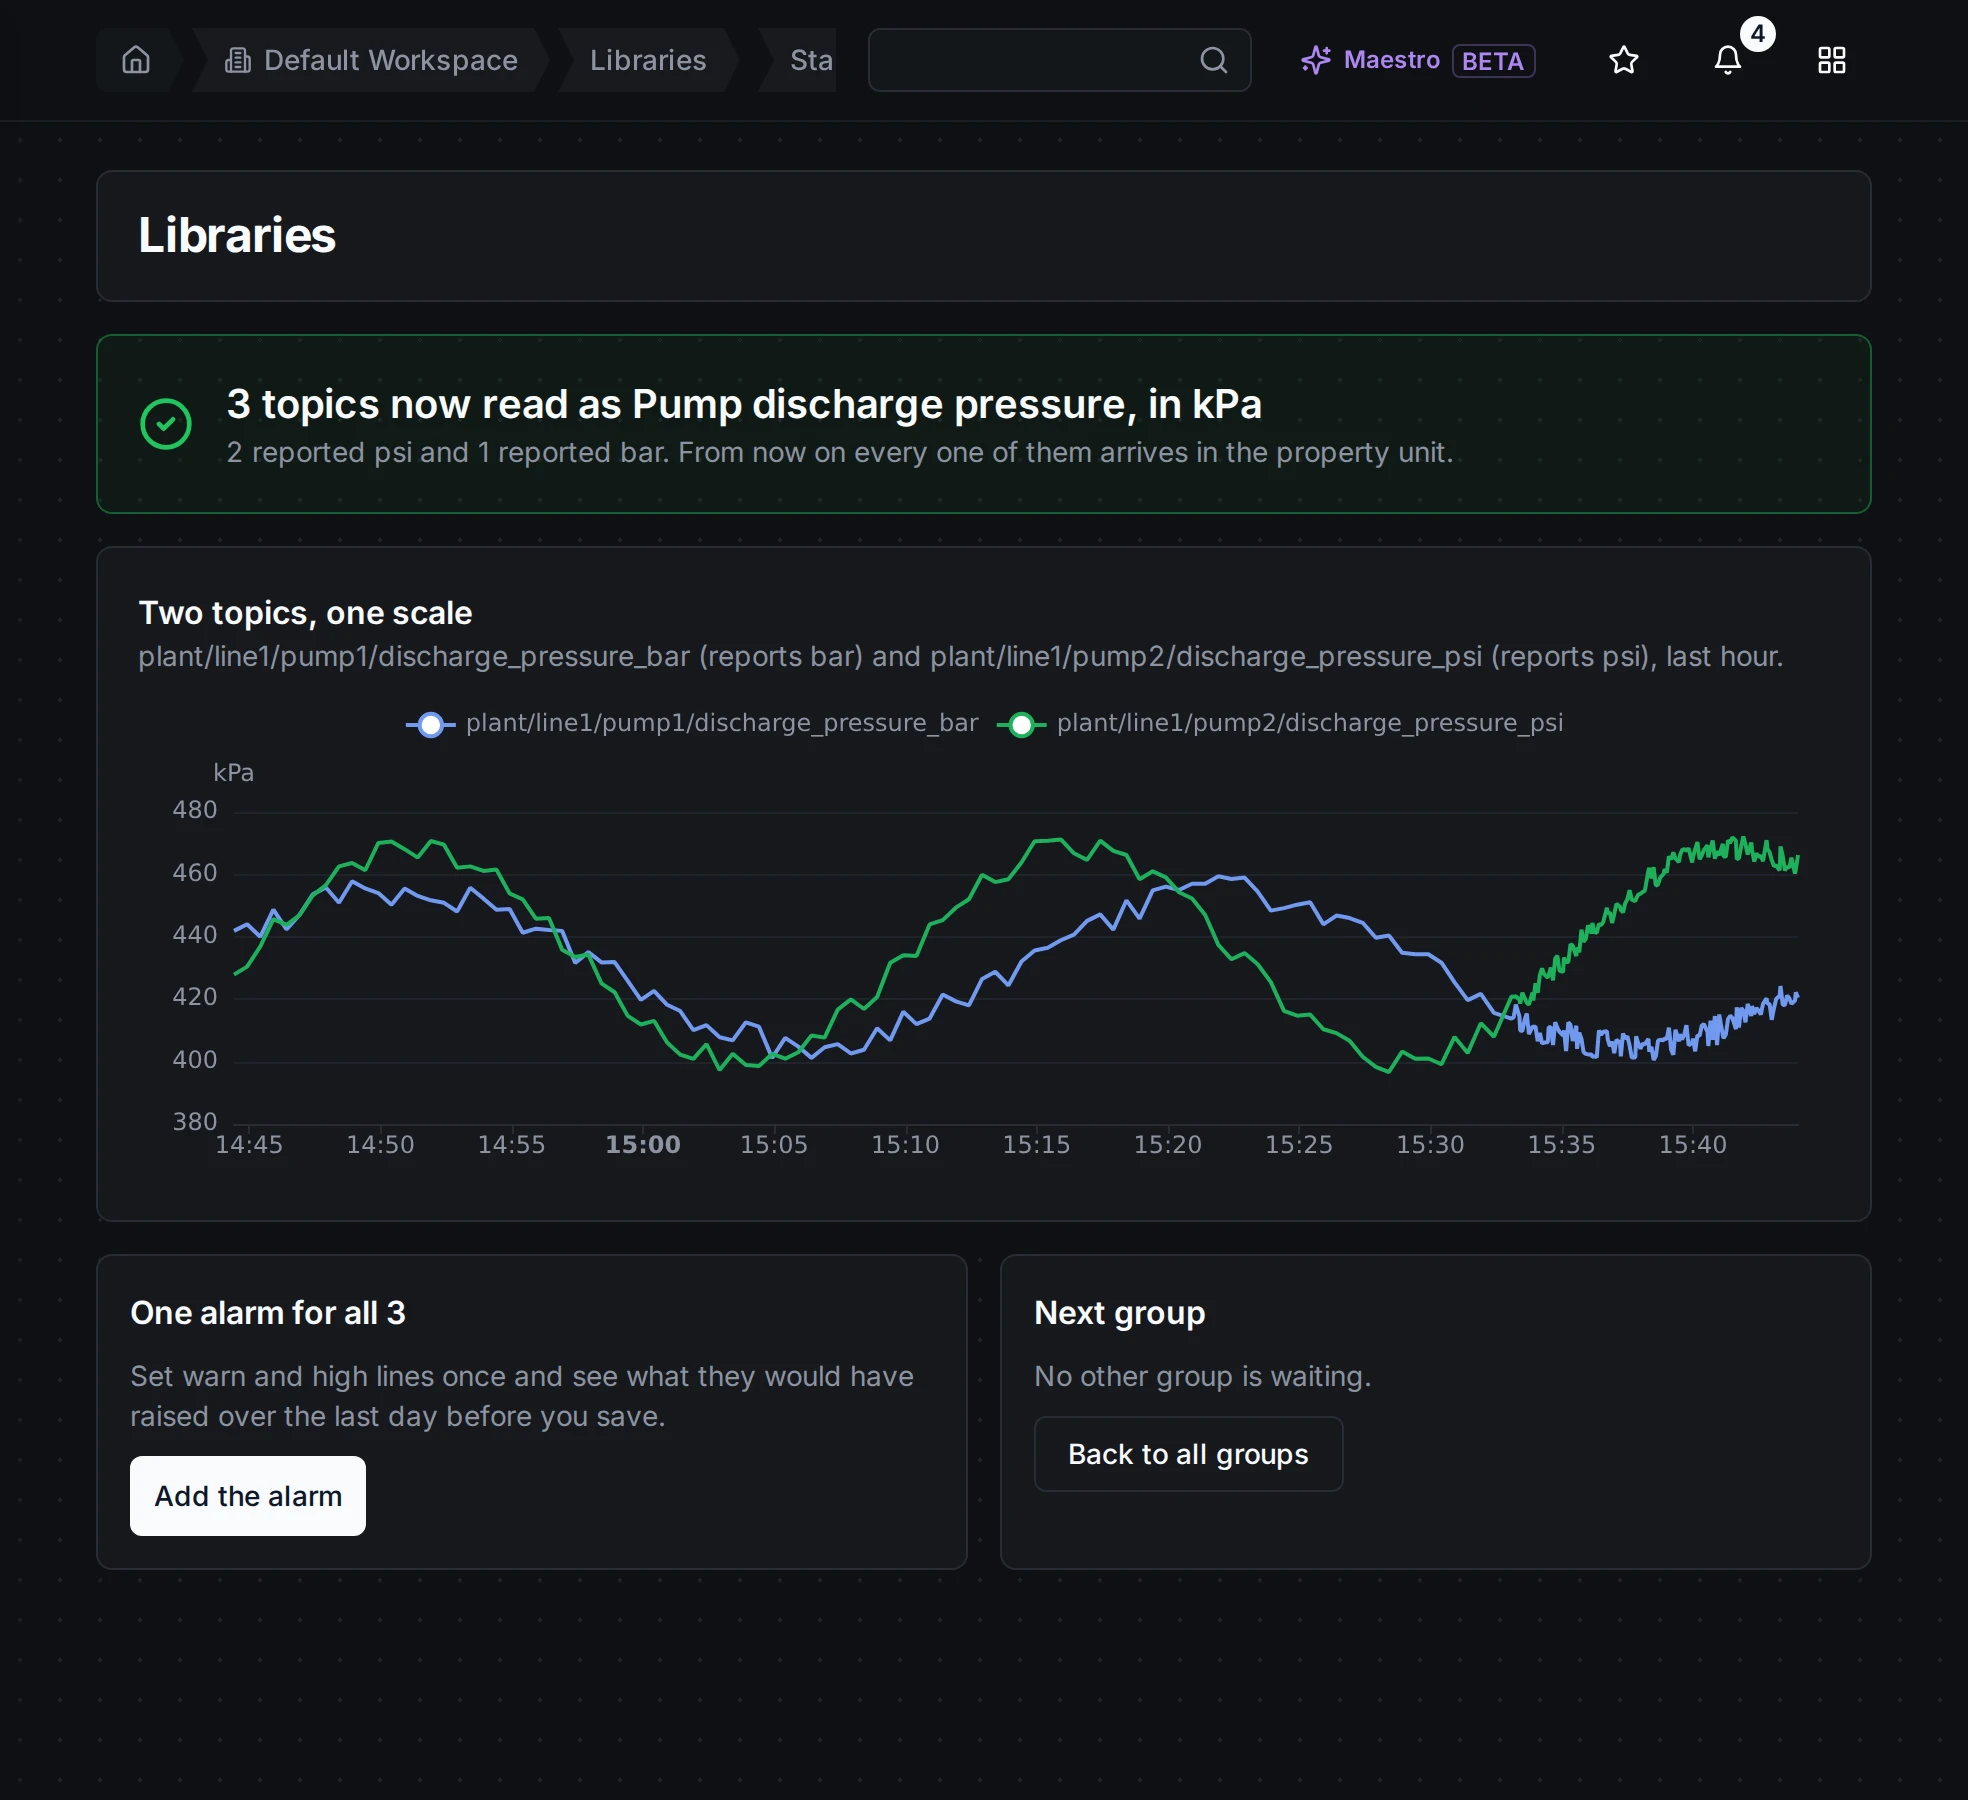
The result: the bar pump and the psi pump on one kPa scale, and one alarm for all three, one click away.
- One unit. All three read in kPa, on one chart, in alarms and in exports.
- One alarm. One warning line and one high line cover every pump, and any pump you give the same meaning later.
- A stuck sensor is flagged. A reading that stops moving is marked frozen, and the topic says so in plain words.
Nothing changes on your devices, and history already stored stays as it was.
Before you start
Data arriving. The pumps' values must already reach the Unified Namespace. In this example a REST connection reads the pump skids' gateway, and a pipeline publishes each pump's pressure every 5 seconds: a Schedule Trigger, a REST Request that runs the connection's function, and one UNS Publish per pump. Any connection and pipeline that publish your values will do. New to pipelines? Build your first pipeline first.
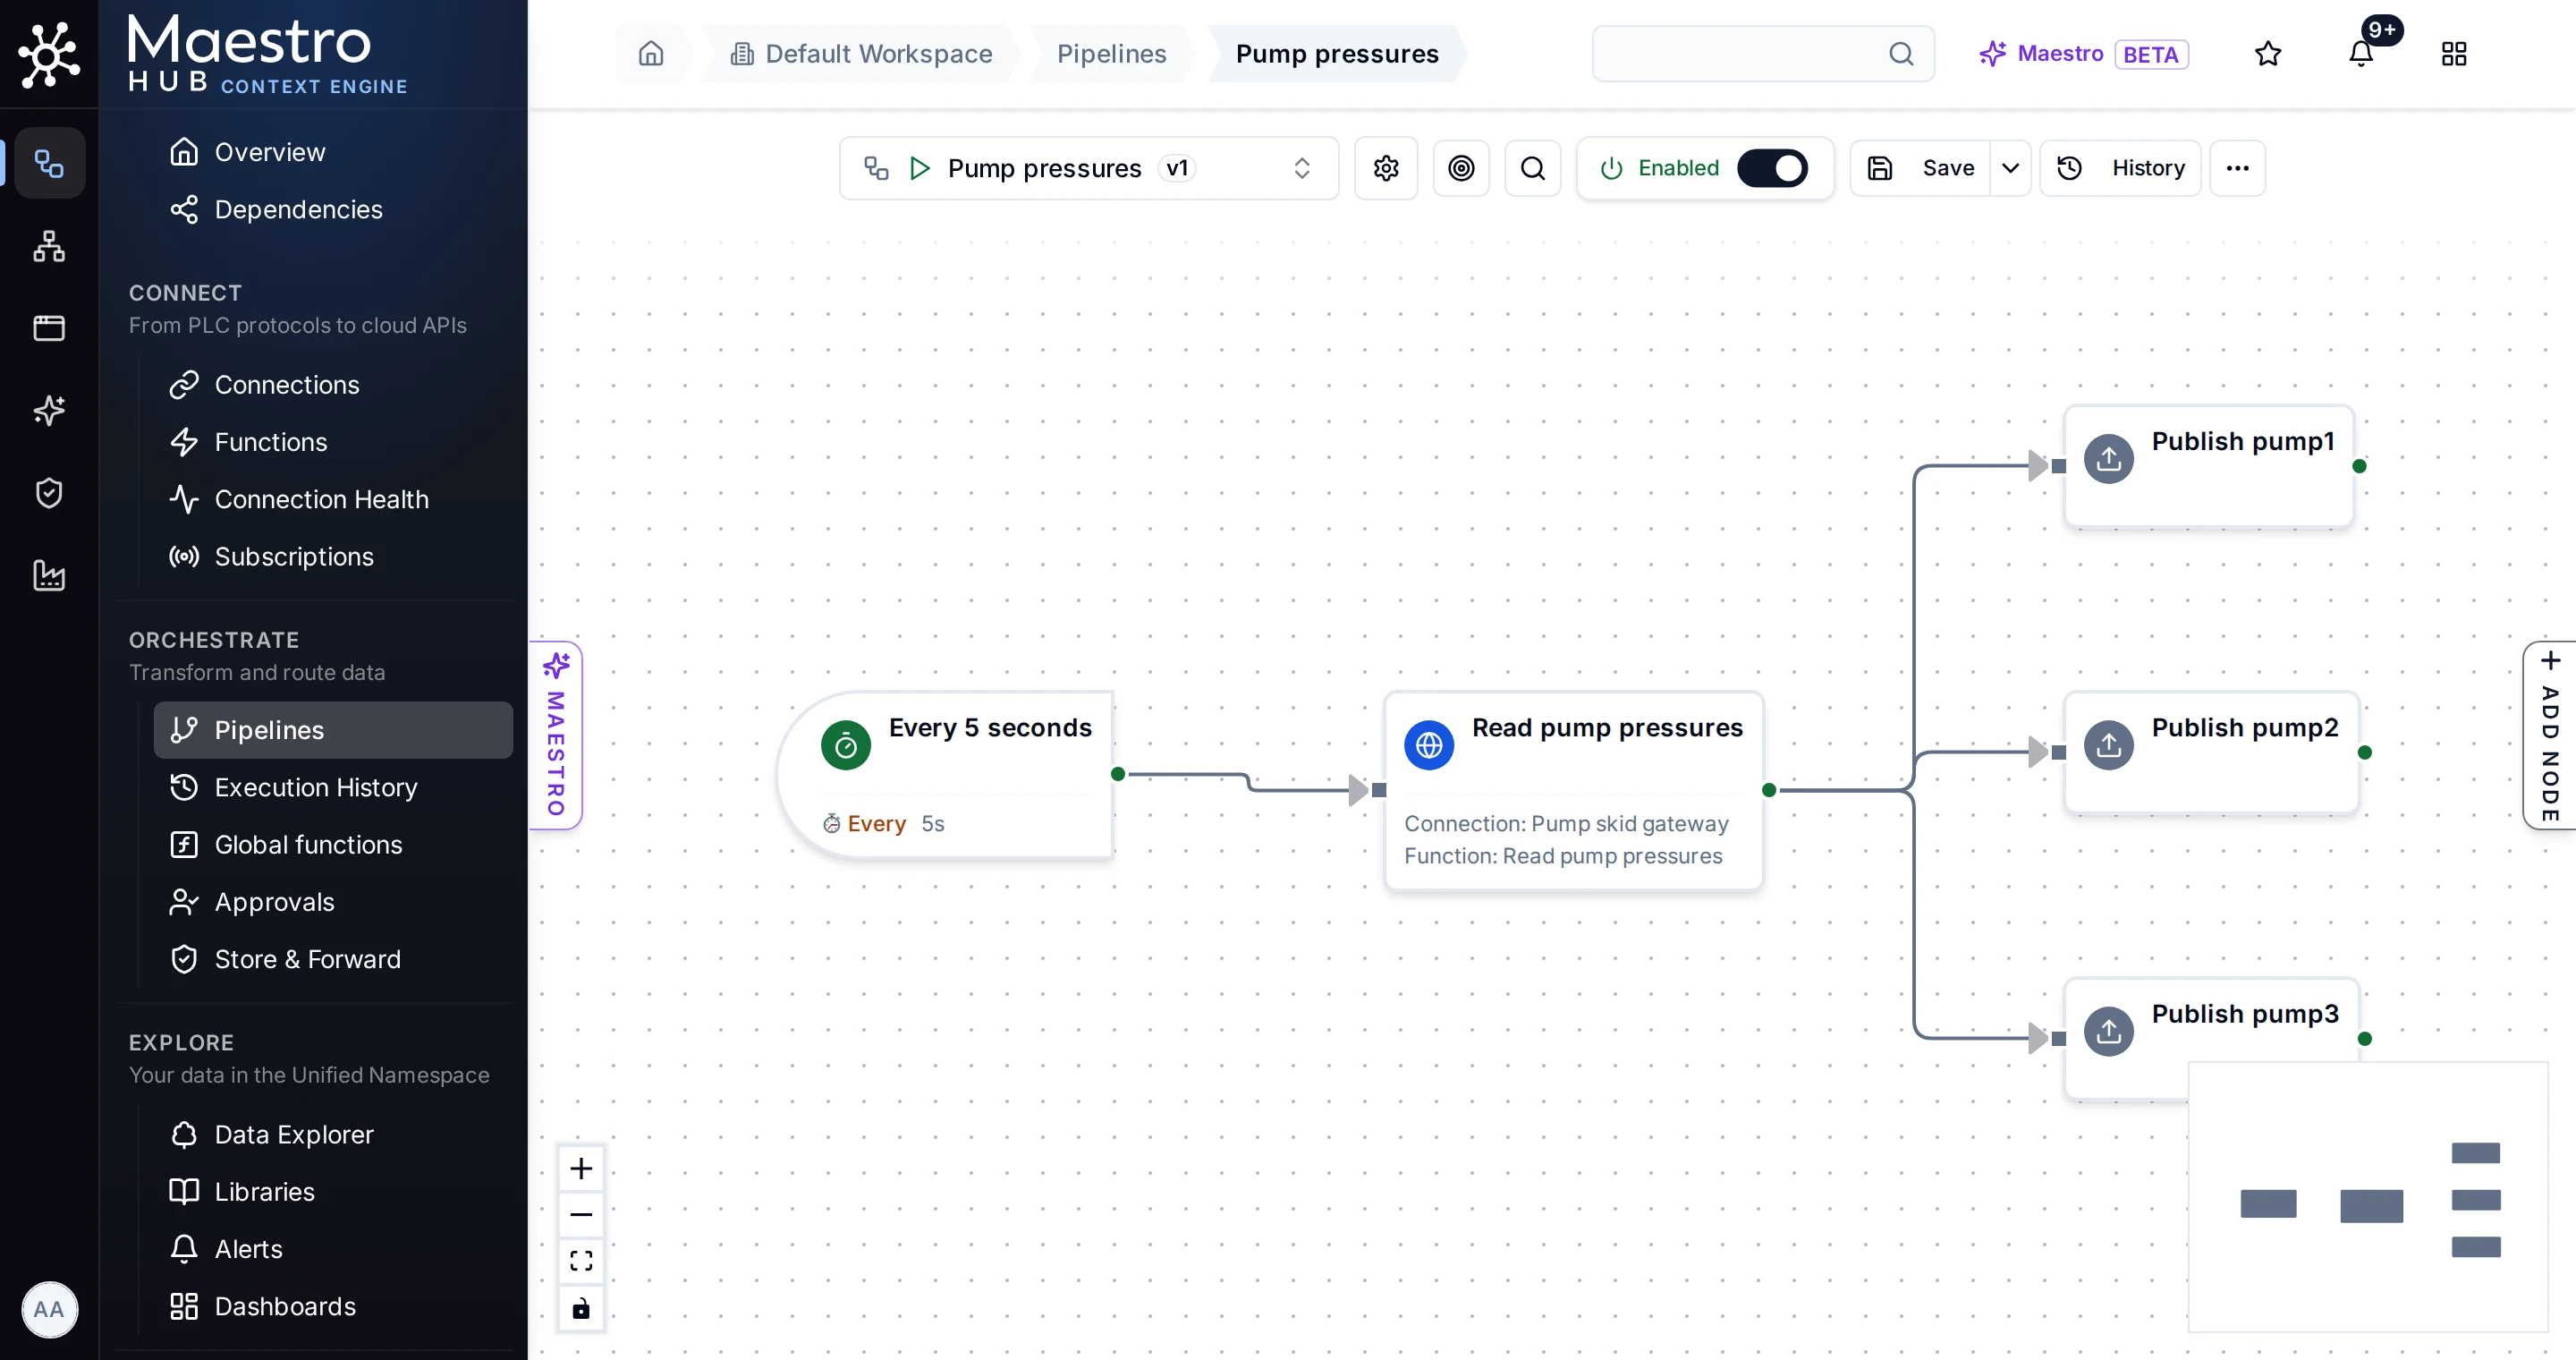
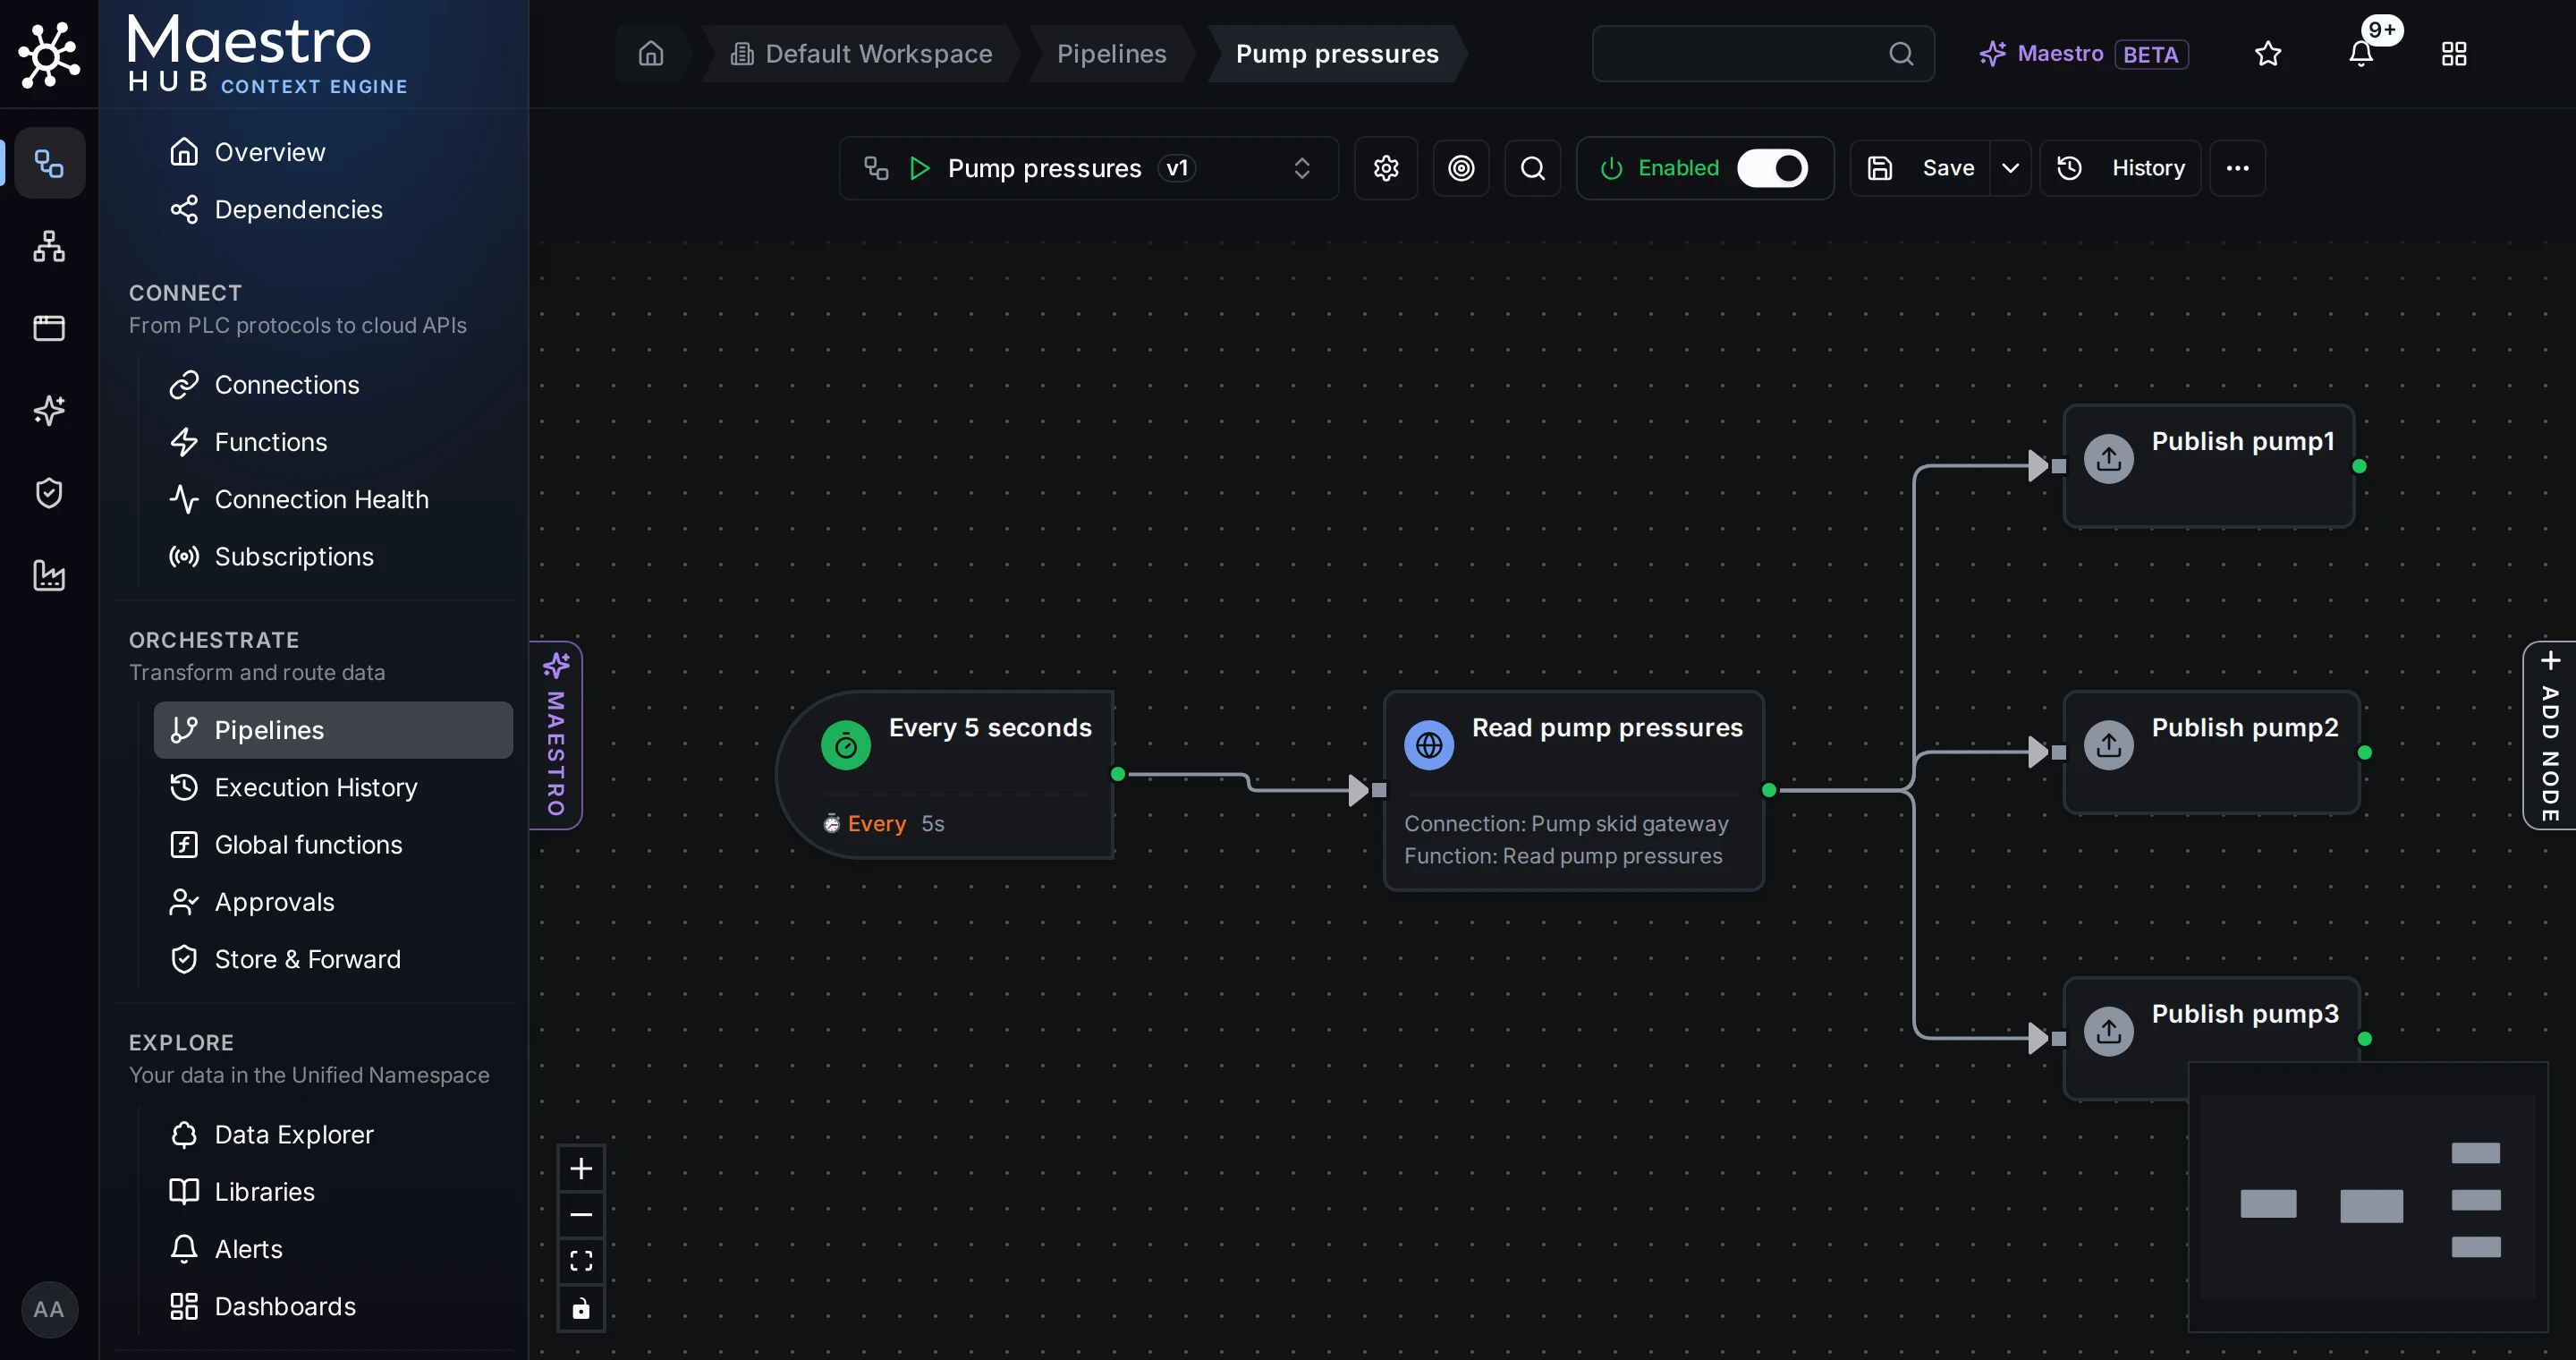
The example's pipeline: a schedule, one read from the connection, and a publish per pump.
Give it a few minutes, or better an hour, before Step 3: the alarm preview reads the topics' history.
A licence with the semantic layer. It is in Foundation and Enterprise, and in the free trial, which gives up to 100 topics a meaning (Your licence). This tutorial uses three.
Permission. Every member of the workspace reads its libraries, and the meanings of the topics they can read. Giving topics a meaning takes a Data Admin or a Workspace Admin, or someone who looks after that part of the topic tree (Who can do what).
Step 1: Start from your data
Open Explore › Libraries. A workspace that has no meanings yet opens on Start from your data; later, the same button sits in the page header. The workspace Overview leads there too: until the first topic has a meaning, its setup steps end with Give your data meaning, an optional step whose Start from your data opens the same page.
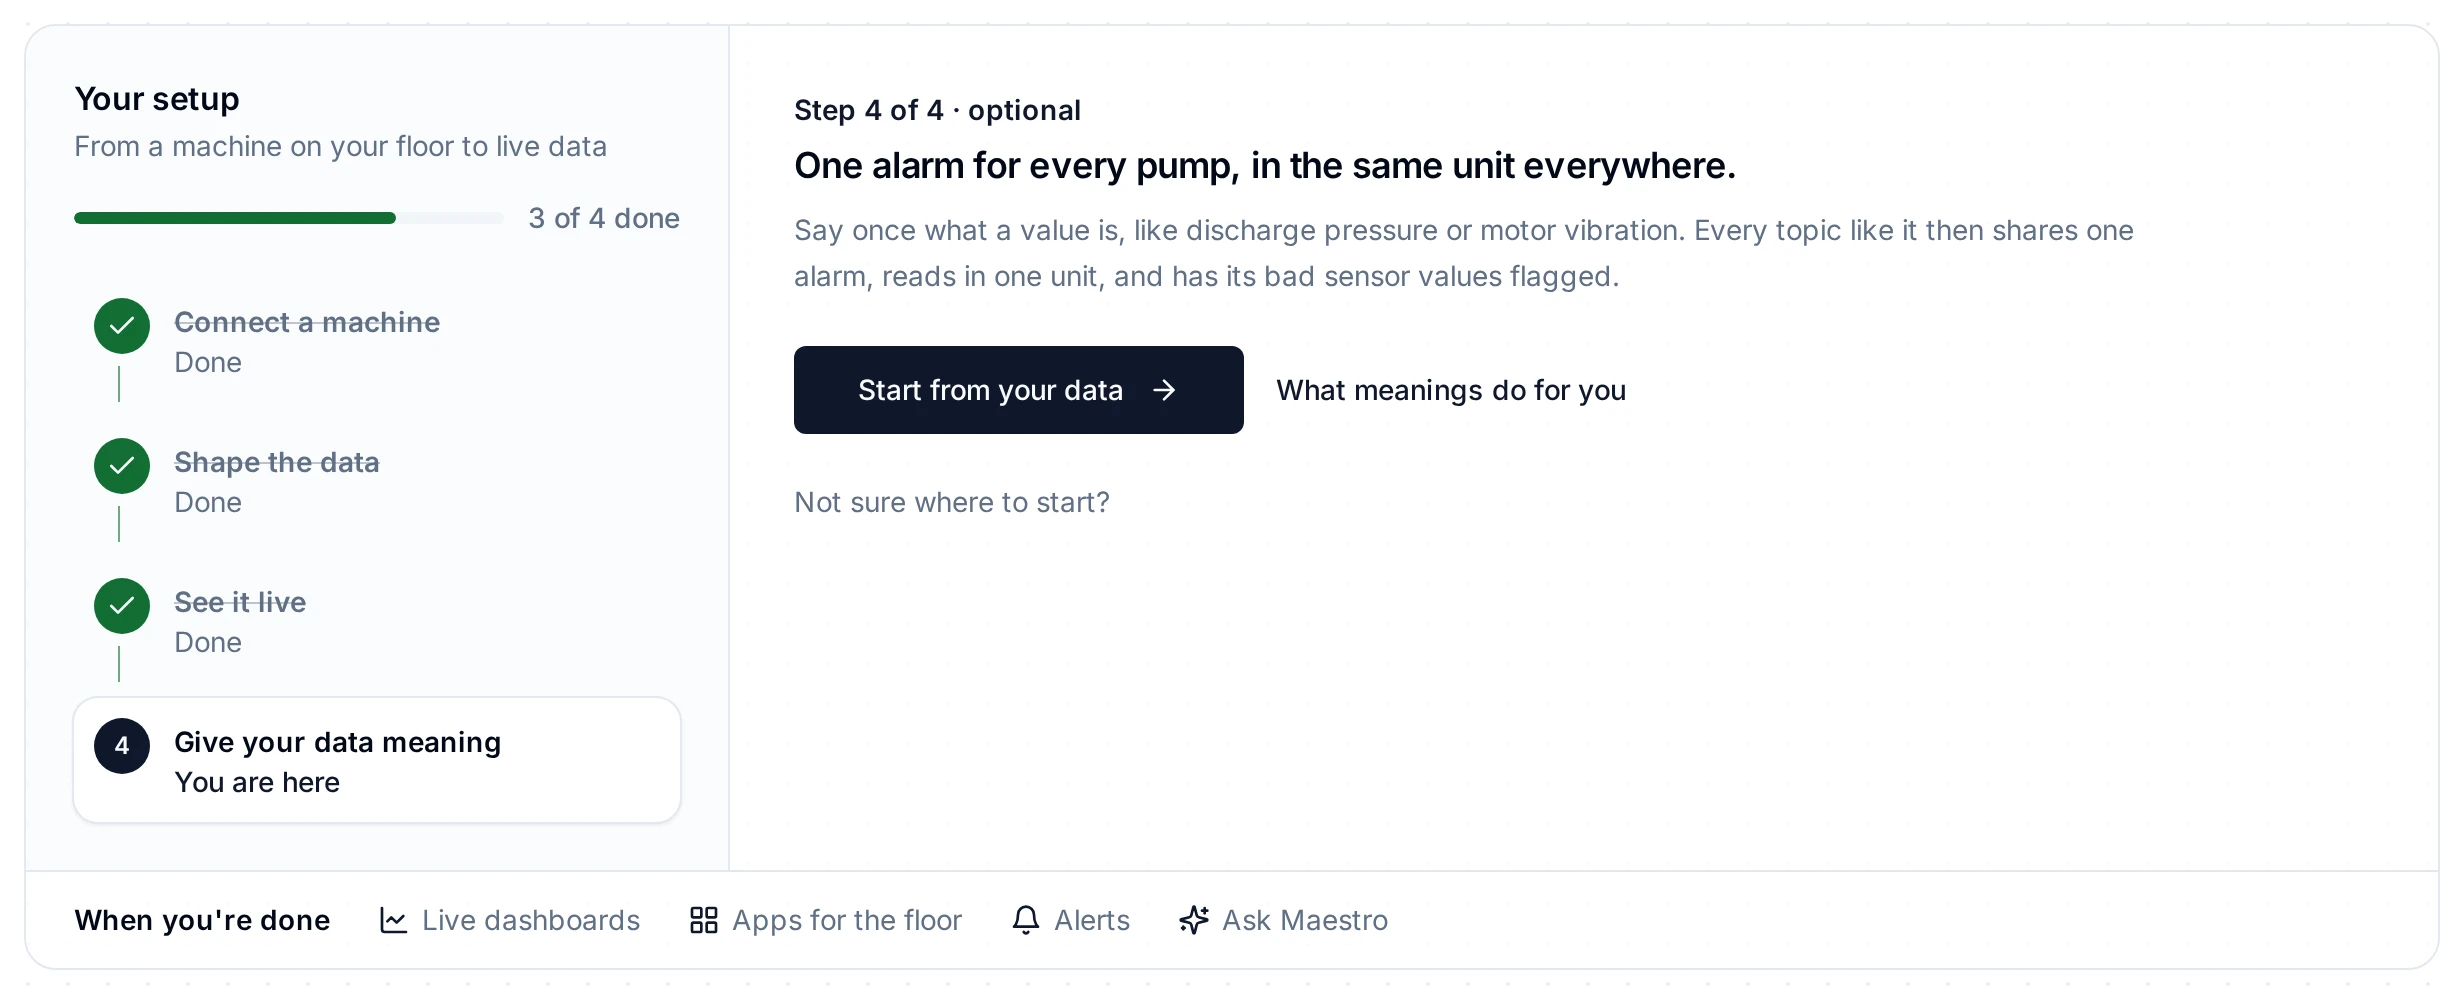
Once data arrives, the Overview offers the optional fourth step.
MaestroHub reads each topic once: its name, any unit it reports, and its recent values. Nothing is changed. Then it shows your plant as it reads it: "We recognised 45 of your 92 signals", each line a section and each machine a card with its live values.
- Answer what is left. A value that reports no unit is read in the only unit that is plausible for it when there is one ("read as °C: as °F it would read -15 to -11 °C, colder than any plant room a machine part sits in"). Only when both units are plausible is it asked about, once for its line ("Line 3 P301 and P302 send pressure as a bare number around 48. Which unit?"). Tap the unit you know, or Use the most likely units for these N to see each signal with its unit and why before anything is applied. You can also leave them for later.
- Check the cards. Each value shows what it will read as. Signals that fit nothing are folded under signals we left as they are, each with why.
- Use this gives every one of them its name and unit in one press, and Undo takes them all off again while you stay on the page. The next page offers an alarm for all similar machines, two lines on one scale, and the sensors that went quiet.
To choose rows one by one, or to give pumps a meaning of their own (below), click Review signal by signal, then Review on the Pressure group.
Answer the unit question
pump3 sends values around 62 with no unit. That fits psi (about 430 kPa) and also kPa as sent. MaestroHub will not pick for you:
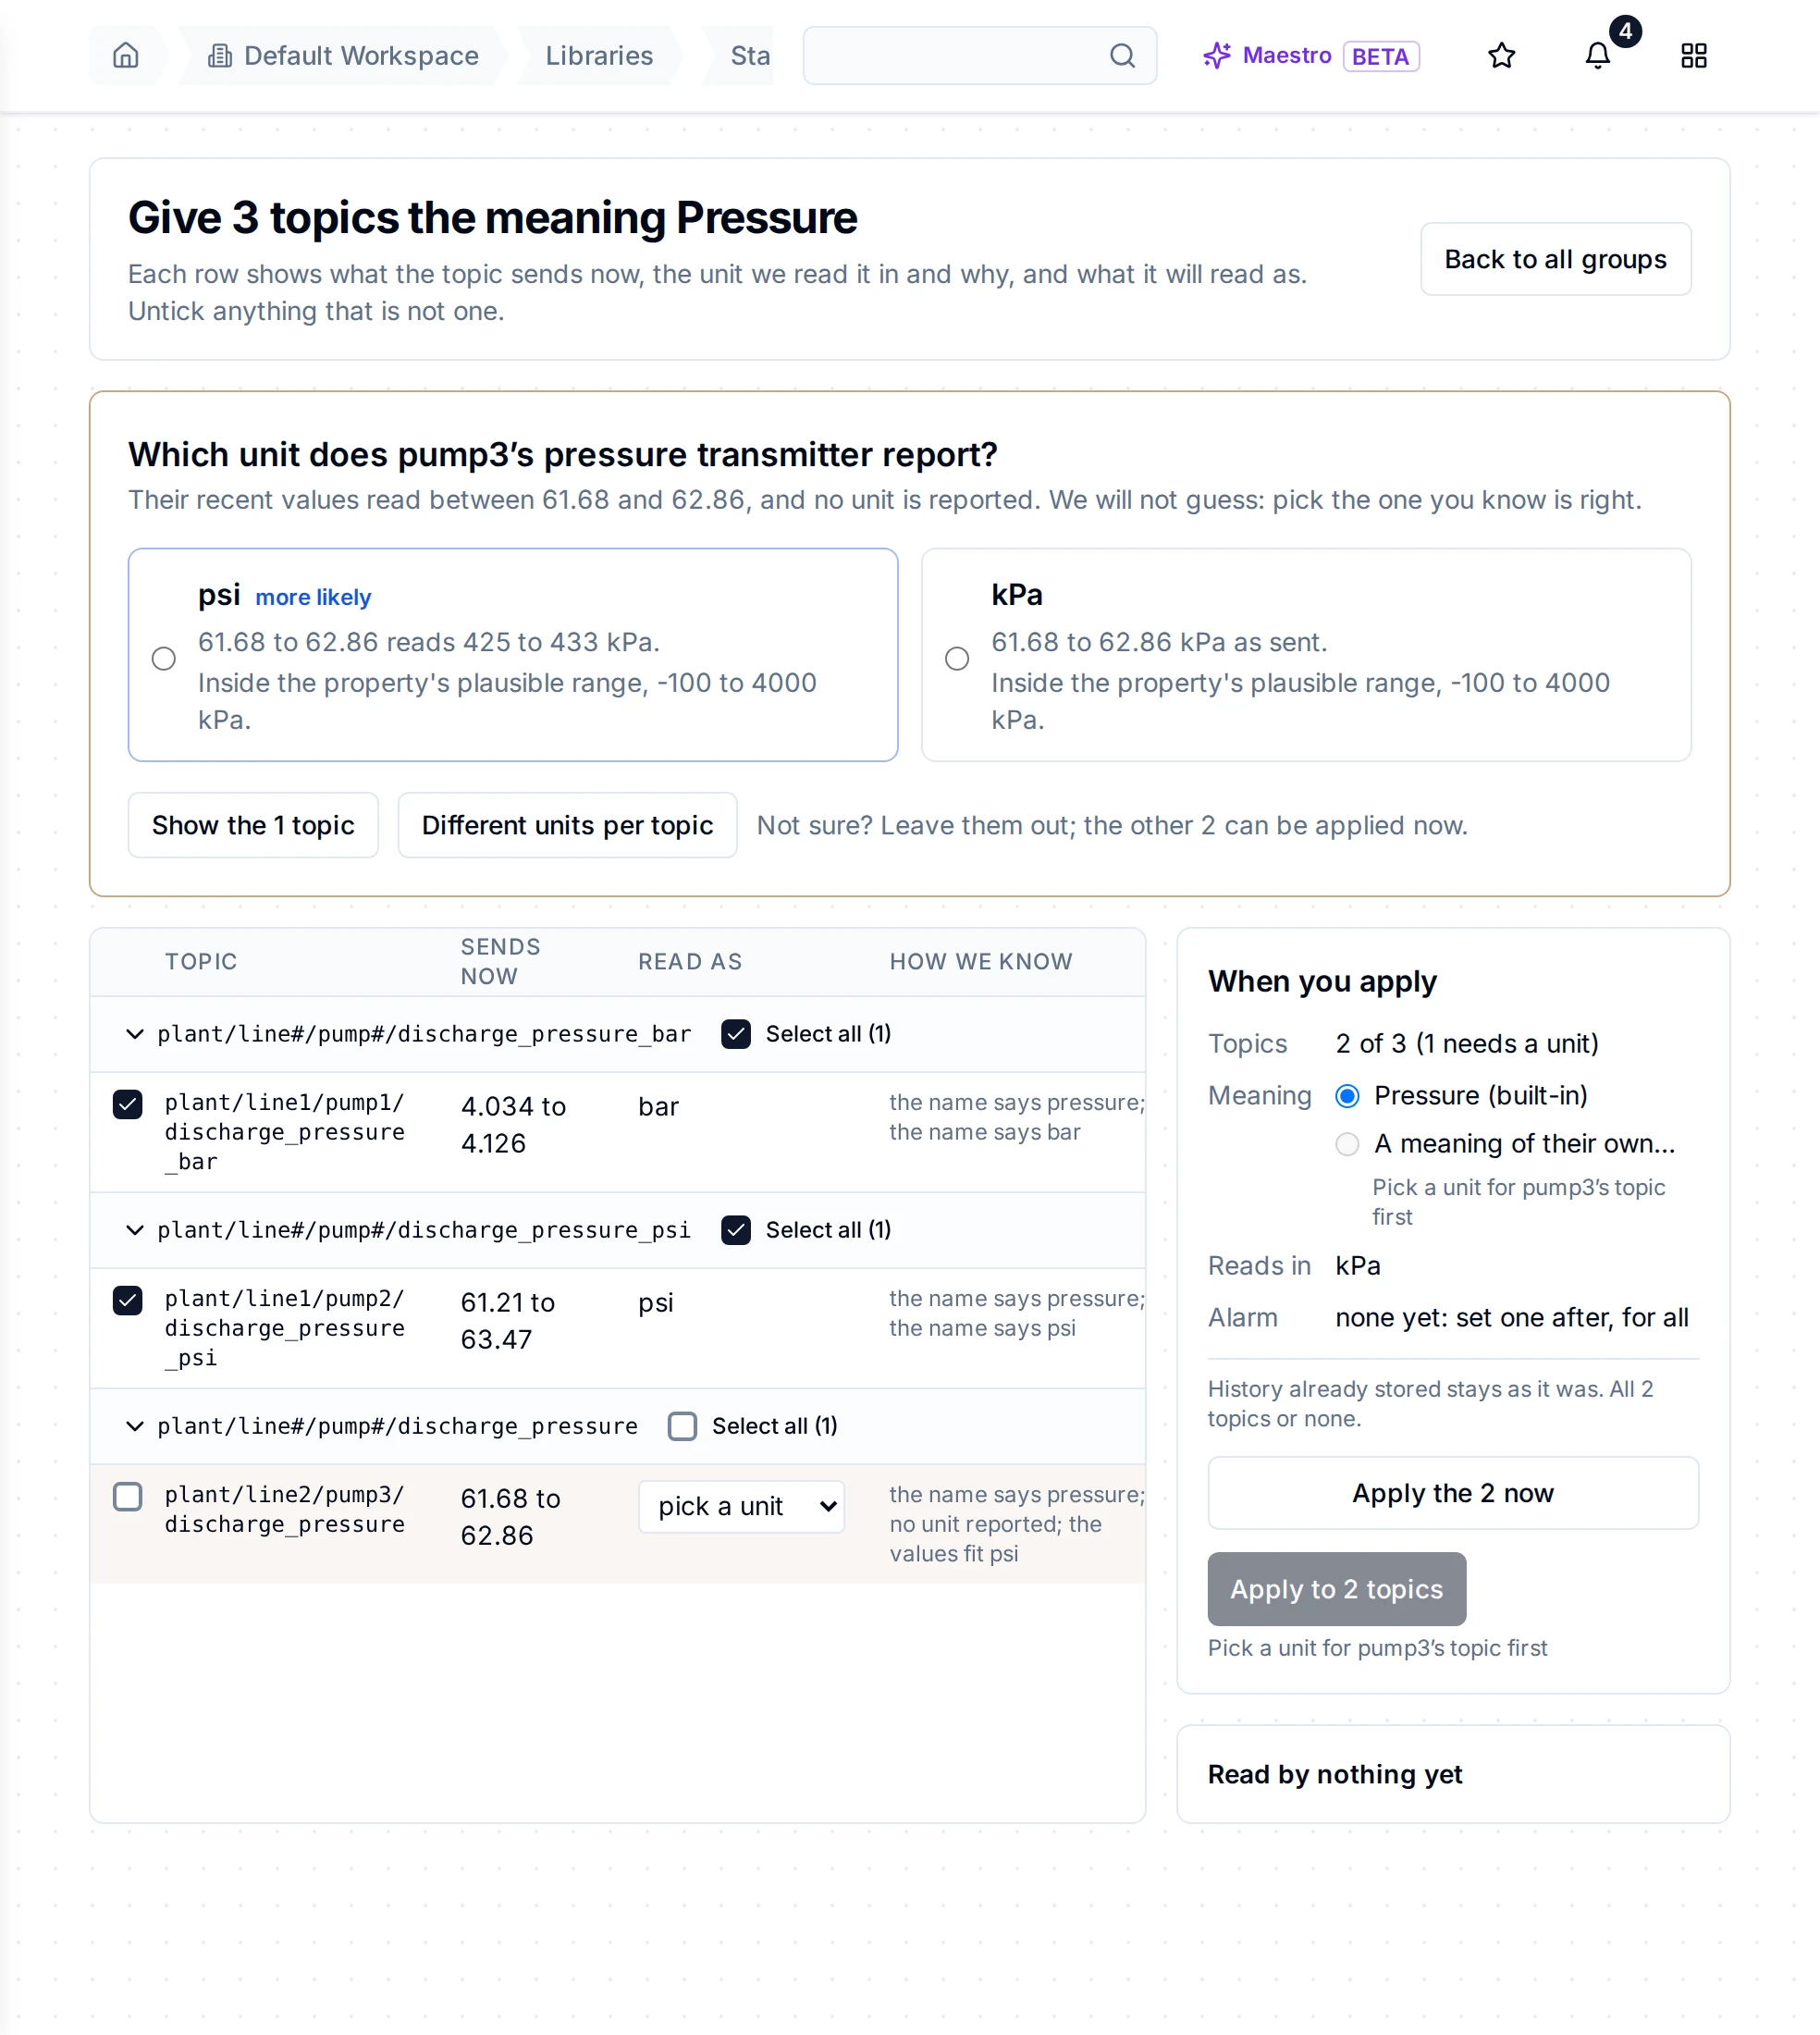
The question shows what the values would read as in each unit and whether that is plausible. You pick; nothing is applied until you do.
- Pick psi, the unit you know the transmitter sends. The page marks the option it finds more likely, but it never picks for you.
- Check the rows. Each says what the topic sends now, the unit it is read in and why. Untick anything that is not a pump's discharge pressure.
Not sure about one topic? Leave it unticked: Apply the 2 now gives the others their meaning and leaves it for later.
Give them a meaning of their own
Under When you apply, the meaning is Pressure (built-in). That works, but the built-in Pressure also covers boilers, compressors and headers, and a pump's alarm line should not reach them. Choose A meaning of their own… instead.
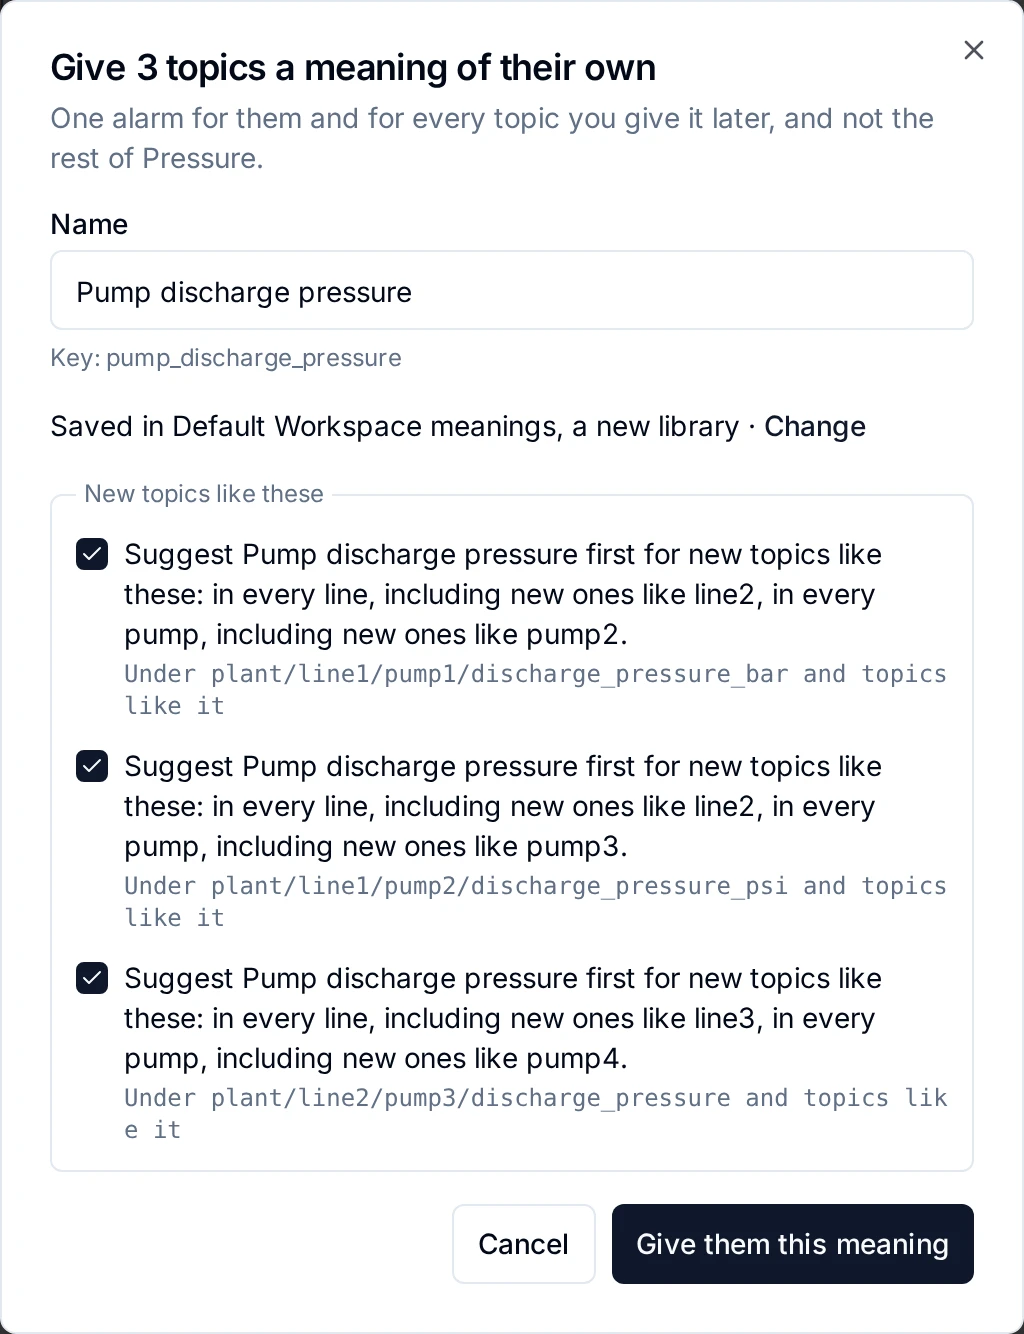
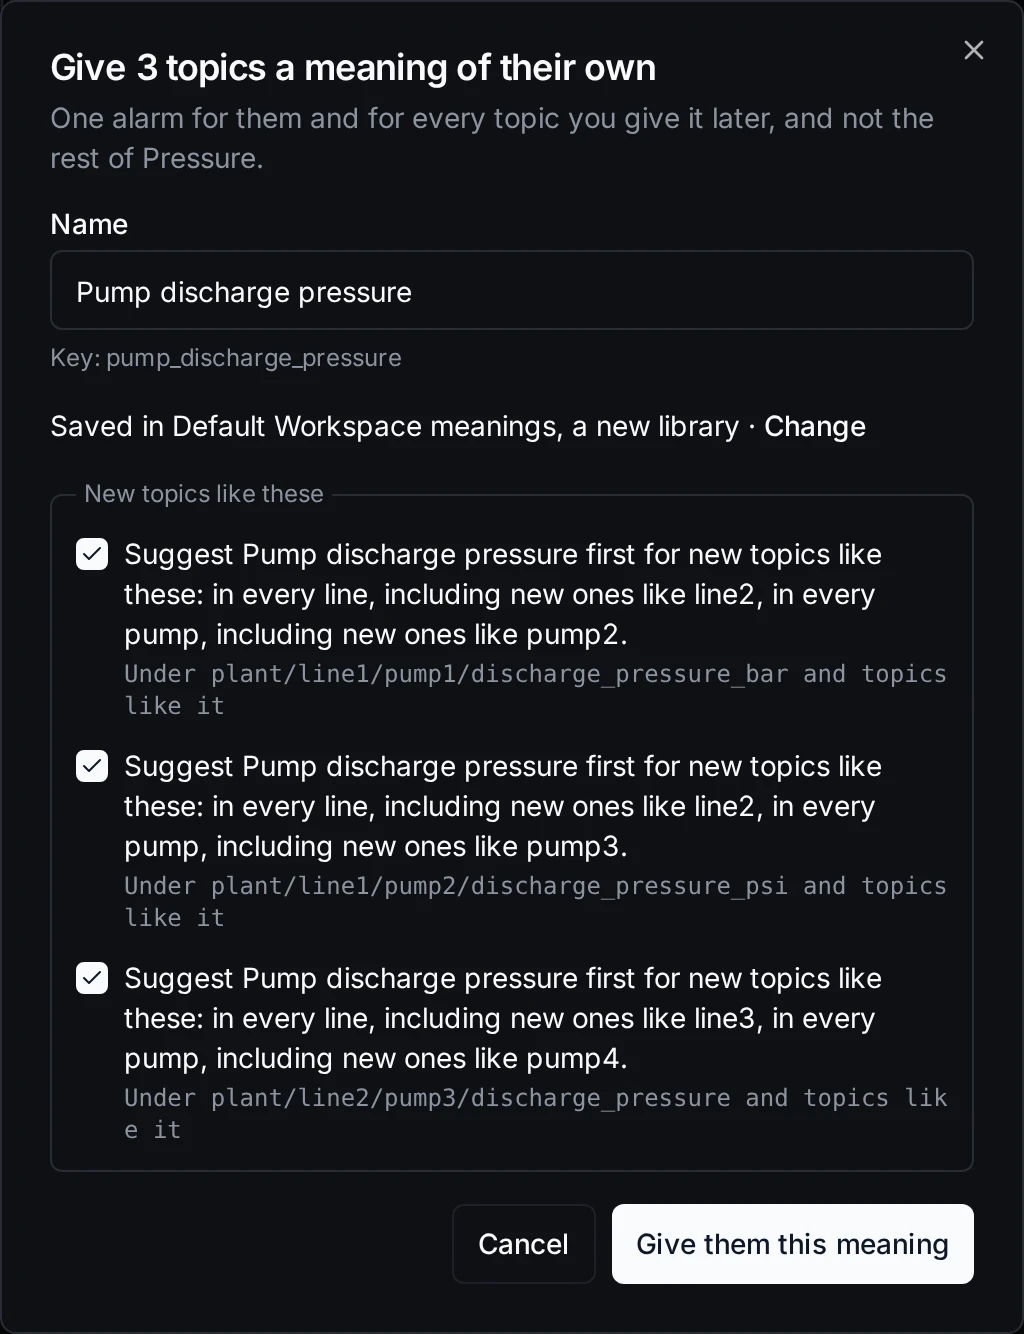
The name is proposed for you. Your own library is created on the way, and new pumps like these will be offered this meaning first.
- Keep the proposed name, Pump discharge pressure, or type your own.
- It is saved in your workspace's own library ("Default Workspace meanings, a new library"). Change picks another.
- Leave the Suggest Pump discharge pressure first for new topics like these boxes ticked: a pump4 added next month is offered this meaning first. Someone still applies it; nothing is given for you.
- Click Give them this meaning.
All three topics get their meaning in one change: all of them or none. If any pipeline, dashboard or app reads these topics, the page names them and asks you to confirm you have checked them first, because they will read kPa from now on.
Step 2: See the units become one
The page now shows what you got.
Two pumps that reported different units, on one kPa scale. Their older values are shown converted too.
"3 topics now read as Pump discharge pressure, in kPa. 2 reported psi and 1 reported bar." The chart puts the bar pump and the psi pump on one scale for the last hour: you can now see at a glance which pump runs higher. The chart is shown only right after an apply: if you reload the page, it says so, and keeps the count, a link to the meaning and the alarm card.
Open any of the pumps in Explore › Data Explorer. The topic page says what it means, its unit and the unit the device sends, and the live value is in kPa:
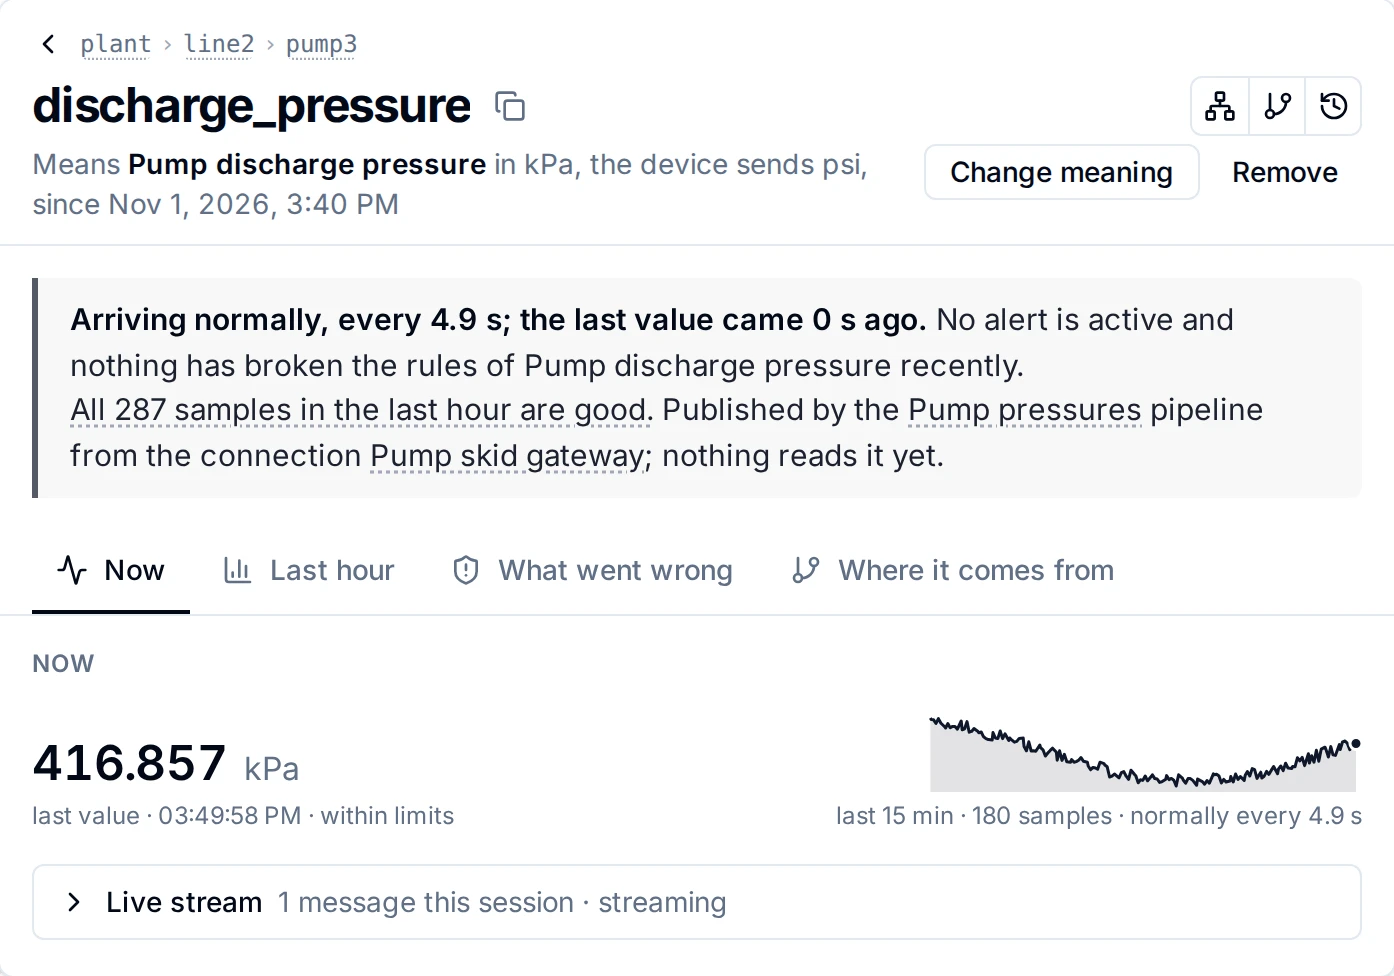
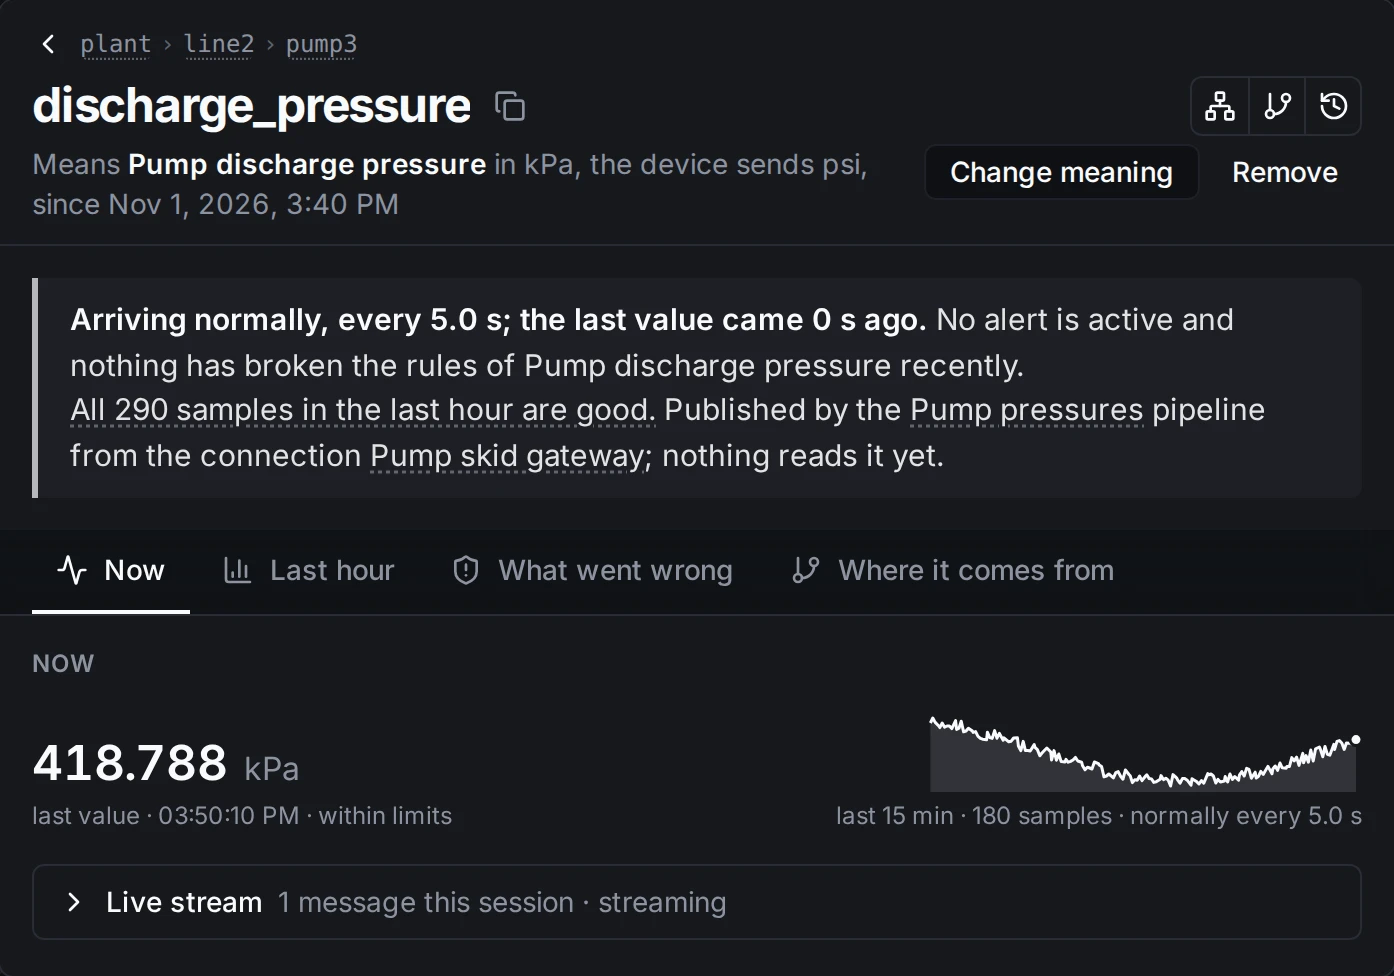
pump3 sends psi; everyone reading it sees kPa.
MQTT readers, dashboards and exports get kPa too. The device keeps sending psi; nothing on the device or in stored history changes.
Step 3: One alarm for all
Back on the result page, under One alarm for all 3, click Add the alarm.
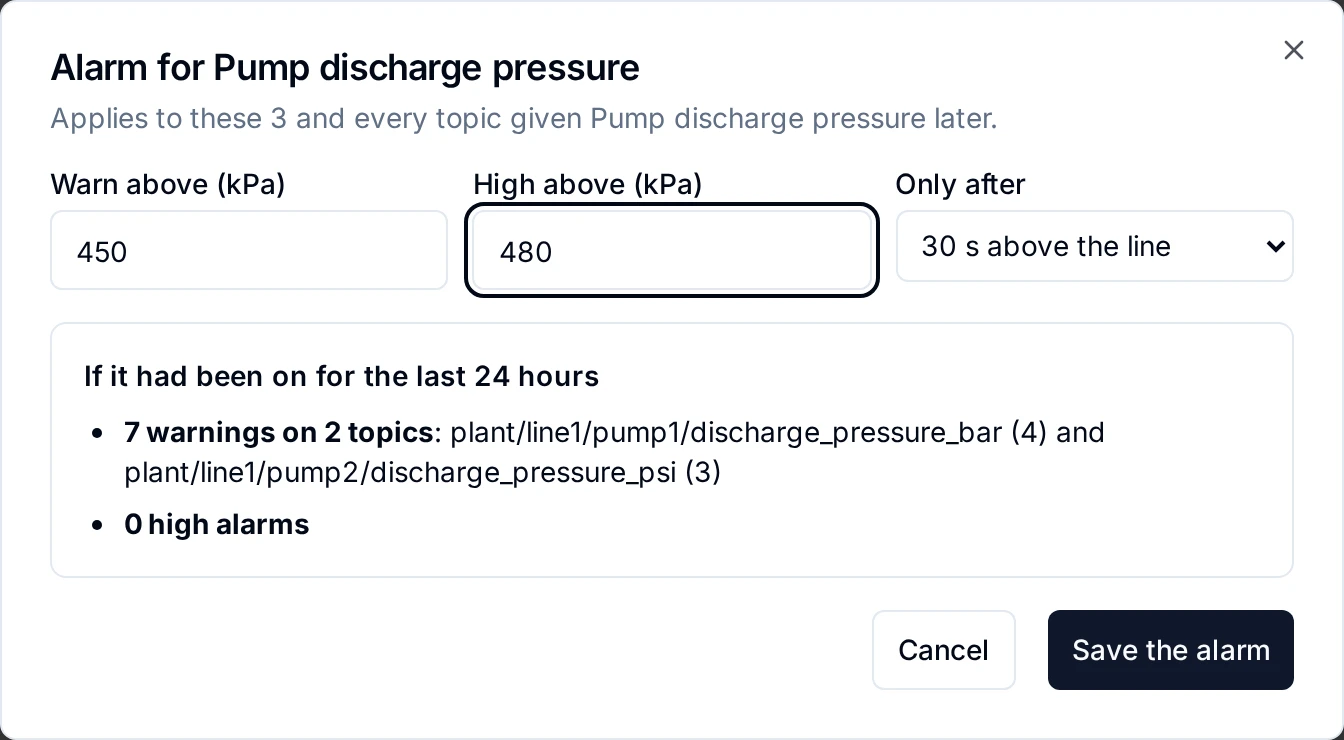
Before anything is saved, the preview says what these lines would have raised over the last day, and on which pumps.
- Warn above (kPa): type
450. - High above (kPa): type
480. - Only after: keep 30 s above the line, so a short blip does not raise anything.
- Read the preview, If it had been on for the last 24 hours. Here: 7 warnings on two pumps, no high alarms. Too noisy? Change a line and the preview follows.
- Click Save the alarm.
The limits are typed in kPa once, and they hold for the psi pumps and the bar pump alike. They belong to the meaning, so they apply to these three pumps and to every topic given Pump discharge pressure later. On the property they show as the warning and critical limits; Change the alarm opens them again.
When a pump crosses a line for longer than 30 seconds, it shows on Explore › Alerts:
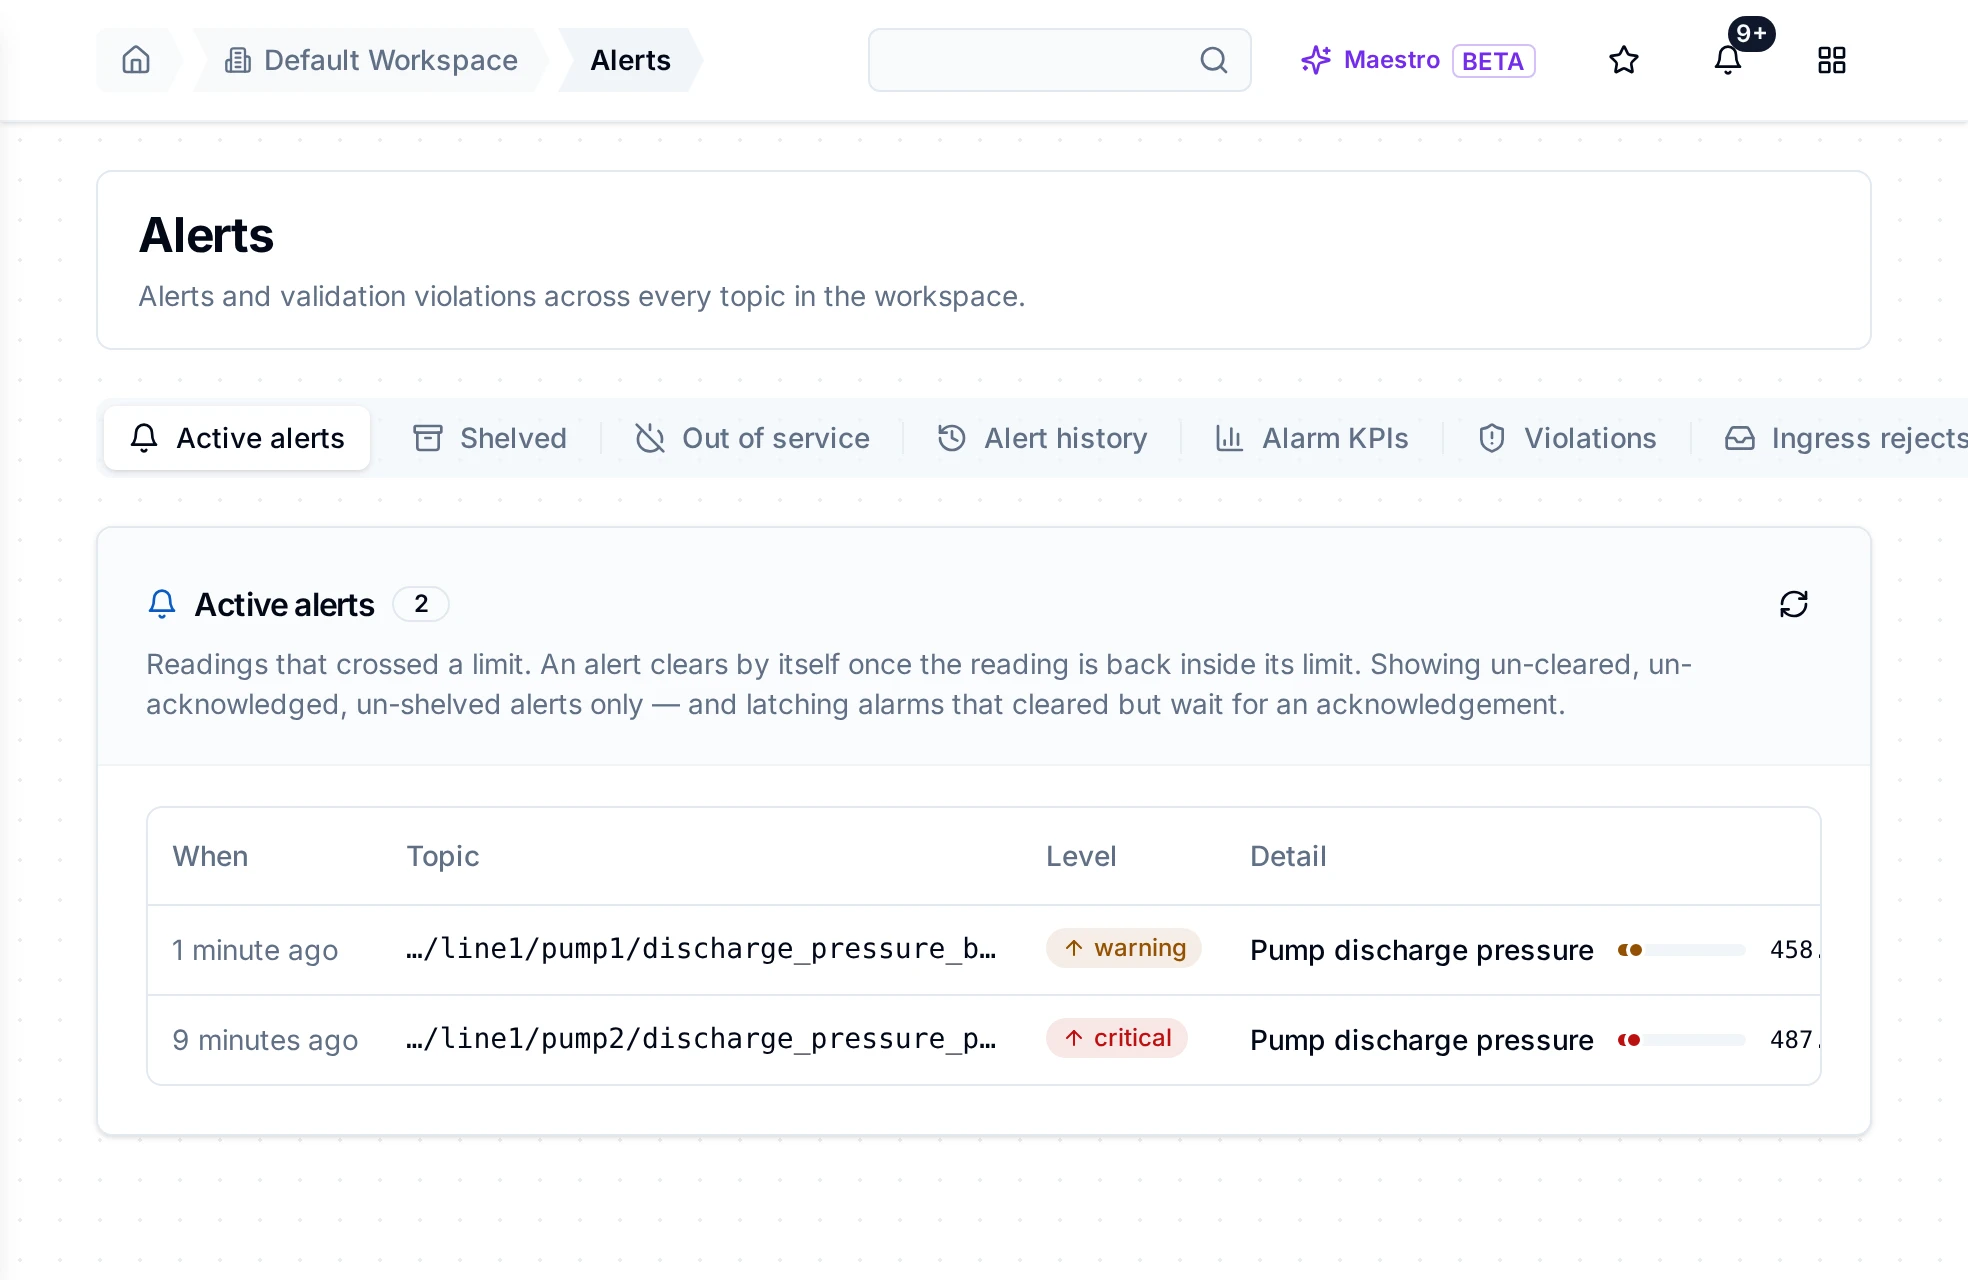
pump1 sends bar and pump2 sends psi; both are judged against the same lines, in kPa.
On each pump's topic page the chart now draws the two lines, labelled Warning and Critical, and its scale covers the values and both lines, so you see how close each pump runs to them.
Alerts covers acknowledging, shelving and sending alerts to other systems. Acknowledging and shelving need the alert:ack permission; without it the buttons are disabled and say so.
Step 4: Catch a stuck sensor
A transmitter that freezes keeps sending its last value. It looks healthy: values arrive on time, inside the limits. Tell the meaning how its values should behave, and MaestroHub notices.
- In Explore › Libraries, open Default Workspace meanings, then Pump discharge pressure.
- On Alarm and sampling, under Sampling, fill in:
- Expected period (ms):
5000, how often a value should arrive. - Staleness threshold (ms):
30000, how old a value may be when it arrives. - Frozen after (ms):
60000, how long a pump's pressure may stay exactly the same. It must be at least one minute and ten expected periods.
- Expected period (ms):
- Click Save alarm and sampling.
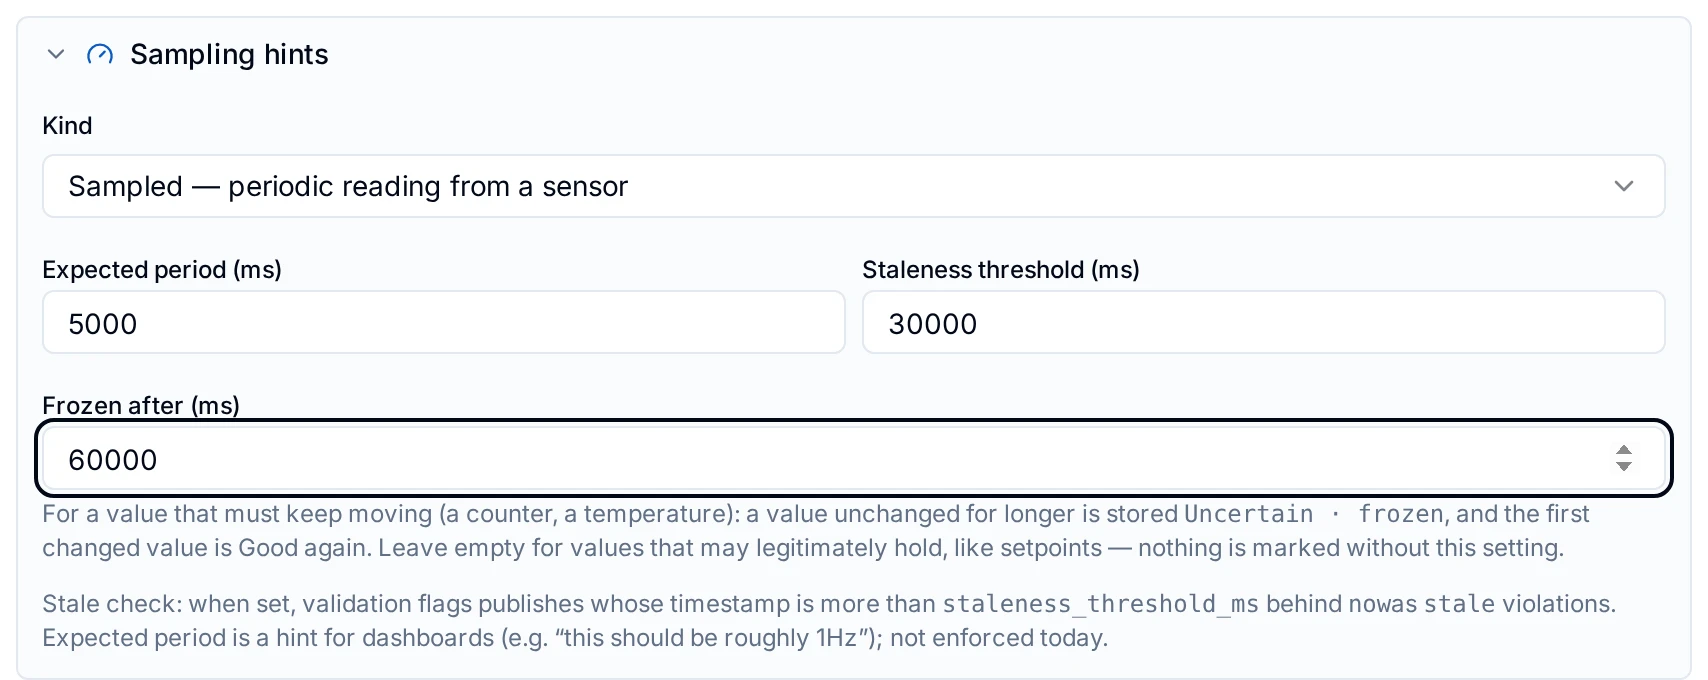
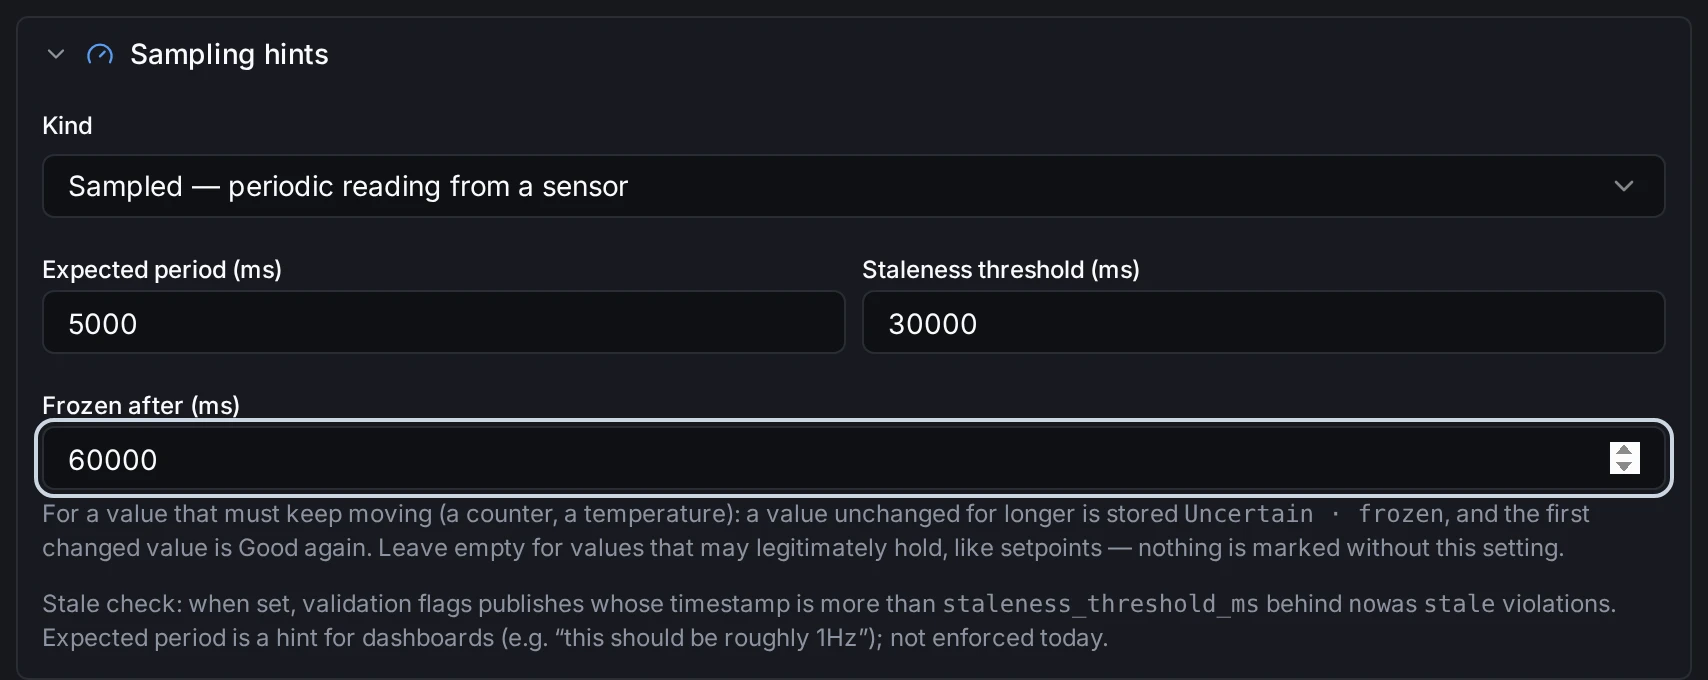
Set once on the meaning, these apply to every pump that has it.
When pump3's sensor sticks, its topic says so:
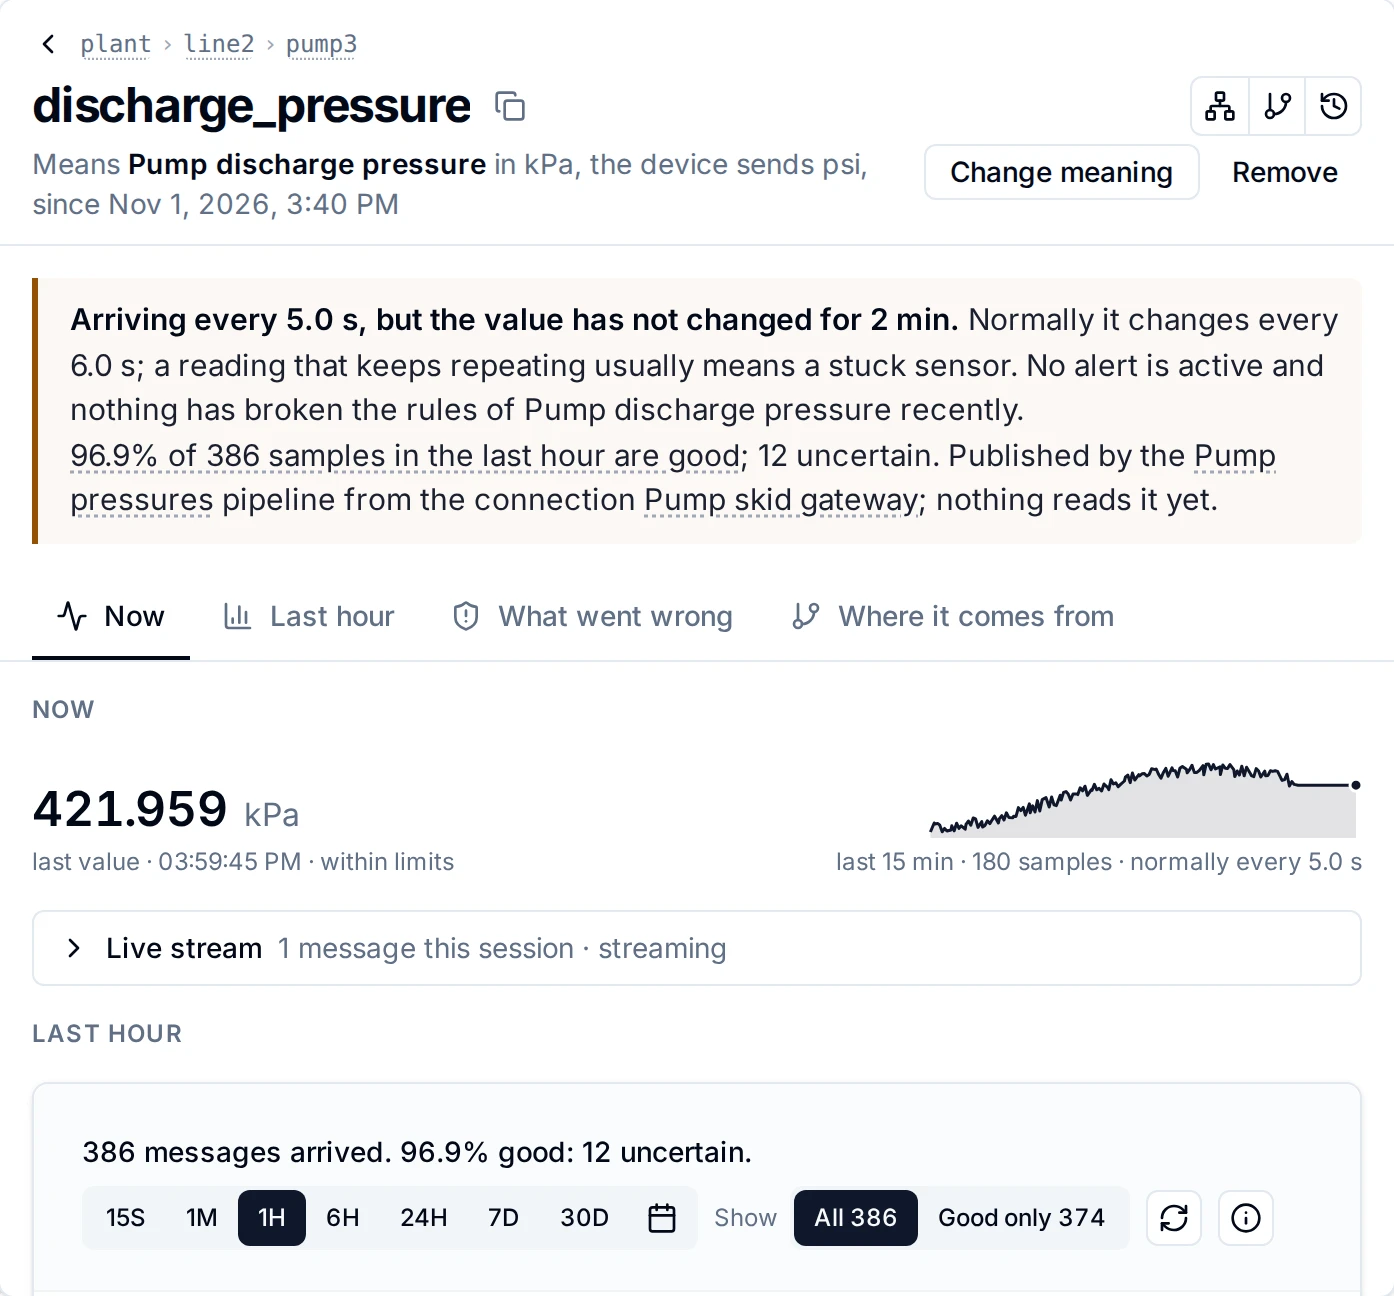
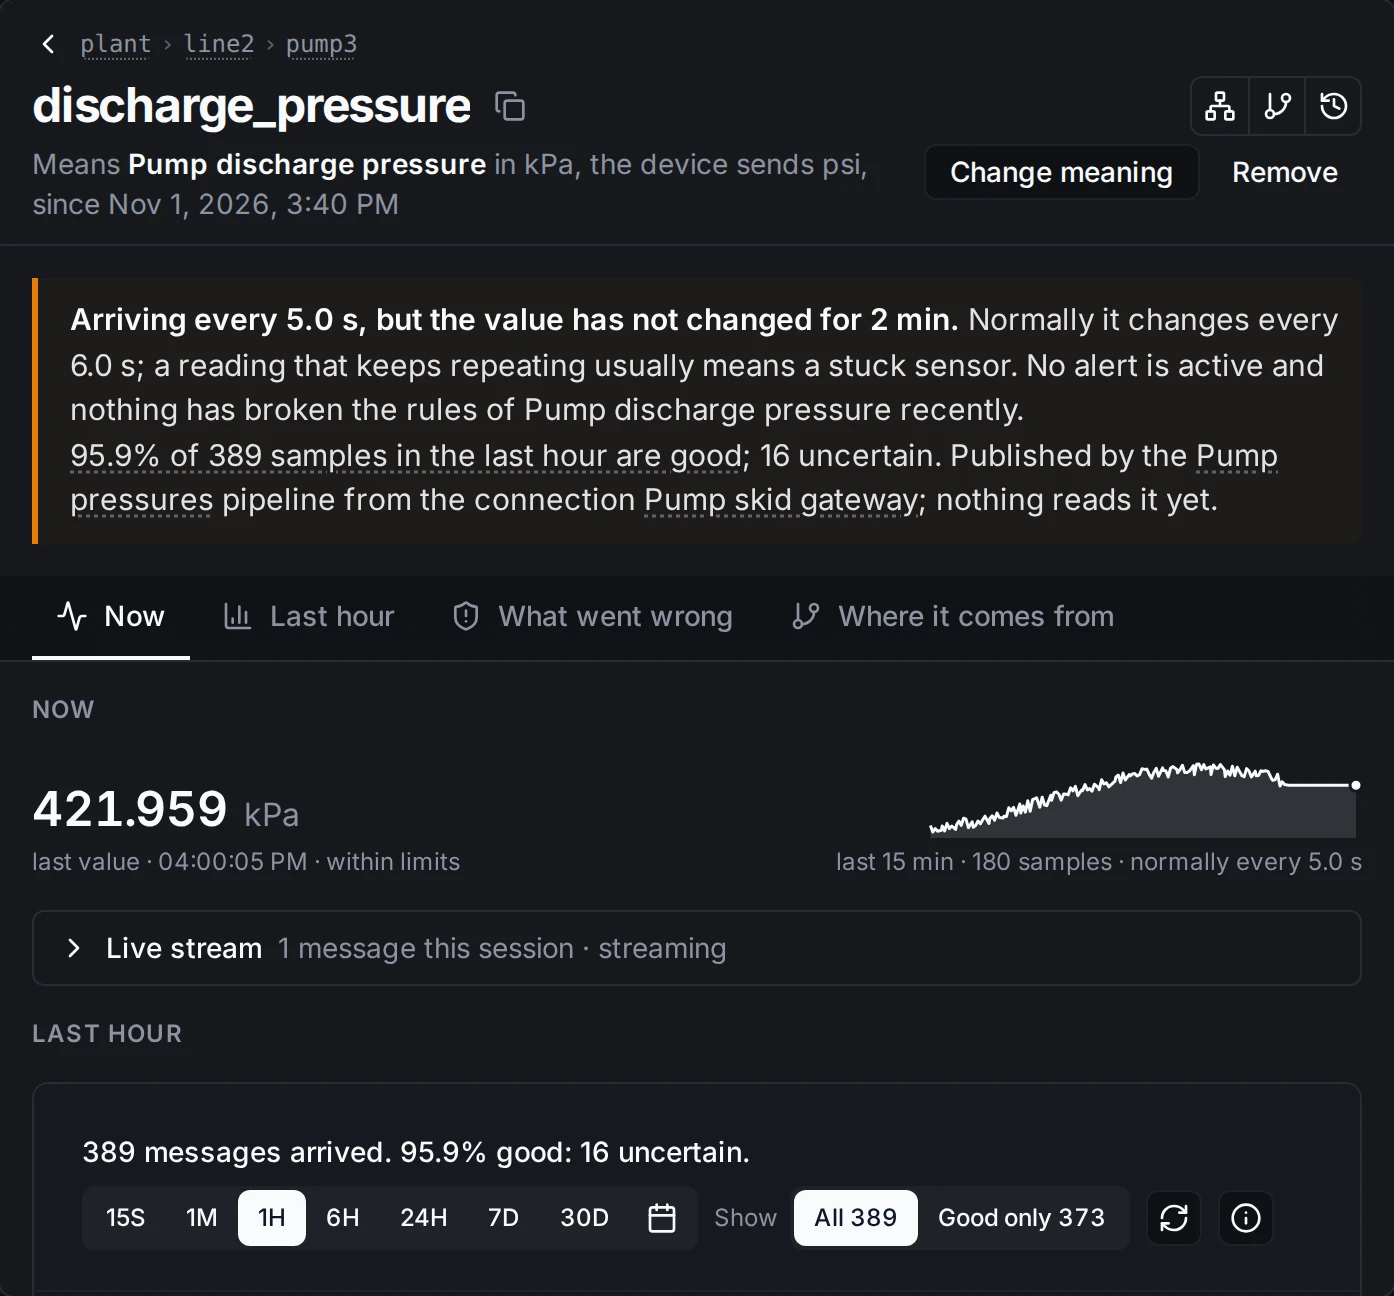
Values still arrive on time, so nothing looks wrong at first glance. The meaning knows a pump's pressure keeps moving.
- Frozen. Values unchanged for longer than Frozen after are stored as Uncertain · frozen, the topic page explains it in plain words, and Data Explorer's header counts it ("1 value is frozen"). The first value that moves again is good again.
- No data. When a topic with a meaning stays quiet well past its expected period, it is reported as Not receiving data: nothing sent, and the topic reads Silent at the same moment. The topic page names the cause when it is upstream: connection "Pump skid gateway" is failing, with the connection's error, or a pipeline whose last runs failed. It clears by itself when data arrives (When a meaning gets no data).
Neither one rewrites or refuses a value. Leave Frozen after empty on meanings whose values may legitimately hold still, such as a setpoint.
Step 5 (optional): Strict mode
By default a value that breaks its meaning's rules is stored and recorded as a violation, and the writer is told. To stop such values at the door instead:
- In Explore › Data Explorer, right click the branch, here
plant, and choose Validation rule…. - Choose Enforce: "A record that breaks its rules is rejected with the reason."
- Optionally tick Lock it, so no topic below can be less strict.
- Click Save.
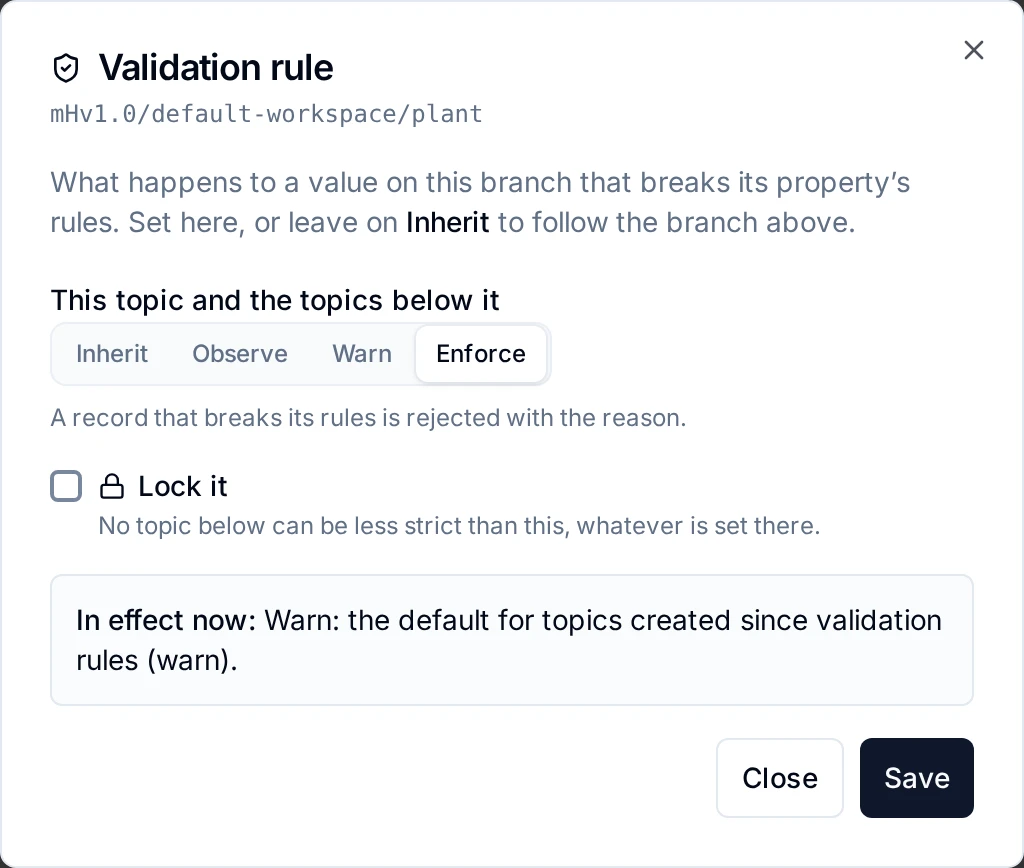
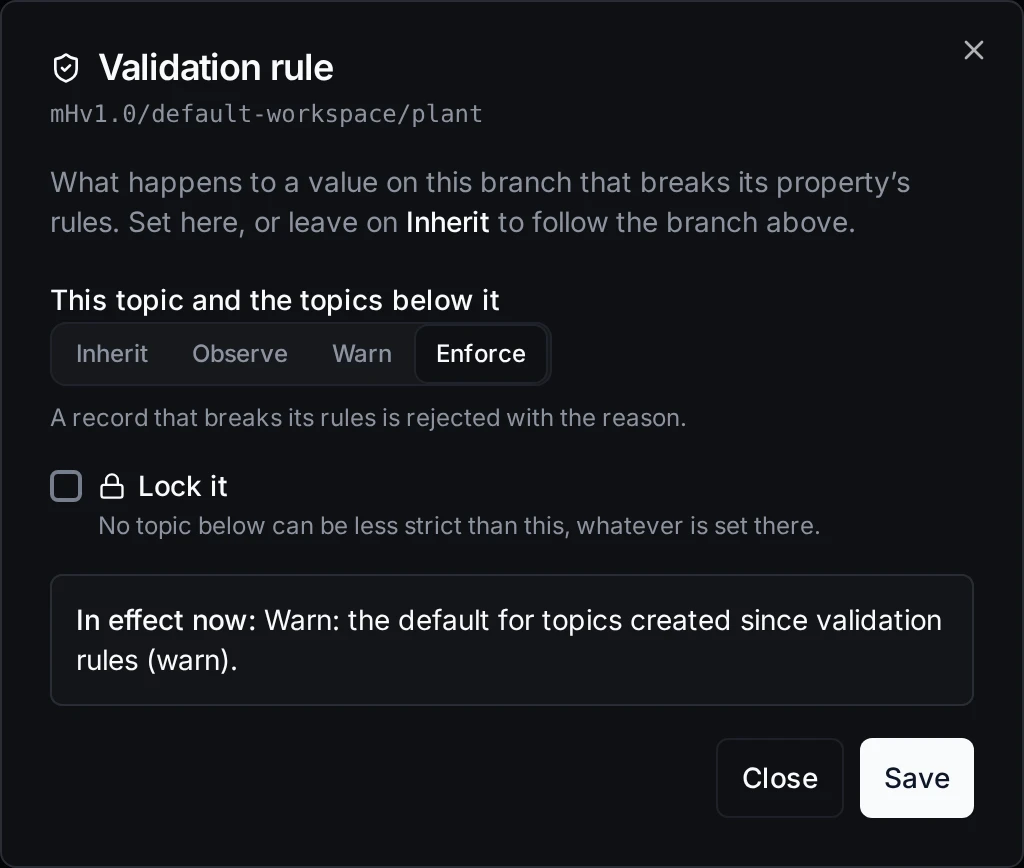
Enforce on the plant branch: every topic below it rejects a record that breaks its meaning's rules.
The writer is told why its record was rejected. Start with Warn on a new branch, look at Explore › Alerts › Violations for a while, then switch to Enforce once only real faults show up. The modes are explained in Validation rules on the topic tree.
What else meanings give you
You just used most of it. In the product, What meanings do for you (in the Libraries header) shows the same five outcomes, each with a button to the screen that does it. In one list:
- One alarm for similar equipment. Set the lines once on the meaning; every topic with it, today's and next month's, is watched the same way (one alarm for all, Alerts).
- Same units everywhere. Every value arrives in the meaning's unit, in charts, alarms, MQTT and exports, whatever the device sends (What changes when you save).
- Catch bad sensors. Frozen, silent and out of range values are flagged on every topic with the meaning (Alarm and sampling, When a meaning gets no data).
- Clean data downstream. Values that break the rules are marked, or refused with Enforce, before they reach pipelines, dashboards and apps (Validation rules on the topic tree).
- Find data by what it is. Open a meaning of your own in Libraries, such as Pump discharge pressure: its Topics tab lists every topic you can see that holds it, whatever each tag is called, grouped by how it is named. Built-in meanings such as Pressure have no Topics tab yet (One measurement, many tag names).
Next
- Your own library. Pump discharge pressure lives in your workspace's own library, as a draft. Add properties for the rest of your equipment, or import a library file (Libraries).
- Publish a version. Publishing fixes the library's definitions for good, so every value stored under them keeps one meaning; alarms and sampling stay editable (Publishing a version).
- One topic at a time. On any topic page, Give this topic a meaning does the same for a single topic, with suggestions (Giving a topic a meaning).
Who can do what
- Every member of the workspace reads its libraries, and the meanings of the topics they can read. A deny rule on a library or a topic still wins.
- Giving topics a meaning takes a Data Admin or a Workspace Admin, or someone who looks after that part of the topic tree. Someone who may give meanings but not approve them sends them for approval instead.
- Changing a library (properties, alarms, sampling) takes a Data Admin, a Workspace Admin or the library's owner.
- Validation rules take the policy permission or looking after that branch; locking one takes a Data Admin or a Workspace Admin.
A control you may not use is shown disabled and says what it needs. The full tables are in Libraries and Giving a topic a meaning.