Alerts
The Alerts page is where MaestroHub surfaces two related but distinct signals about your UNS data:
- Alerts answer "is the machine in trouble?" — a value crossed a warn or critical threshold defined on a schema.
- Violations answer "is the data broken?" — a publish failed schema validation (wrong type, out of range, stale, unit mismatch).
Both are produced automatically once a topic is bound to a schema. No separate alert rules are required — the thresholds live on the schema and apply to every topic bound to it.
Three checks, two surfaces. Rejected publishes and degraded-quality data show up under Violations ("is the data broken?"). Threshold crossings show up under Alerts ("is the machine in trouble?").
Alerts vs violations
Alerts and violations come from the same schema on the same publish, but they are produced by two independent steps that run in order: validation first (which produces violations), then alert evaluation (which produces alerts). A gate connects the two:
- A rejected publish never fires an alert. A type mismatch — or any violation when the binding is in strict mode — rejects the publish before it is stored, so alert evaluation is skipped. The publish surfaces only as a violation.
- A soft violation can produce both. A value outside the schema's hard min/max is stored with degraded quality (a range violation) and, since warn/critical thresholds sit inside that range, the same value also crosses a threshold and fires an alert. One publish appears on both tabs.
- Most alerts have no violation. A perfectly valid value that simply crossed a warn/critical threshold produces an alert and no violation — the common case.
Using the CNC temperature example (hard range 0–120 °C, warn 70, crit 85):
| Published value | Result | Violation | Alert |
|---|---|---|---|
"ERR" (text) | Type mismatch → rejected, not stored | Yes | No |
75 | Valid, above warning threshold | No | Yes (warning) |
92 | Valid, above critical threshold | No | Yes (critical) |
130 (outside hard range) | Range violation → stored with degraded quality | Yes | Yes (critical) |
26 | Healthy | No | No |
The two feeds are stored and queried separately and appear as distinct tabs both on a topic in Data Explorer and on the org-wide Alerts page. See Schemas › Enforcement at publish time for where each outcome originates.
Defining thresholds
Alert thresholds are configured per attribute on a schema, on the Definition tab of the schema editor. Only numeric attributes with a unit can carry them.
| Setting | Meaning |
|---|---|
| Warning min / max | Soft bounds. A value past these (but inside critical) raises a warning alert. |
| Critical min / max | Wider soft bounds. A value past these raises a critical alert. |
| Deadband | Hysteresis that prevents flapping (see below). |
| Message | An operator-facing remediation hint, copied onto every alert this threshold produces. |
Thresholds may be one-sided (only a max, only a min) or two-sided. If both a warning and a critical threshold apply to the same value, critical wins.
Min/Max bounds vs alert thresholds. A schema's min/max are hard bounds — anything outside is a range violation. Warn/critical thresholds are soft bounds inside the valid range — crossing one fires an alert but the data is still valid and stored.
How an alert fires — the deadband state machine
Every numeric publish to a bound topic runs through an alert state machine. An alert has a level (none, warning, critical) and a direction (low or high). It moves between levels on two kinds of edge:
- Fire edge — the value crosses a threshold by the deadband. With
warn_max = 70anddeadband = 2, the warning fires when the value reaches 72, not 70. - Clear edge — the value moves back past the threshold by the deadband. To clear that same warning, the value must drop to 68, not just back to 70.
Between those points the alert holds its state and emits nothing. This deadband anti-flapping is what stops a value bouncing around a threshold (69, 71, 70, 72…) from producing an alert storm. Set the deadband to 0 to fire immediately on any crossing.
An alert fires once per incident and clears once per recovery. Repeats at the same level produce no new event.
The How alerts work dialog on the Alerts page includes a live deadband simulator that mirrors this exact logic — useful for choosing a deadband value before you commit it to a schema.
The Alerts page
Open UNS › Alerts. The page presents tabs over the same org-wide feed:
- Active — alerts that are currently open: not yet cleared and not yet acknowledged. This is the operator's working list.
- History — the full fire/clear trail, including cleared and acknowledged alerts, for pattern review.
- Violations — the data-integrity feed: rejected publishes and degraded-quality records.
Each alert row shows when it fired, its level (warning/critical) and direction (high ↑ / low ↓), the threshold and the value that breached it, the unit, how many times it has fired, its state (active/cleared), and the remediation message from the schema.
Alerts are scoped per topic (and per attribute, level, and direction). The same schema bound to a hundred topics produces a hundred independent alert states — one machine can be in warning while the rest are healthy.
Acknowledging and clearing
Acknowledging an alert marks it as seen — you are aware and handling it. It is different from clearing, which happens automatically when the value returns to normal. An alert can be active (not cleared) yet acknowledged.
If an acknowledged alert re-fires — the value crosses the threshold again after recovering — the acknowledgement is reset, because it is a new incident. A previous dismissal never silences a fresh problem.
Worked example: alerting on a CNC temperature topic
This walks the whole loop on one real topic — define a schema, bind it, watch an alert fire, then trigger both kinds of violation — using a CNC machine's temperature reading.
1. The schema. A value schema named cnc.temperature: a float64 in Celsius (Cel), hard range 0–120, warning at 70, critical at 85, deadband 2. It is authored once in the Schemas registry and can be reused across every CNC.
2. The binding. Bind it to the topic …/OP10-CNC/energy/temperature with strict mode off (see Schemas › Binding a schema to a topic). Every publish to that topic is now validated and alert-checked.
3. An alert fires. A reading of 92 °C is published. It is a valid number inside the 0–120 range, so it is stored — but it crosses the 85 °C critical threshold, so a critical alert fires.
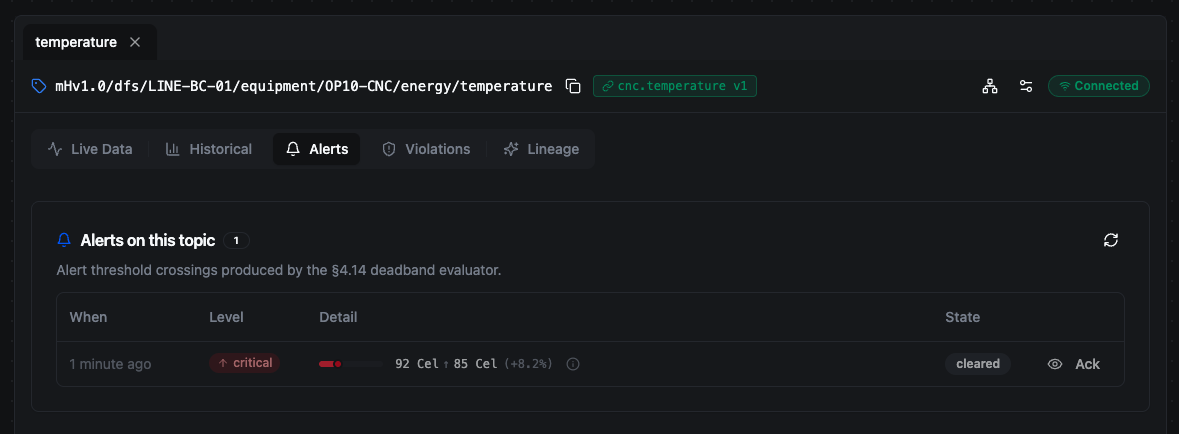
92 °C crossed the 85 °C critical threshold. The state is cleared — the live machine returned to normal moments later, which cleared the alert automatically.
Notice the state is cleared, not active: the live machine is healthy, so the next real reading (~26 °C) arrived moments later and dropped below the threshold by the deadband margin, clearing the alert automatically. It now lives in the Alerts history rather than the active list.
4. A type violation. A bad reading of "ERR" (text) is published. It is not a number, so it fails type validation and is rejected outright — nothing is stored and no alert fires. It appears on the Violations feed as a type violation, with the action rejected.
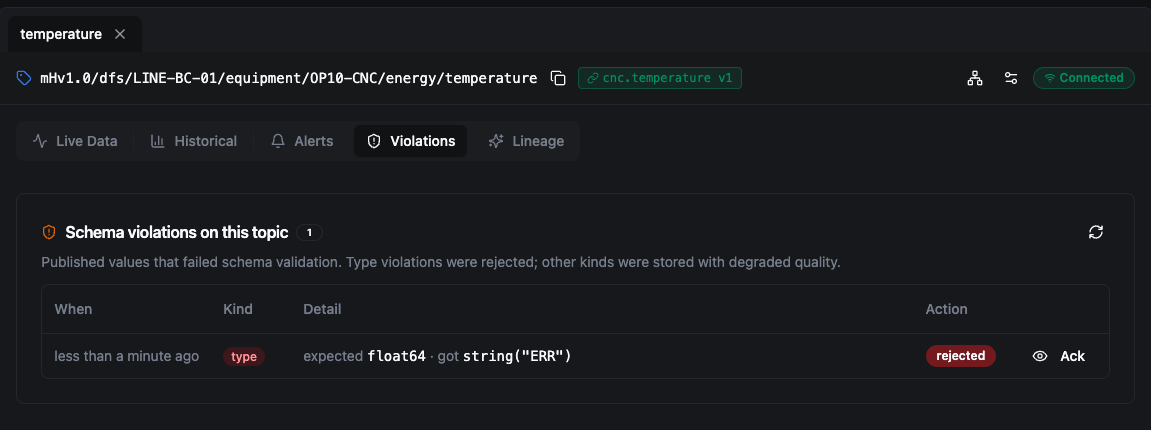
Publishing text where a number is expected is a type violation — rejected outright, nothing stored, no alert.
5. A range violation. A reading of 130 °C is published. It is a number, so it is not rejected — but it is outside the hard 0–120 range, so it is stored with degraded quality and recorded as a range violation. Because 130 also crosses the 85 °C threshold, the same publish also re-fires the critical alert (the ×2 on the row is the second time this incident has opened).
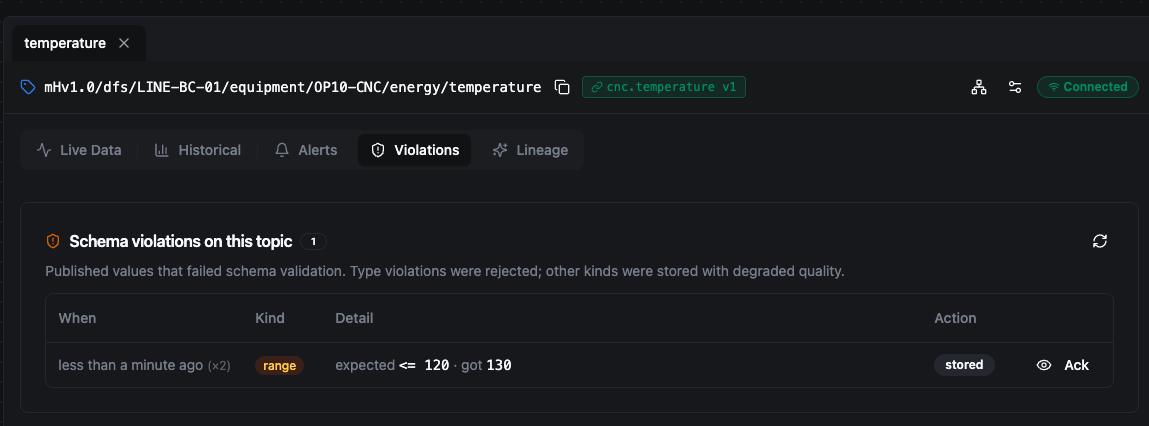
130 °C is a valid number but outside the hard range — stored with degraded quality (not rejected). It also re-fires the alert, so this one publish lands on both feeds.
Common questions
Why did 92 °C raise an alert but no violation?
Because 92 is a valid value — the right type, and inside the schema's hard range (0–120). Violations are about the data being broken; 92 is fine data that happens to be operationally high. Min/max are hard bounds (outside → violation); warn/critical are soft bounds inside the range (crossed → alert). 92 stayed inside the range but crossed the threshold, so: alert, no violation. A reading of 130 does both — see step 5.
Why is the alert in the history but not in the Active list? Because it cleared. The Active list shows only alerts that are neither cleared nor acknowledged. When the value returned to normal (by the deadband margin), the alert cleared automatically and dropped out of Active — but it stays in the history with its full fire/clear trail. Clearing is automatic (the condition resolved) and is not the same as acknowledging.
What does the Ack button do? Acknowledging marks the row as seen — "I'm aware, I'm handling it." It removes the row from the Active list (Active = not cleared and not acknowledged) but keeps it in the history with an ack'd badge. It does not change the underlying value or fix anything. If the same alert or violation recurs, the acknowledgement is reset and the row becomes active again — a stale ack never hides a fresh problem. Both alerts and violations can be acknowledged; acknowledging is a writer-tier action (viewers can see alerts but not ack them).
Routing alerts to external systems
Today, alerts surface in-app on the Alerts page. Routing alerts outward to external systems — webhooks, and from there Slack, PagerDuty, ServiceNow, or your own automation — is on the roadmap. The intended bridge is a standard event payload your automation receives and routes:
{ "event": "fire", "level": "critical", "topic": "mHv1.0/dfs/LINE-BC-01/equipment/OP10-CNC/energy/temperature", "value": 92 }
The per-binding webhook URL field is reserved for this purpose and is not yet wired for schema alerts. Until external delivery ships, use the in-app Alerts feed.
Restart behaviour
The deadband state between publishes is held in memory. If the backend restarts, an alert that is still past its threshold may re-fire once on the next publish, since the prior state is rebuilt from scratch. The durable event stream never loses the underlying fire/clear history, so the Alerts page and its history remain complete.
Alerts and violations close the loop opened by Schemas: the schema declares the contract and the thresholds, enforcement catches breaks at publish time, and this page is where operators see — and act on — what crossed the line.