Build Your First Pipeline: "Will the Tool Last?"
Before starting this guide, you must complete the steps in the Digital Factory Simulator page: install and run DFS, then import the .mhub.json file into MaestroHub so that all connections are available.
This guide walks you through building your first pipeline in MaestroHub. The goal is not the output itself — it is the process of connecting to different industrial protocols, reading live data, and combining them into a single result.
By the end of this guide, you will know how to:
- Read OPC UA nodes from a CNC machine
- Call a REST API on a manufacturing execution system
- Merge data from both into a JavaScript node
- Publish the result to the Unified Namespace
The pipeline answers a simple question: does the OP20 finish machining tool have enough life to complete the current work order?
What You Will Build
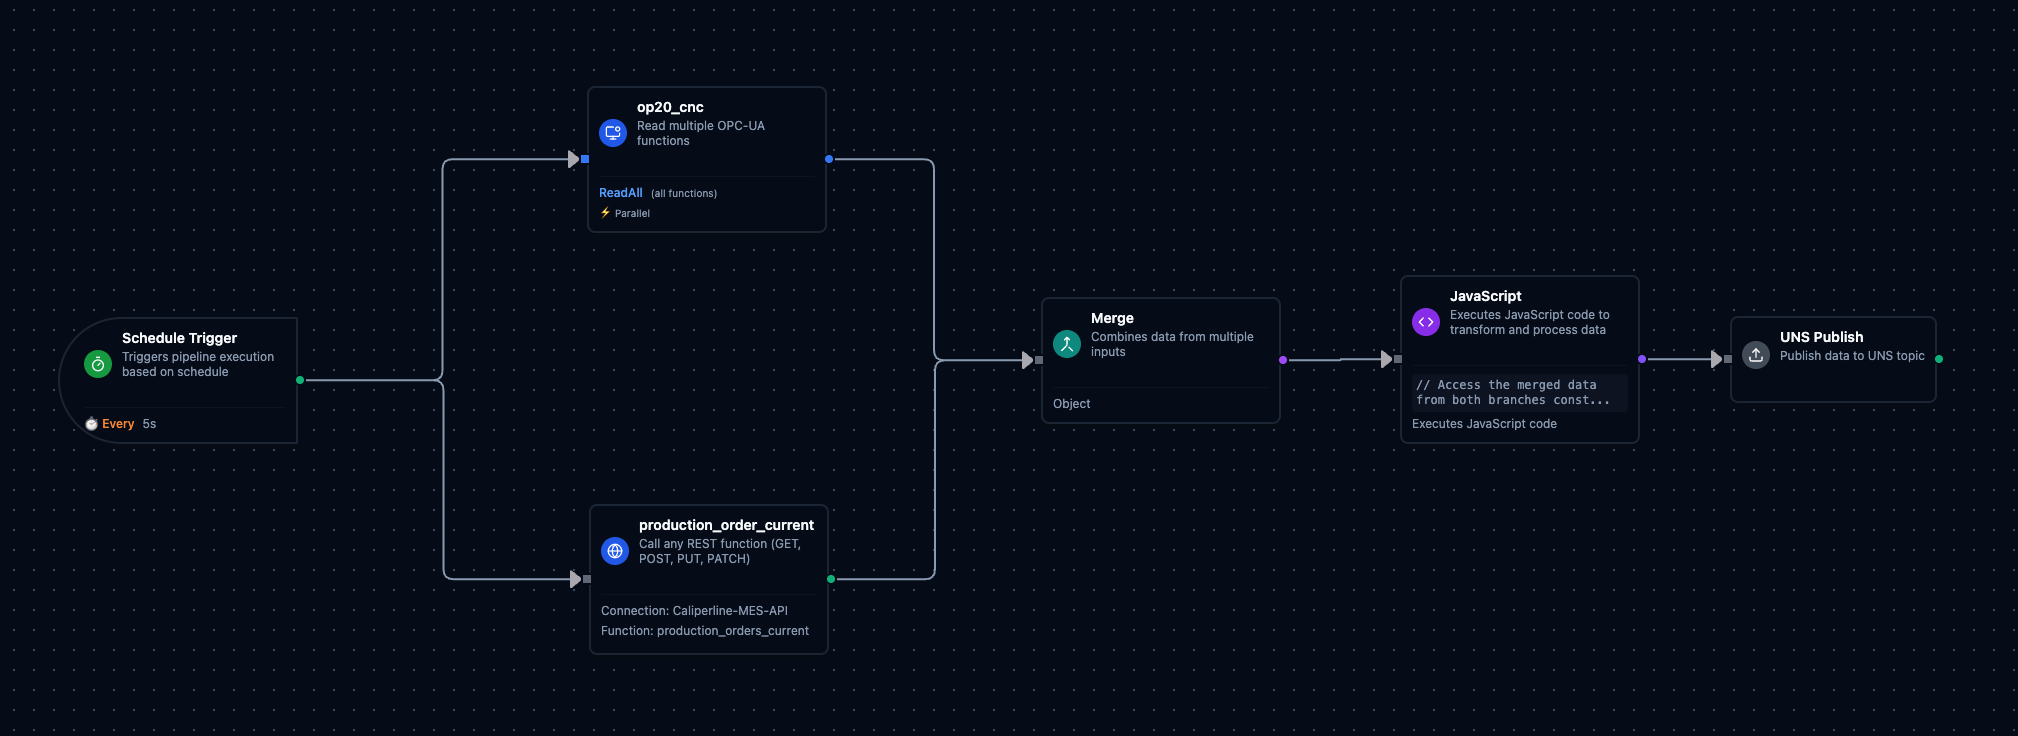
The completed Tool Life Check pipeline
The pipeline consists of 6 nodes across 2 protocols:
- Schedule Trigger — runs the pipeline every 10 seconds
- OPC-UA Read Group — reads tool life from OP20 (CNC)
- REST GET — reads the current work order from the MES API
- Merge — combines both branches into one object
- JavaScript — compares tool life against work order, makes a decision
- UNS Publish — publishes the result to a UNS topic
About the Production Line
The Digital Factory Simulator models a 4-station brake caliper production line:
| Station | Protocol | Has Tools? |
|---|---|---|
| OP10 — CNC Rough Machining | Modbus TCP | Yes (Face Mill, Rough Bore Bar) |
| OP20 — CNC Finish Machining | OPC UA | Yes (Finish Bore Bar, M10 Tap) |
| OP30 — Parts Washer | Modbus TCP | No |
| OP40 — Leak Test | OPC UA | No |
In this guide, you will read tool data from OP20 over OPC UA and work order data from the MES over REST. The tool life check targets OP20's Finish Bore Bar specifically — this is the tool with the shortest life limit (300 parts) on the line.
Step 1: Create the Pipeline
Create a new pipeline and name it "Tool Life Check".
Step 2: Add the Schedule Trigger
This is your first node. It starts the pipeline automatically at a fixed interval.
| Setting | Value |
|---|---|
| Type | Schedule Trigger |
| Interval | 10 seconds |
What you are learning: Pipelines need a trigger to run. A schedule trigger is the simplest option — it runs the pipeline at regular intervals, like a clock.
Step 3: Add the OPC-UA Read Group
This node reads data from OP20, the finish machining station. OP20 communicates over OPC UA — a modern industrial protocol used by CNC machines and advanced equipment. OPC UA organizes data as named nodes (like a file system).
| Setting | Value |
|---|---|
| Connection | Caliperline-OP20-CNC |
Add three functions to read:
| Function Name | Description |
|---|---|
| ToolName | Name of the currently loaded tool |
| ToolLifeRemaining | How many more parts this tool can make |
| ToolLifeLimit | Maximum tool life (total capacity) |
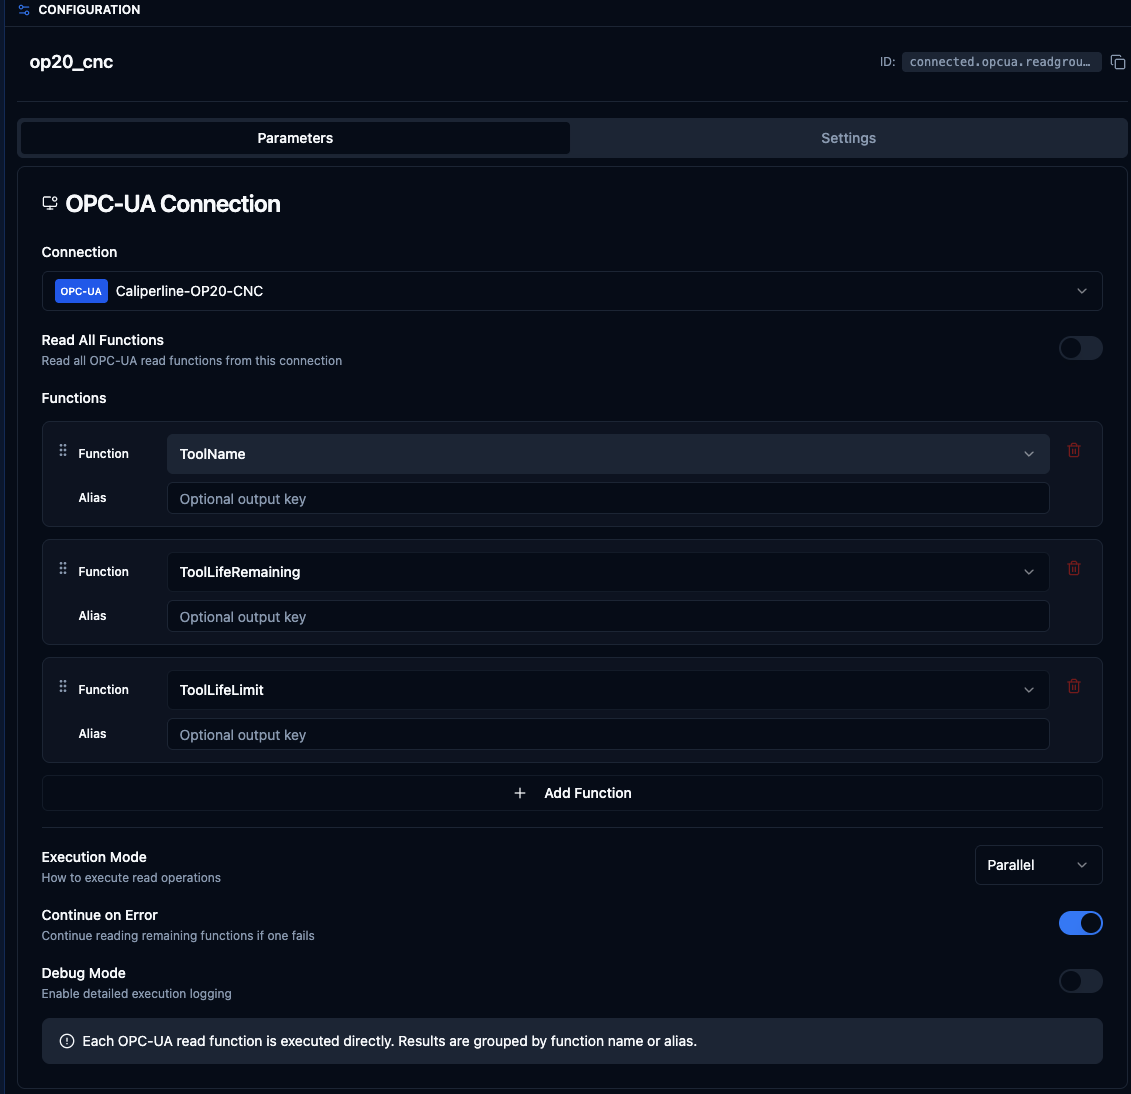
OPC-UA Read Group reading tool life data from OP20
What you are learning: How to read values from a CNC machine over OPC UA. You select named functions that map to OPC UA node IDs — the connection handles the protocol details.
Step 4: Add the REST GET Node
This node reads the current work order from the MES REST API. REST is an HTTP-based protocol used by business applications — MES, ERP, quality systems. Unlike OPC UA which talks directly to machines, REST talks to software systems.
| Setting | Value |
|---|---|
| Connection | Caliperline-MES-API |
| Function | production_orders_current |
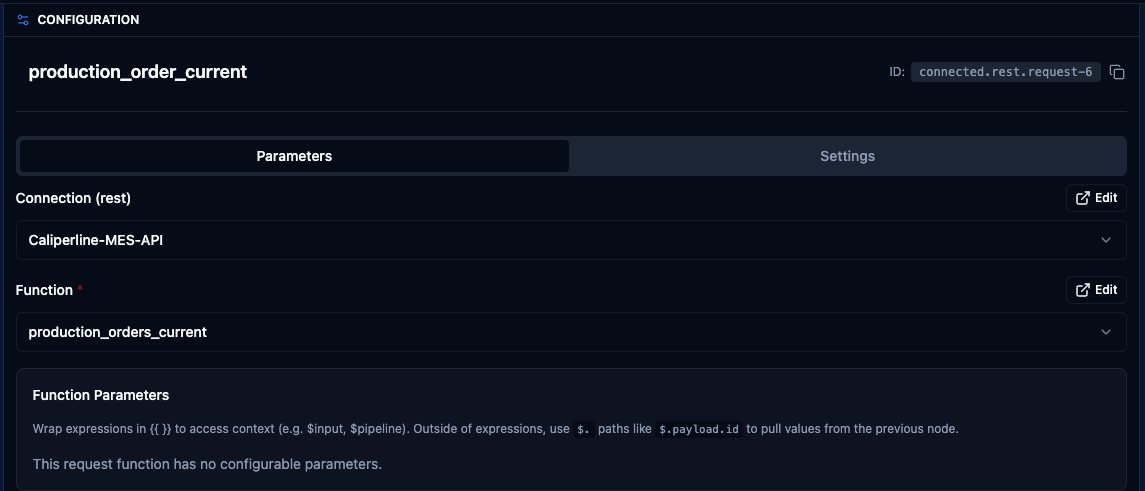
REST GET reading current work order from the MES API
What you are learning: How to call a REST API from a pipeline. This is the same kind of API call that web applications make — but here you are using it to get manufacturing data.
Step 5: Add the Merge Node
Connect the outputs of the OPC-UA and REST nodes into a single Merge node. This combines both branches into one object so the JavaScript node can access everything.
After merging, the data is accessible by branch name:
op20_cnc— OPC UA data from OP20production_order_current— REST data from MES API
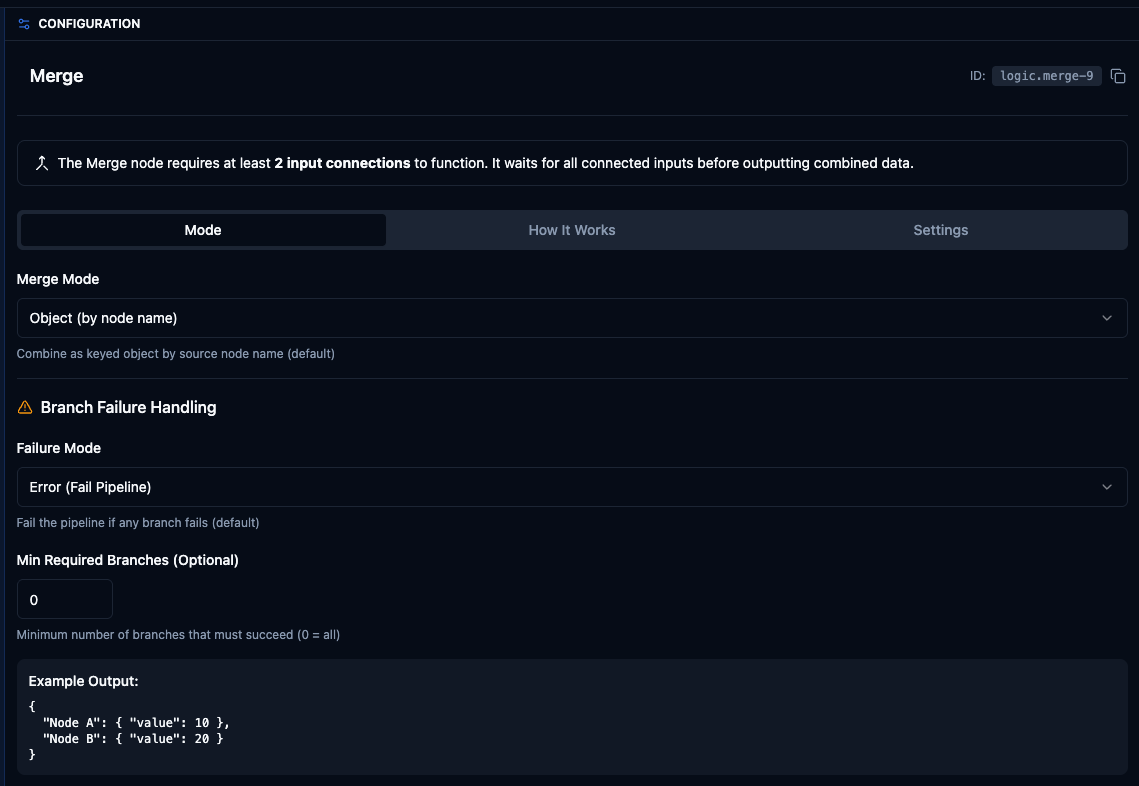
Merge node combining OPC UA and REST branches
What you are learning: When a pipeline has parallel branches (multiple reads happening at the same time), you need a Merge node to bring them back together before processing.
Step 6: Add the JavaScript Node
This is where you combine data from both sources. The code is short — the important thing is understanding how the data flows in.
// Access the merged data from both branches
const merge = $node["Merge"];

// OP20 CNC (OPC UA) — tool status on the finish machining station
const opcua = merge.op20_cnc;

// MES system (REST API) — current work order
const wo = merge.production_order_current.data.bodyJSON;

// How many parts can the OP20 tool still make?
const toolLife = opcua.ToolLifeRemaining.value;

// How many parts does the work order still need?
const remaining = wo.target_qty - wo.produced_qty;

// The decision
const willLast = toolLife > remaining;

return {
  station:         "OP20-CNC",
  tool:            opcua.ToolName.value,
  tool_life:       toolLife + " / " + opcua.ToolLifeLimit.value,
  order:           wo.order_id,
  order_remaining: remaining,
  will_last:       willLast,
  action:          willLast
    ? "No tool change needed"
    : "CHANGE TOOL before part #" + (toolLife + 1)
};
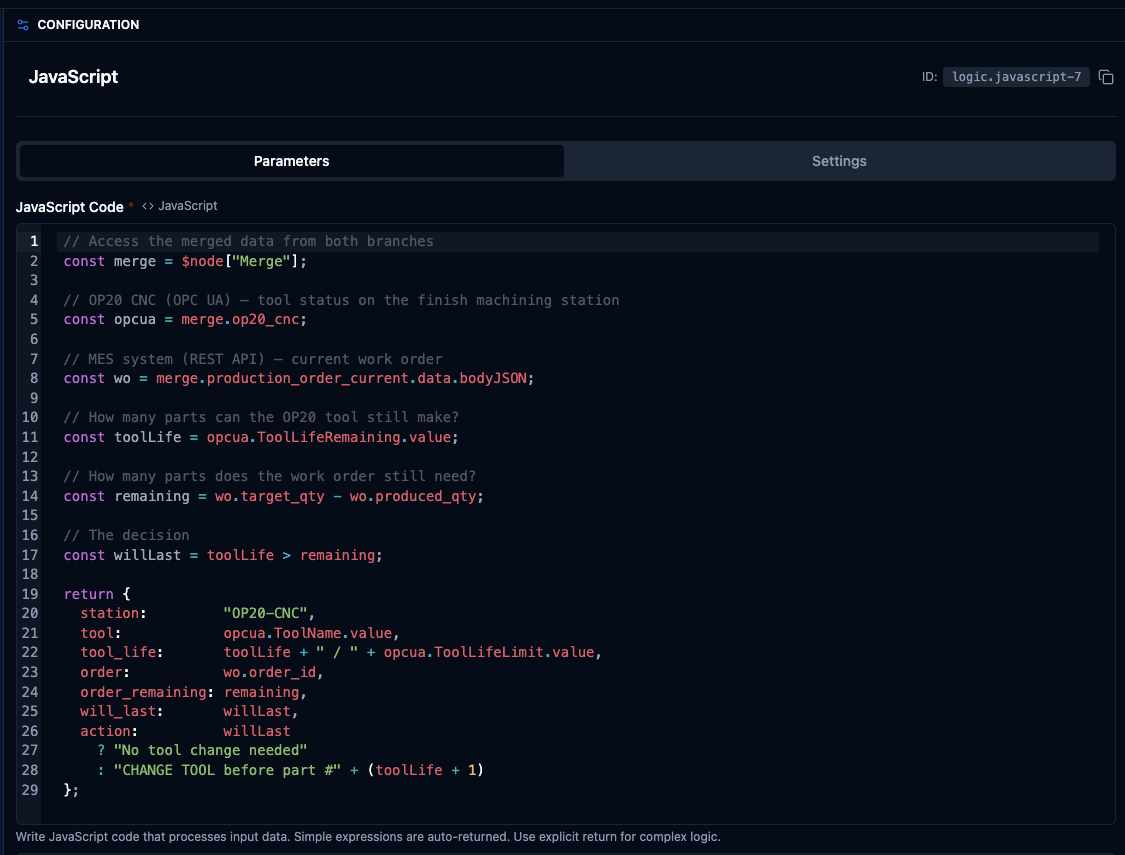
JavaScript node combining OPC UA and REST data
What you are learning:
$node["Merge"]gives you the combined output from the Merge node- Each branch is a key in that object:
op20_cnc,production_order_current - Every OPC UA value is wrapped in
{ value, success, timestamp }— use.valueto get the actual reading - REST responses are nested in
.data.bodyJSON
Step 7: Add the UNS Publish Node
The final node publishes the result to the Unified Namespace so other systems, dashboards, or pipelines can consume it.
| Setting | Value |
|---|---|
| Topic | factory/LINE-BC-01/tool-check/OP20-CNC |
| Format | JSON |
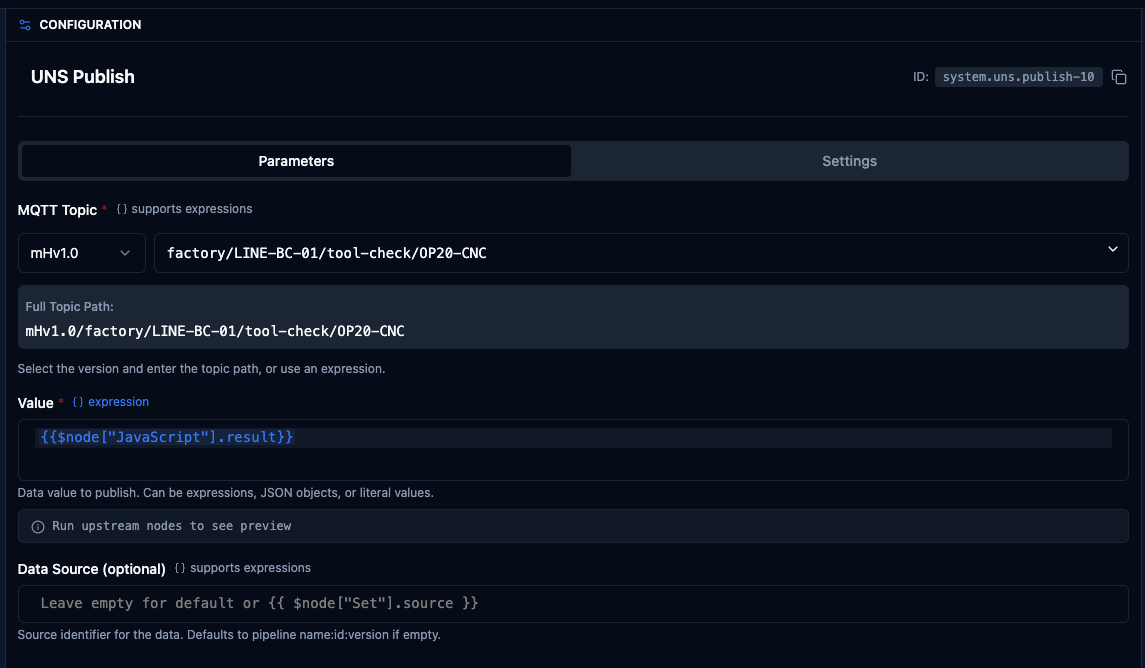
UNS Publish sending the result to a UNS topic
What you are learning: UNS Publish sends your pipeline's output to a topic that any subscriber can listen to. This is how pipelines share data with dashboards, alert systems, or other pipelines.
Step 8: Run the Pipeline
Click Run (or wait for the schedule trigger). You should see output like this:
{
  "station": "OP20-CNC",
  "tool": "Finish Bore Bar",
  "tool_life": "233 / 300",
  "order": "WO-2024-036",
  "order_remaining": 8,
  "will_last": true,
  "action": "No tool change needed"
}
This tells you: the Finish Bore Bar on station OP20-CNC has 233 uses left. The current work order needs 8 more parts. The tool will last.
If the tool were running low:
{
  "station": "OP20-CNC",
  "tool": "Finish Bore Bar",
  "tool_life": "3 / 300",
  "order": "WO-2024-036",
  "order_remaining": 8,
  "will_last": false,
  "action": "CHANGE TOOL before part #4"
}
The tool can only make 3 more parts, but the work order needs 8. Change the tool before starting the 4th part.
You can also verify the published message by checking the UNS Topics page in MaestroHub:
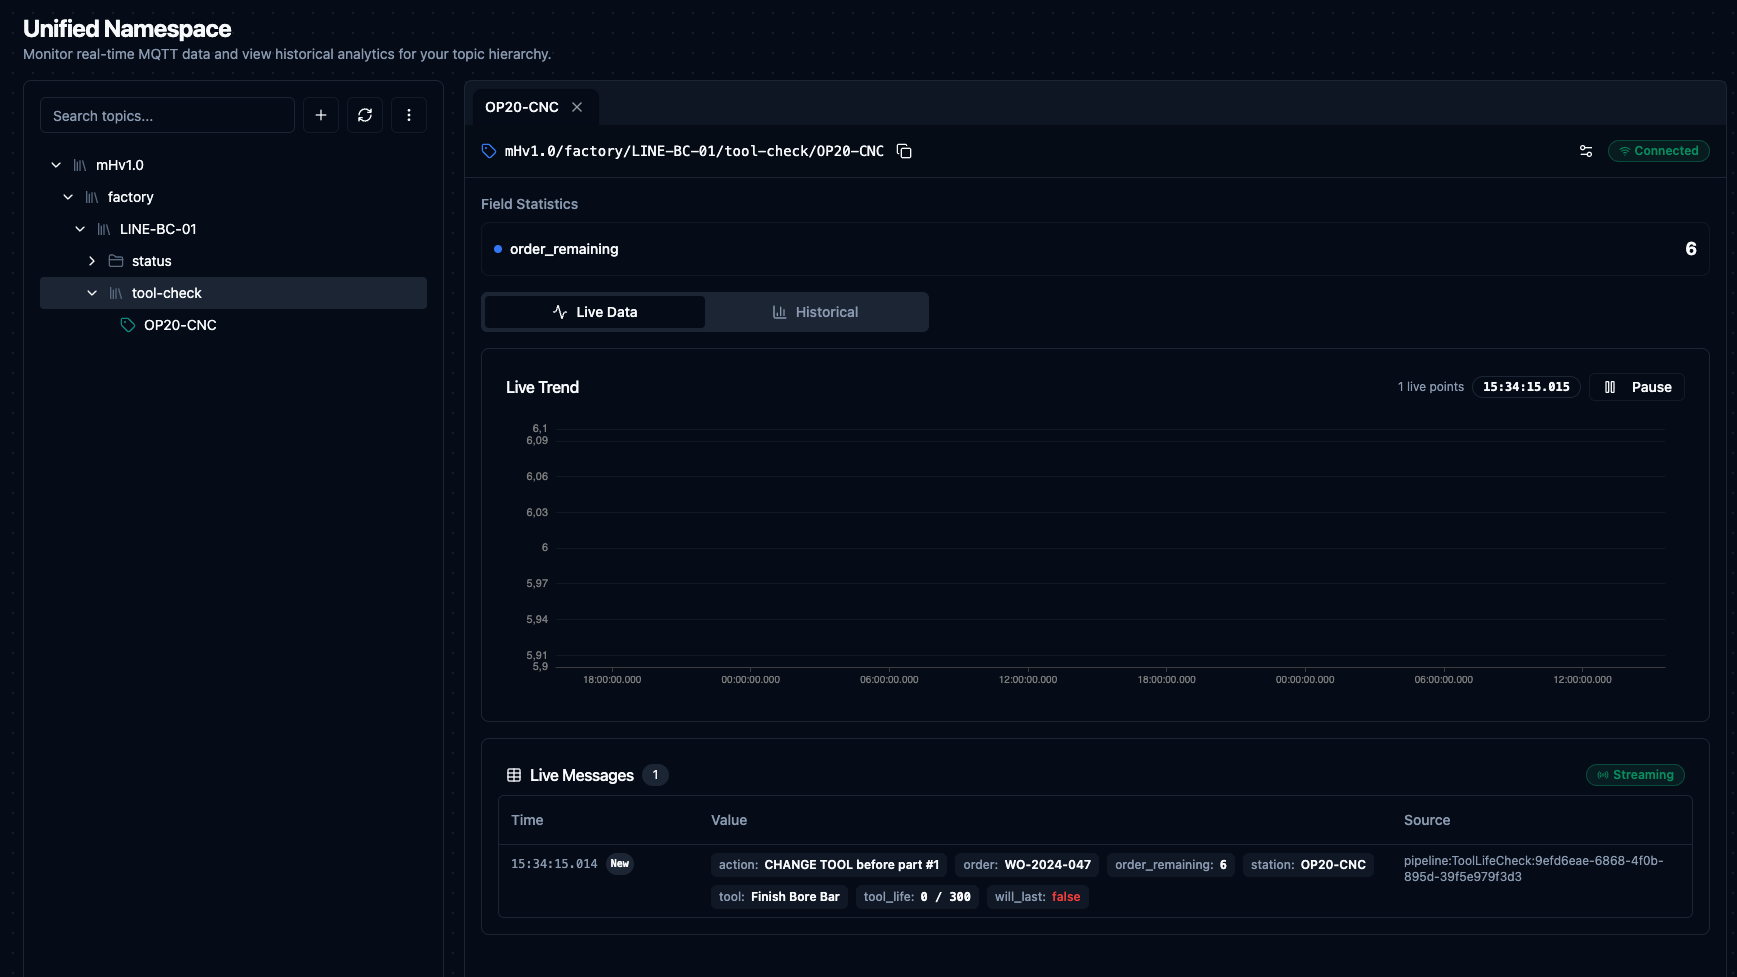
Published tool check result visible in UNS Topics
What You Learned
This pipeline was not about tool life — it was about learning the building blocks of MaestroHub pipelines:
| Step | What You Practiced |
|---|---|
| Schedule Trigger | Starting a pipeline on a timer |
| OPC-UA Read Group | Reading data from a CNC using node-based addressing |
| REST GET | Calling an HTTP API to get business data |
| Merge | Combining parallel branches into a single data flow |
| JavaScript | Accessing and transforming data from multiple sources |
| UNS Publish | Publishing results to the Unified Namespace |
You now know the read, merge, transform, publish pattern. Every pipeline in MaestroHub follows this same structure, whether it calculates OEE, monitors energy, or predicts maintenance.
Next Steps
Now that you know the building blocks, try these:
Add a Condition node after the JavaScript to only publish when will_last is false. This turns the pipeline from a periodic report into an alert that only fires when something needs attention.
Add a Modbus Read Group. OP10 communicates over Modbus TCP — a register-based protocol used by PLCs. Add a Modbus node to read OP10's tool data (Face Mill and Rough Bore Bar at registers 40030-40032) and extend the JavaScript to check tools across both stations.
Build an OEE pipeline. Use the same read, merge, transform, publish pattern, but read run time, down time, and part counts from each station to calculate Overall Equipment Effectiveness.