Audit Trail
The Audit Trail is a permanent record of who did what, and when. Every row names an actor, an action, the resource it touched and whether it worked. It answers questions such as "who turned that off?" and is the page to open when an auditor asks for evidence.
Open it from Admin → Monitor → Audit Trail in the sidebar (the address is /<workspace-slug>/audit).
You need the audit_log:read permission to open the page. The Audit Trail requires the Foundation edition or higher. Core does not include it (see License editions).
What is recorded
Changes are always recorded. Anything someone creates, edits, deletes, grants or revokes produces a row. The main groups are:
| Group | Example actions |
|---|---|
| Sign-in and identity | user.login, user.login.failed, user.logout, user.created, user.updated, user.deleted, password.reset.initiated |
| Access control | role.assigned, role.removed, custom_role.created, resource.shared, ownership.transferred, access.denied, break_glass.granted |
| Impersonation | impersonation.started, impersonation.ended, recorded when an administrator uses View as on a user |
| Workspaces | workspace.created, workspace.suspended, maintenance.enabled, settings.changed |
| Building blocks | connection.created, pipeline.updated, function.deleted, dashboard.created, topic.renamed |
| Alerts | alert.acknowledged, alert.shelved, alert.unshelved |
| Platform | notification_channel.created, bundle.imported, upgrade.applied |
| The audit log itself | audit_log.exported: every export request is recorded, so "who pulled our logs?" has an answer |
Things that are run, such as a function executed, a value published by hand, or a pipeline run or tested, are recorded according to who runs them:
- A person or an AI agent: every run is recorded, whether it succeeded, failed or was refused.
- A pipeline, an API client, a platform service or the platform itself: only refusals are recorded, at most one row a minute for the same actor and resource. These actors run at machine pace, so a row per run would bury the trail during an outage. Their runs are in execution history, connection health and metrics instead.
- An App Studio app acting with a person's sign-in: only refusals are recorded, in the same way. App Studio is coming soon; it is not part of release 3.0.
Data that flows through the platform is not recorded: machine readings, values a pipeline publishes, and connector traffic. Use the Data Explorer for readings and execution history for what a pipeline did.
Workspace or platform scope
By default the page shows the current workspace's records.
If you can read the audit trail in more than one place, a scope switch appears next to the time range:
- This workspace: the current workspace only.
- All my workspaces: every workspace where you hold
audit_log:read. Shown to members of several workspaces. - Platform: every workspace, plus records that belong to no workspace, such as sign-ins and sign-outs. Shown only to System Administrators. These records show Platform in the Workspace column.
In the wide scopes an Workspace column appears after Time. The scope applies to the table, the counters and the export.
Time range
The time range sets which records the table, the counters and the export cover. Choose Last 24 hours, Last 7 days, Last 30 days (the default), Last 90 days, Last year, or a Custom range. Future dates can't be picked.
Set the time range first. You usually know roughly when something changed, and the range cuts the list further than any other filter.
Reading the page
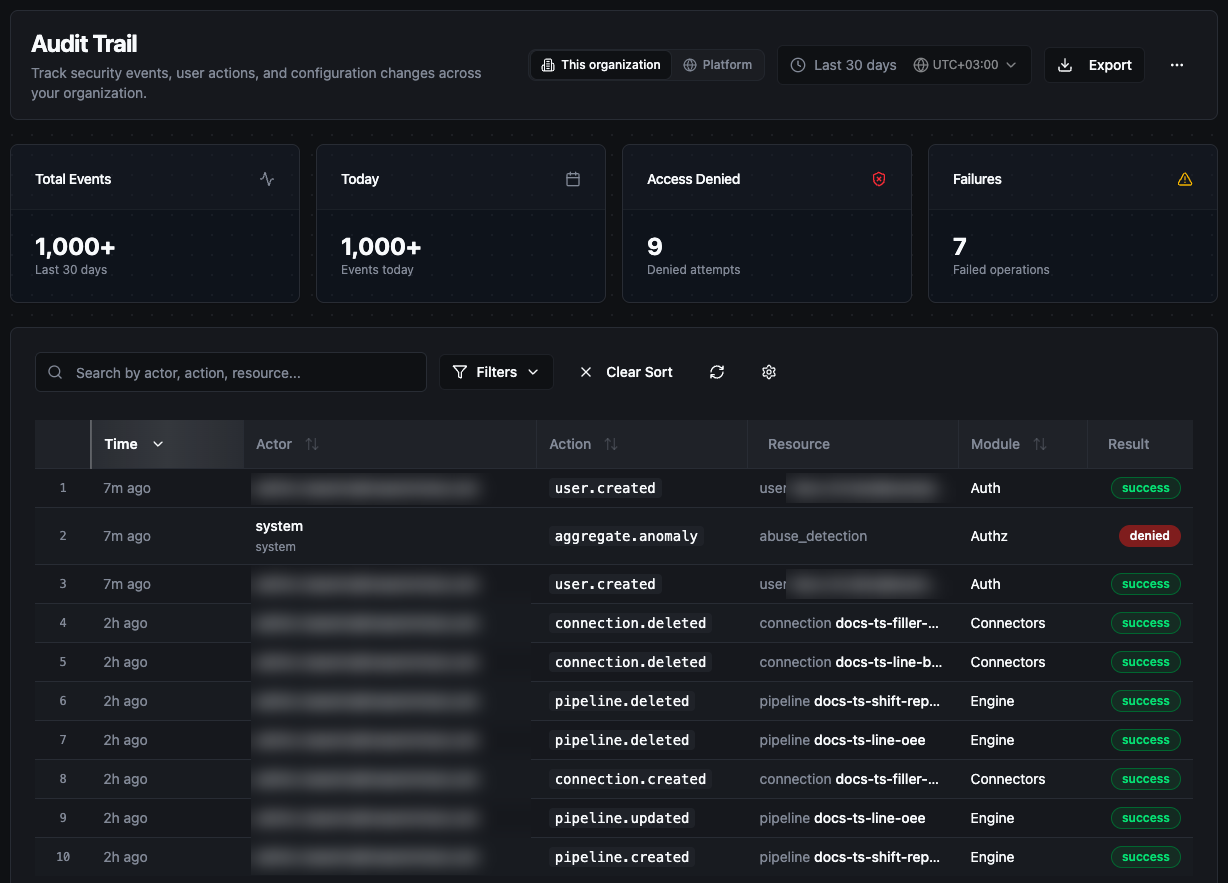
The four counters at the top count records in the selected range and scope: Total Events, Today, Access Denied and Failures. A count that reaches the server's counting limit shows a + (for example 1000+).
The table has these columns:
| Column | Shows |
|---|---|
| Time | How long ago it happened. Hover for the exact time. |
| Actor | Who did it: an email address, or the actor's ID. When the actor is not a person, the type is shown under it: pipeline, agent, client, webhook, service or system. |
| Action | The action name, such as pipeline.updated. |
| Resource | The type and name (or ID) of what was changed. |
| Module | The part of MaestroHub that recorded it. |
| Result | success, failure or denied. A refused attempt is often the more interesting row. |
The table settings let you hide, resize and reorder columns and change the page size.
Search and filters
- Search matches the actor's email, the action, the resource type and the resource name.
- Module lists only the modules that have records in your scope.
- Result: Success, Failure or Denied.
- Sensitivity: High Sensitivity shows only denied or failed records and records with a denial reason. Start a security review here.
- The sort direction switches between newest first (the default) and oldest first.
Record details
Click a row to open its details: the exact time, the actor and actor type, the module, the resource, the workspace, IP address and user agent, severity, category, classification, the details the action recorded, and the record's hash values. A refused action also shows its Denial Reason.
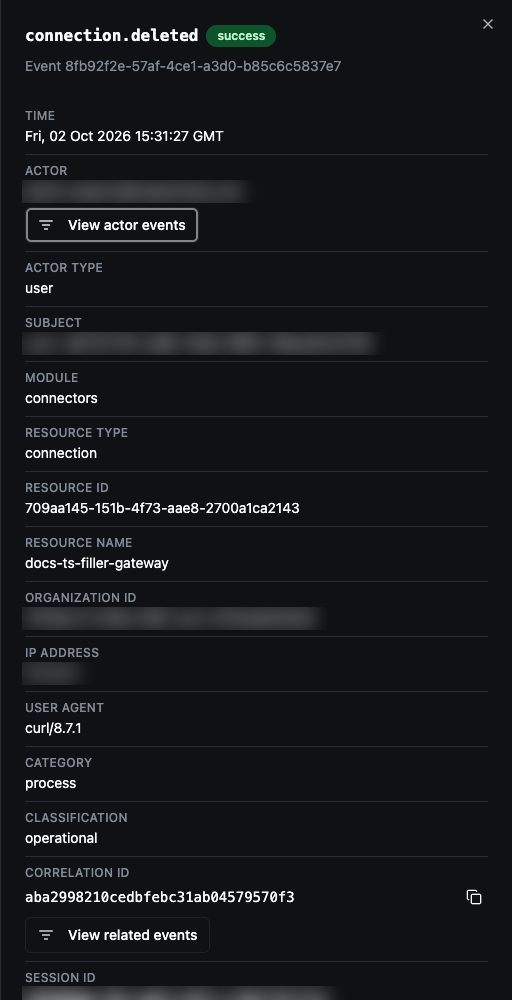
From the details you can narrow the table to related records. Each action appears only when the record carries the value it needs:
- View related events: every record from the same request (same correlation ID).
- View session events: everything one sign-in session did.
- View app events: everything one App Studio app did on users' behalf.
- View actor events: everything the same actor did.
- View impersonator's actions: everything an administrator did while using View as.
Each one adds a chip above the table. Click the × on the chip to remove it.
Missing records warning
If audit records failed to be saved in the last 24 hours, a banner at the top of the page says so. A red Audit trail incomplete banner means records are missing. A yellow Audit persistence degraded banner means saves failed, and records may be missing if the retries ran out. The count covers the whole installation.
Export
Export downloads the records you are looking at: the current scope, time range, search and filters. It covers every matching record, not only the visible page. You need the audit_log:export permission. Without it the button is disabled, and its tooltip names the permission.
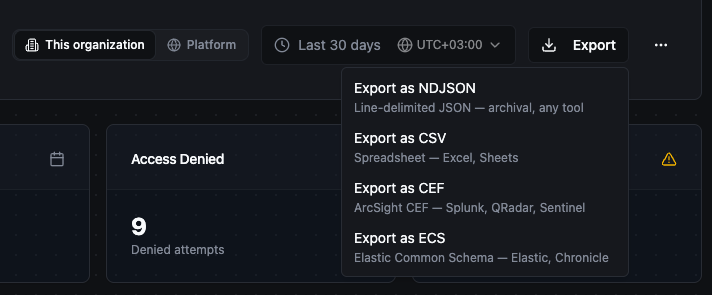
Choose a format:
| Format | File | Use it for |
|---|---|---|
| NDJSON | .ndjson | One JSON record per line. Archiving, and any tool that reads JSON lines. |
| CSV | .csv | Spreadsheets such as Excel and Google Sheets. |
| CEF | .cef | ArcSight Common Event Format: Splunk, QRadar, Sentinel. |
| ECS | .json | Elastic Common Schema, one record per line: Elastic, Chronicle. |
The file is named audit-export-<date>.<extension>.
Limits. The browser fetches the records in pages of up to 10,000. A notice shows how many pages it has fetched. After 500 pages (5,000,000 records) the export stops and asks you to narrow the time range. Every export must have a time range; the page always has one set.
Each page the browser fetches is recorded in the Audit Trail as an audit_log.exported record, with the format, the time range and the number of records.
Exporting to a SIEM automatically
The Export button is the no-code way to get the trail out. To send records to a SIEM continuously, point a collector at the same export endpoint with an API client. See SIEM integration for Splunk, Elastic, Datadog and CSV setups.
Integrity and retention
Open ⋯ → Integrity & Retention… in the page header. This panel covers the whole installation, across every workspace.
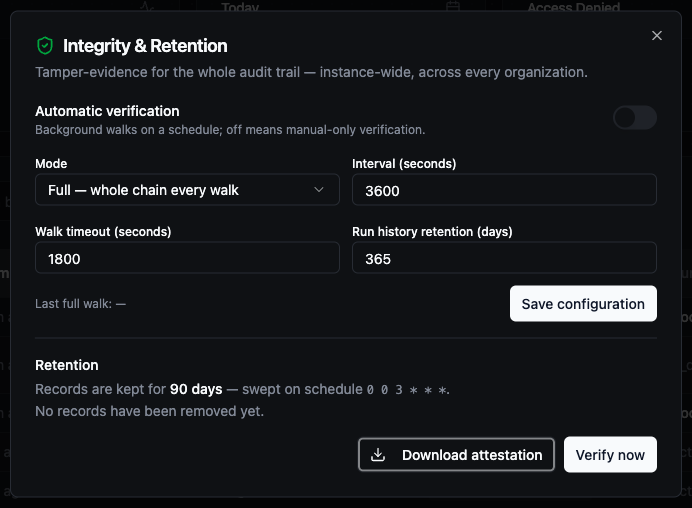
Integrity. Each record carries a hash that includes the hash of the record before it, so changing or removing a record breaks the chain.
- Verify now checks the chain and reports how many records it checked, or the first record where the chain breaks.
- Download attestation runs a fresh check and downloads its report: the period covered, the number of records checked, and whether the chain is valid.
- Automatic verification runs the check on a schedule. Its settings are Mode (Full or Incremental), Interval, Full walk every (Incremental mode only), Walk timeout and Run history retention. Changing them needs the
audit_log:configurepermission. - If a break is found, a red Hash chain break detected notice names the first broken record. A notification is also sent to everyone who can read the audit trail (see Notifications). Investigate before you click Acknowledge. Acknowledging also needs
audit_log:configure.
Retention. By default records are kept for 90 days. A job runs every night at 03:00 (server time) and removes older records. The panel shows the retention period, the schedule, and the date before which records have been removed. Verification starts from that date.
Retention is set in config.yaml, not in the UI:
modules:
  audit:
    retentionWorker:
      schedule: "0 0 3 * * *"   # cron with seconds; an empty string turns retention off
      window: 2160h             # keep records this long (2160h = 90 days)
Raise window if your regulations need a longer history. Set schedule to "" to keep records forever.
Permissions
| Permission | Allows | Held by default by |
|---|---|---|
audit_log:read | Opening the page, filtering, record details, verifying integrity, downloading an attestation | System Administrator, Workspace Administrator, Security Administrator, Compliance Auditor |
audit_log:export | The Export button and the export API | The same four roles |
audit_log:configure | Changing automatic verification, cancelling a verification run, acknowledging a chain break | System Administrator only |
Compliance Auditor is an advanced access control role (Enterprise). It can read and export the trail and nothing else. See Users & Roles for how to assign roles.
Related
- SIEM integration: stream the trail into Splunk, Elastic or Datadog.
- Notifications: get a Slack, Teams or webhook message when the audit chain breaks or abuse is suspected.
- Users & Roles: the roles that grant audit access.