Google Sheets Integration Guide
Read a range of a Google spreadsheet into a pipeline, append rows to a log, and overwrite a fixed range such as a status board.
- Operations
- Read Range · Append Rows · Update Range
- Authentication
- Service account key or Application Default Credentials
- Scope
- One spreadsheet per connection
- Triggers
- None (use Apps Script and a webhook)
Use MaestroHub's Google Sheets connector for the spreadsheets plants already keep: shift reports, small-line production logs, lookup tables of machine IDs, and status boards a supervisor looks at. A pipeline can read a range, add rows to the end of a table, or overwrite fixed cells. The connector talks to the Google Sheets API v4 and authenticates the same way as the other Google Cloud connectors.
Overview
The Google Sheets connector provides:
- Read Range: a range such as
'Shift Log'!A:E, as one object per row keyed by the header row, or as a plain grid - Append Rows: rows added below the table Google finds in a range, from arrays or from objects
- Update Range: the cells of a fixed range overwritten, such as a status board
- A row limit inside the request: a whole-column range never reads the whole sheet
- Values written as typed: text that starts with
=stays text unless you ask for spreadsheet parsing
One connection is one spreadsheet. The connection check opens that spreadsheet, so a green connection means the key works, the API is enabled and the sheet is shared.
Prerequisites
A Google Cloud project with the Sheets API enabled
In the Google Cloud console, pick or create a project and enable Google Sheets API under APIs & Services → Library. The API is free; it has a quota of 60 read and 60 write requests per minute per user per project.
A service account and its key
Under IAM & Admin → Service Accounts, create a service account (it needs no project role for Sheets), then Keys → Add key → Create new key → JSON. Paste the whole JSON file into the connection. On GKE you can leave the key empty and use Workload Identity instead (Application Default Credentials).
The spreadsheet shared with the service account
A service account sees no spreadsheet until someone shares it. Open the spreadsheet, choose Share, and add the key's client_email (for example mh-logger@acme-plant.iam.gserviceaccount.com):
- Viewer for a connection that only reads
- Editor for a connection that appends or updates
The share list is the access control: the connection can reach exactly the spreadsheets shared with its account.
Connection Configuration
From Connections → New Connection → Google Sheets, configure the fields below.
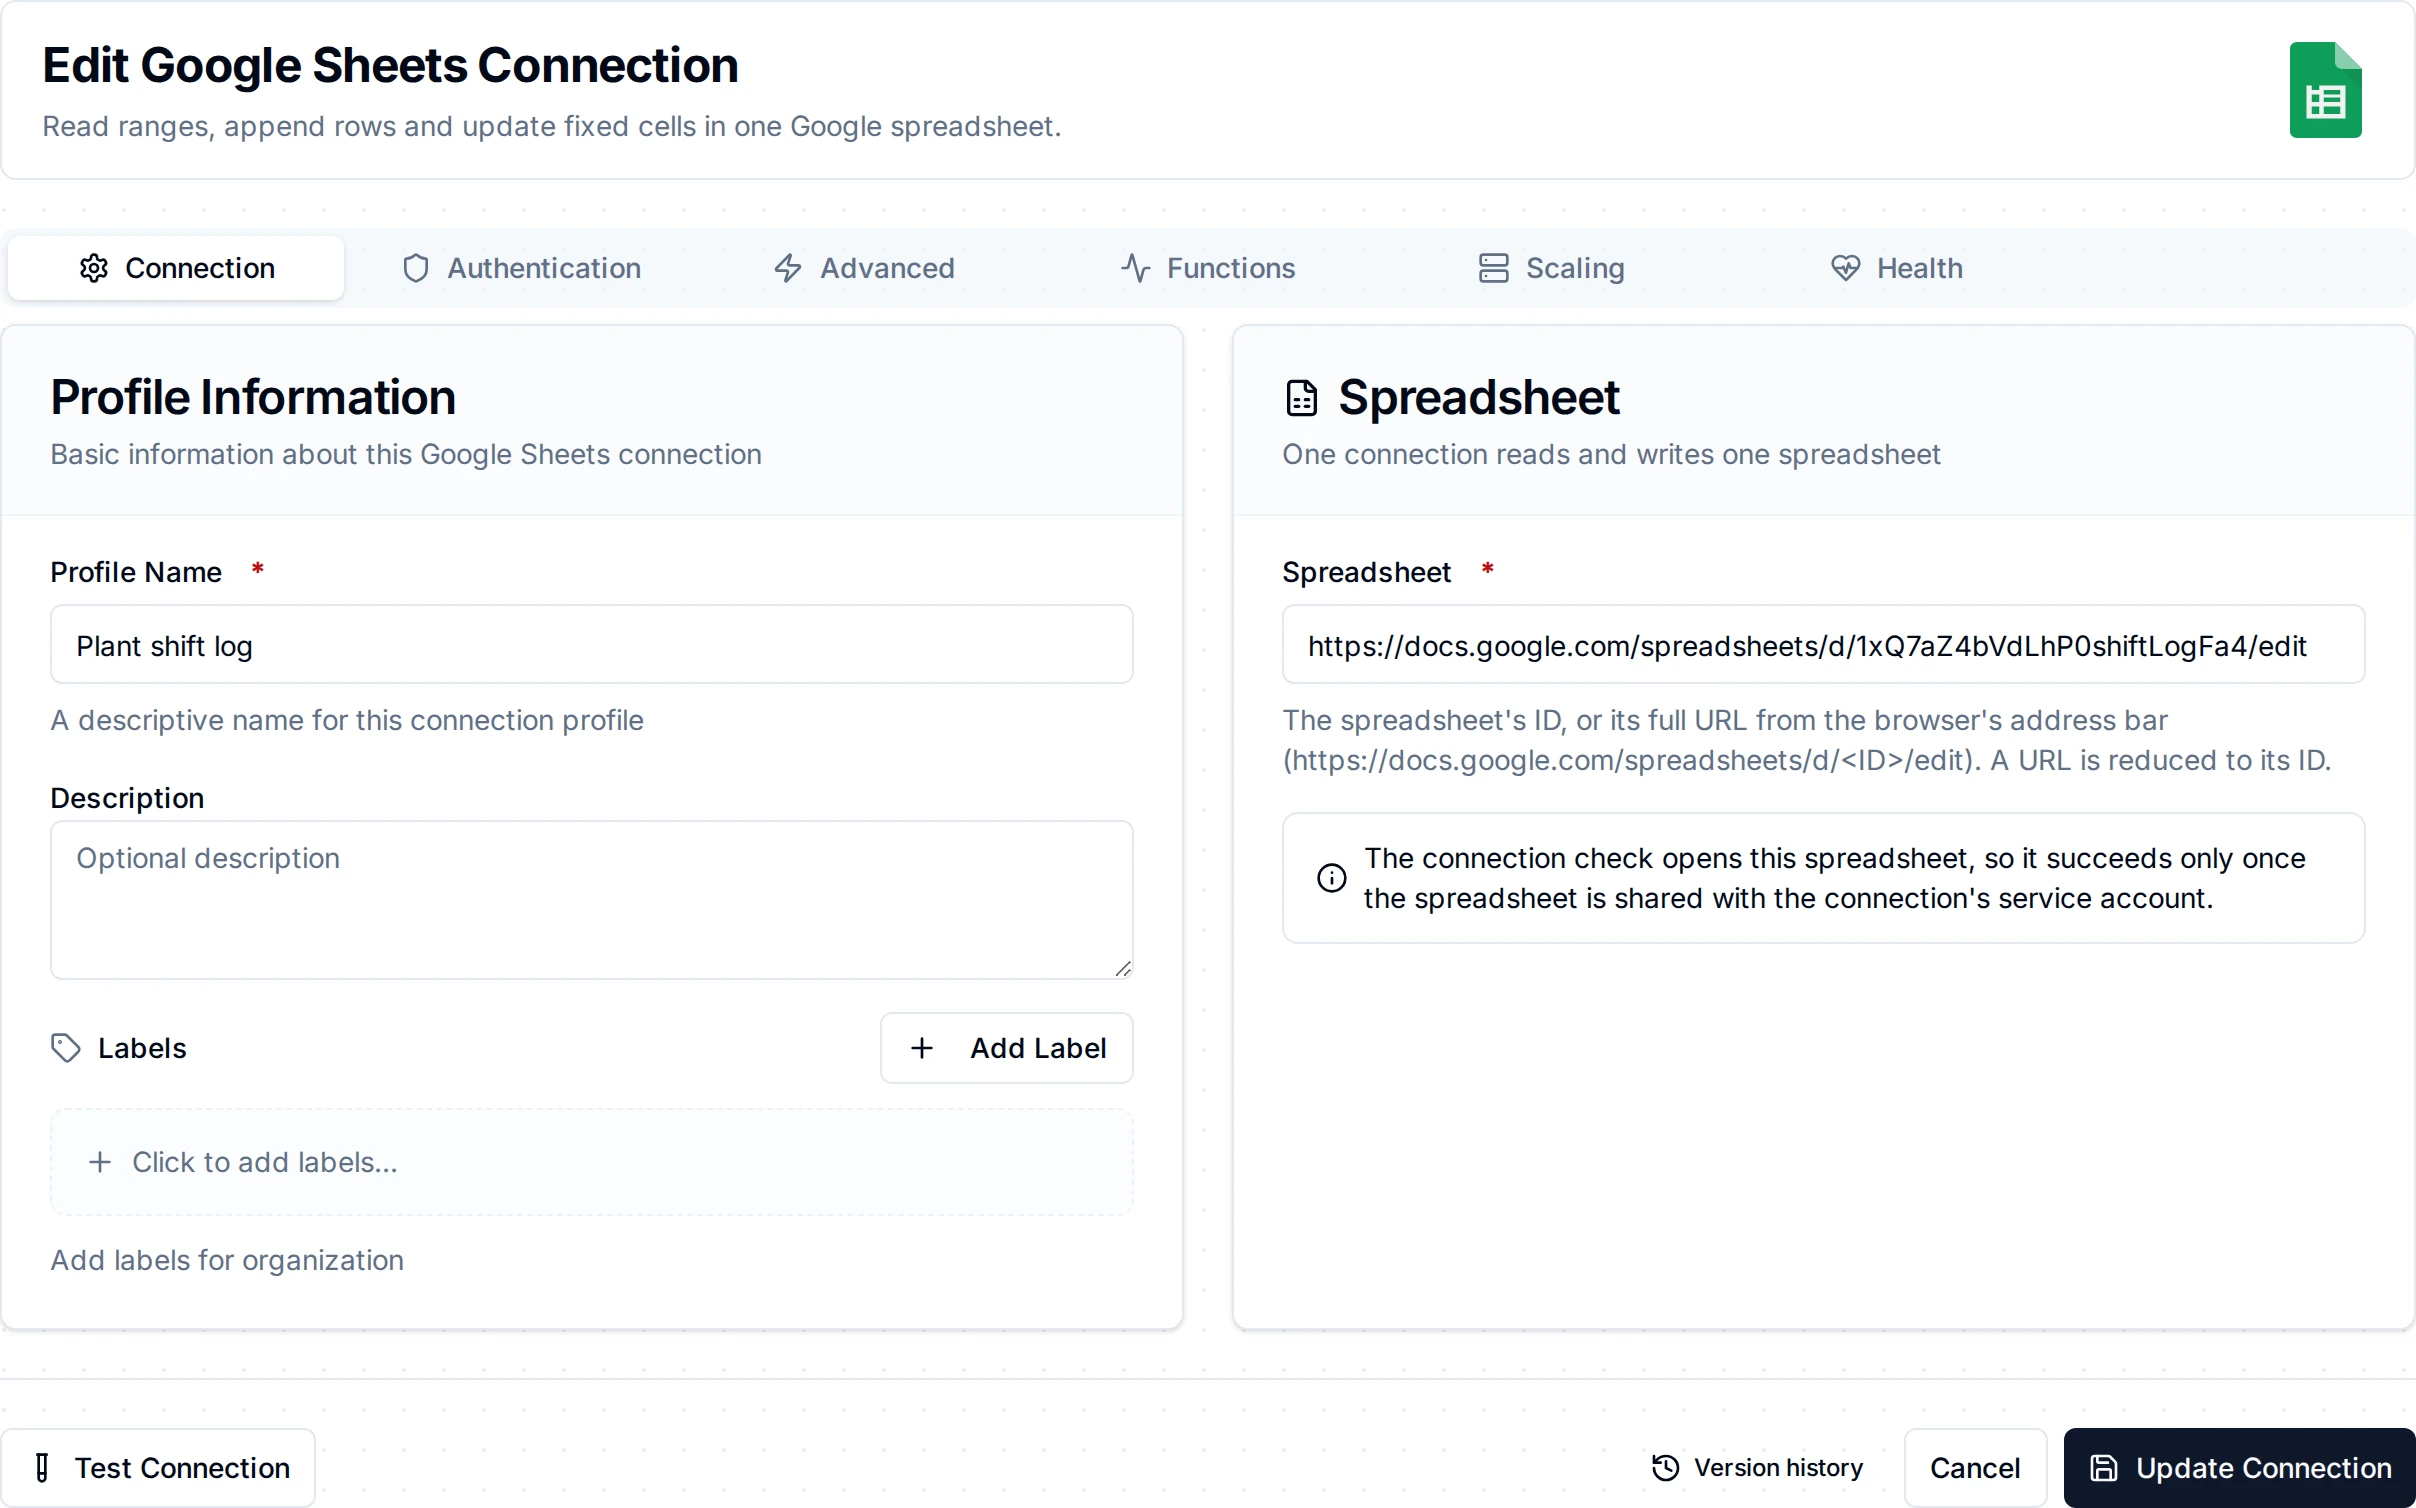
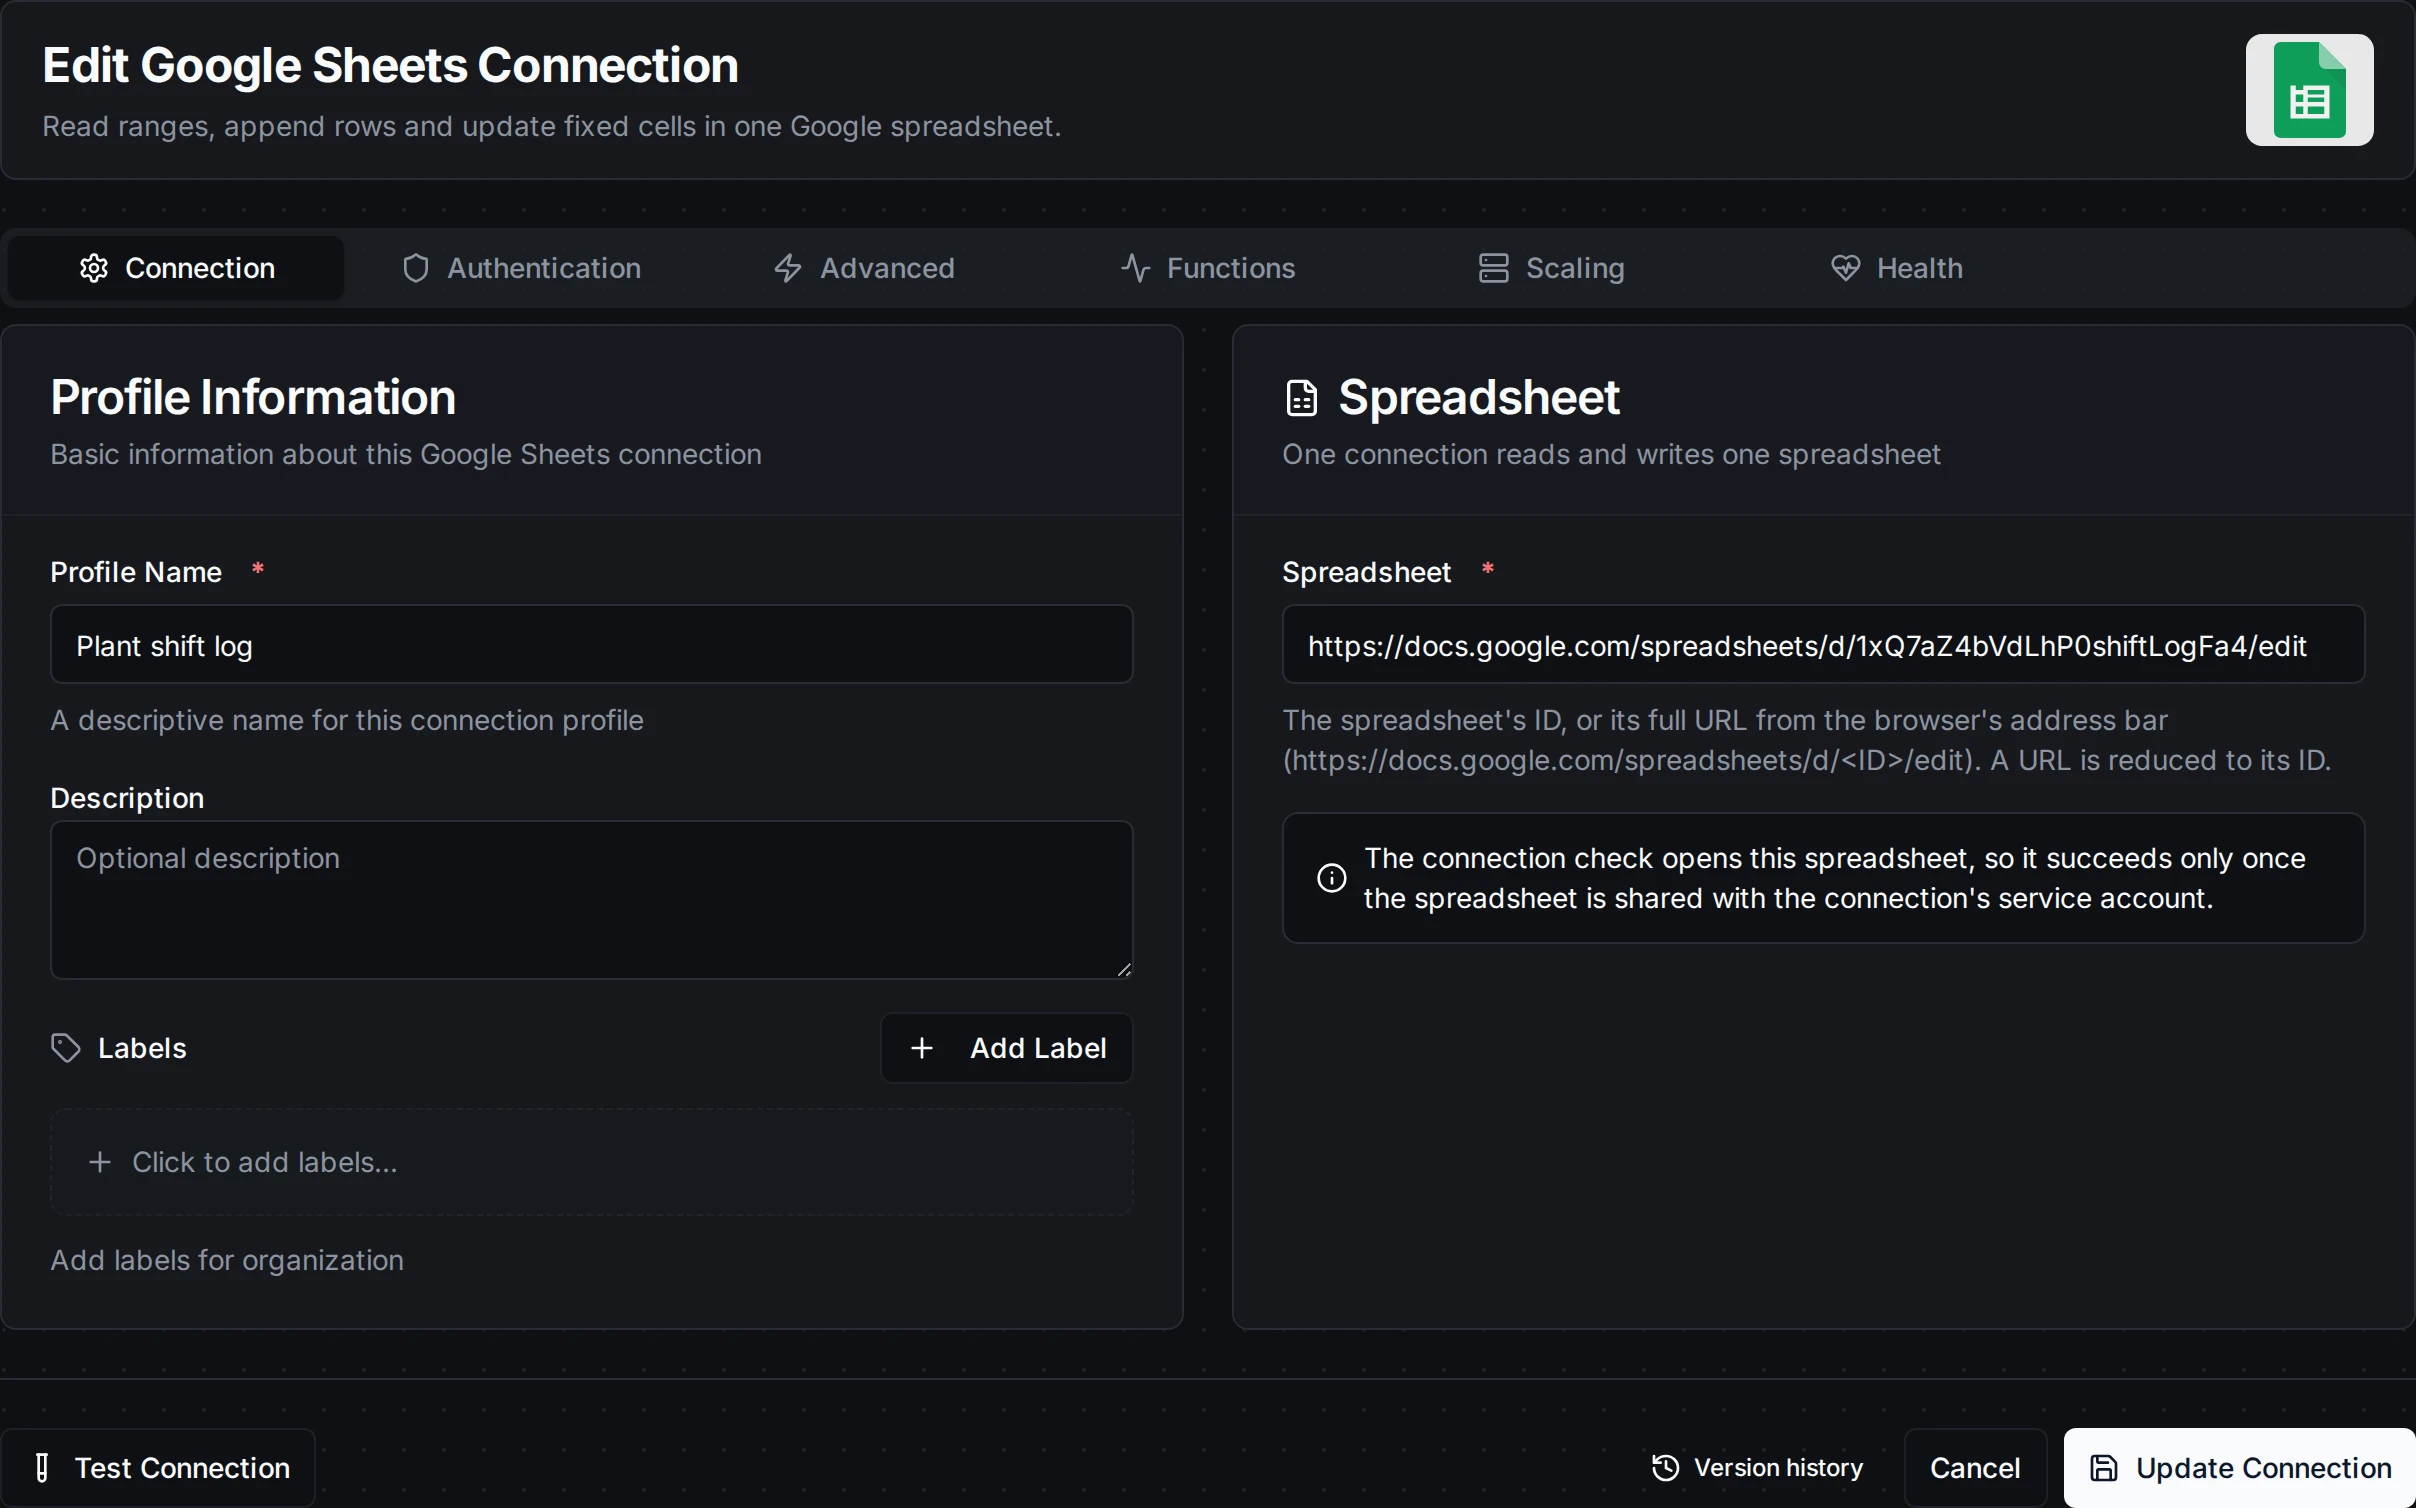
The spreadsheet, the service account key, and the account the spreadsheet must be shared with
| Field | Default | Description |
|---|---|---|
| Profile Name | - | A descriptive name for this connection profile (required, max 100 characters) |
| Description | - | Optional description |
| Spreadsheet | - | The spreadsheet's ID, or its full URL from the browser (https://docs.google.com/spreadsheets/d/<ID>/edit); the ID is taken from the URL (required) |
| Service Account JSON Key | - | The service account's JSON key. Masked on edit; leave empty to keep the stored value. Leave it empty entirely to use Application Default Credentials. Once a key is pasted, the form shows the email to share the spreadsheet with |
| Custom API Endpoint | - | A custom Sheets API endpoint for private access or tests. Leave empty for Google's own. With an endpoint and no key, calls are anonymous |
| Connect Timeout | 30s | How long connecting may take (1s-5m) |
The connection is checked every 30 seconds by opening the spreadsheet (its ID only, a few bytes). That is 2 of the 60 reads per minute Google allows each user of a project. Connections that share one service account share its quota.
Function Builder
After saving the connection, open its Functions tab → New Function and pick one of the three operations.
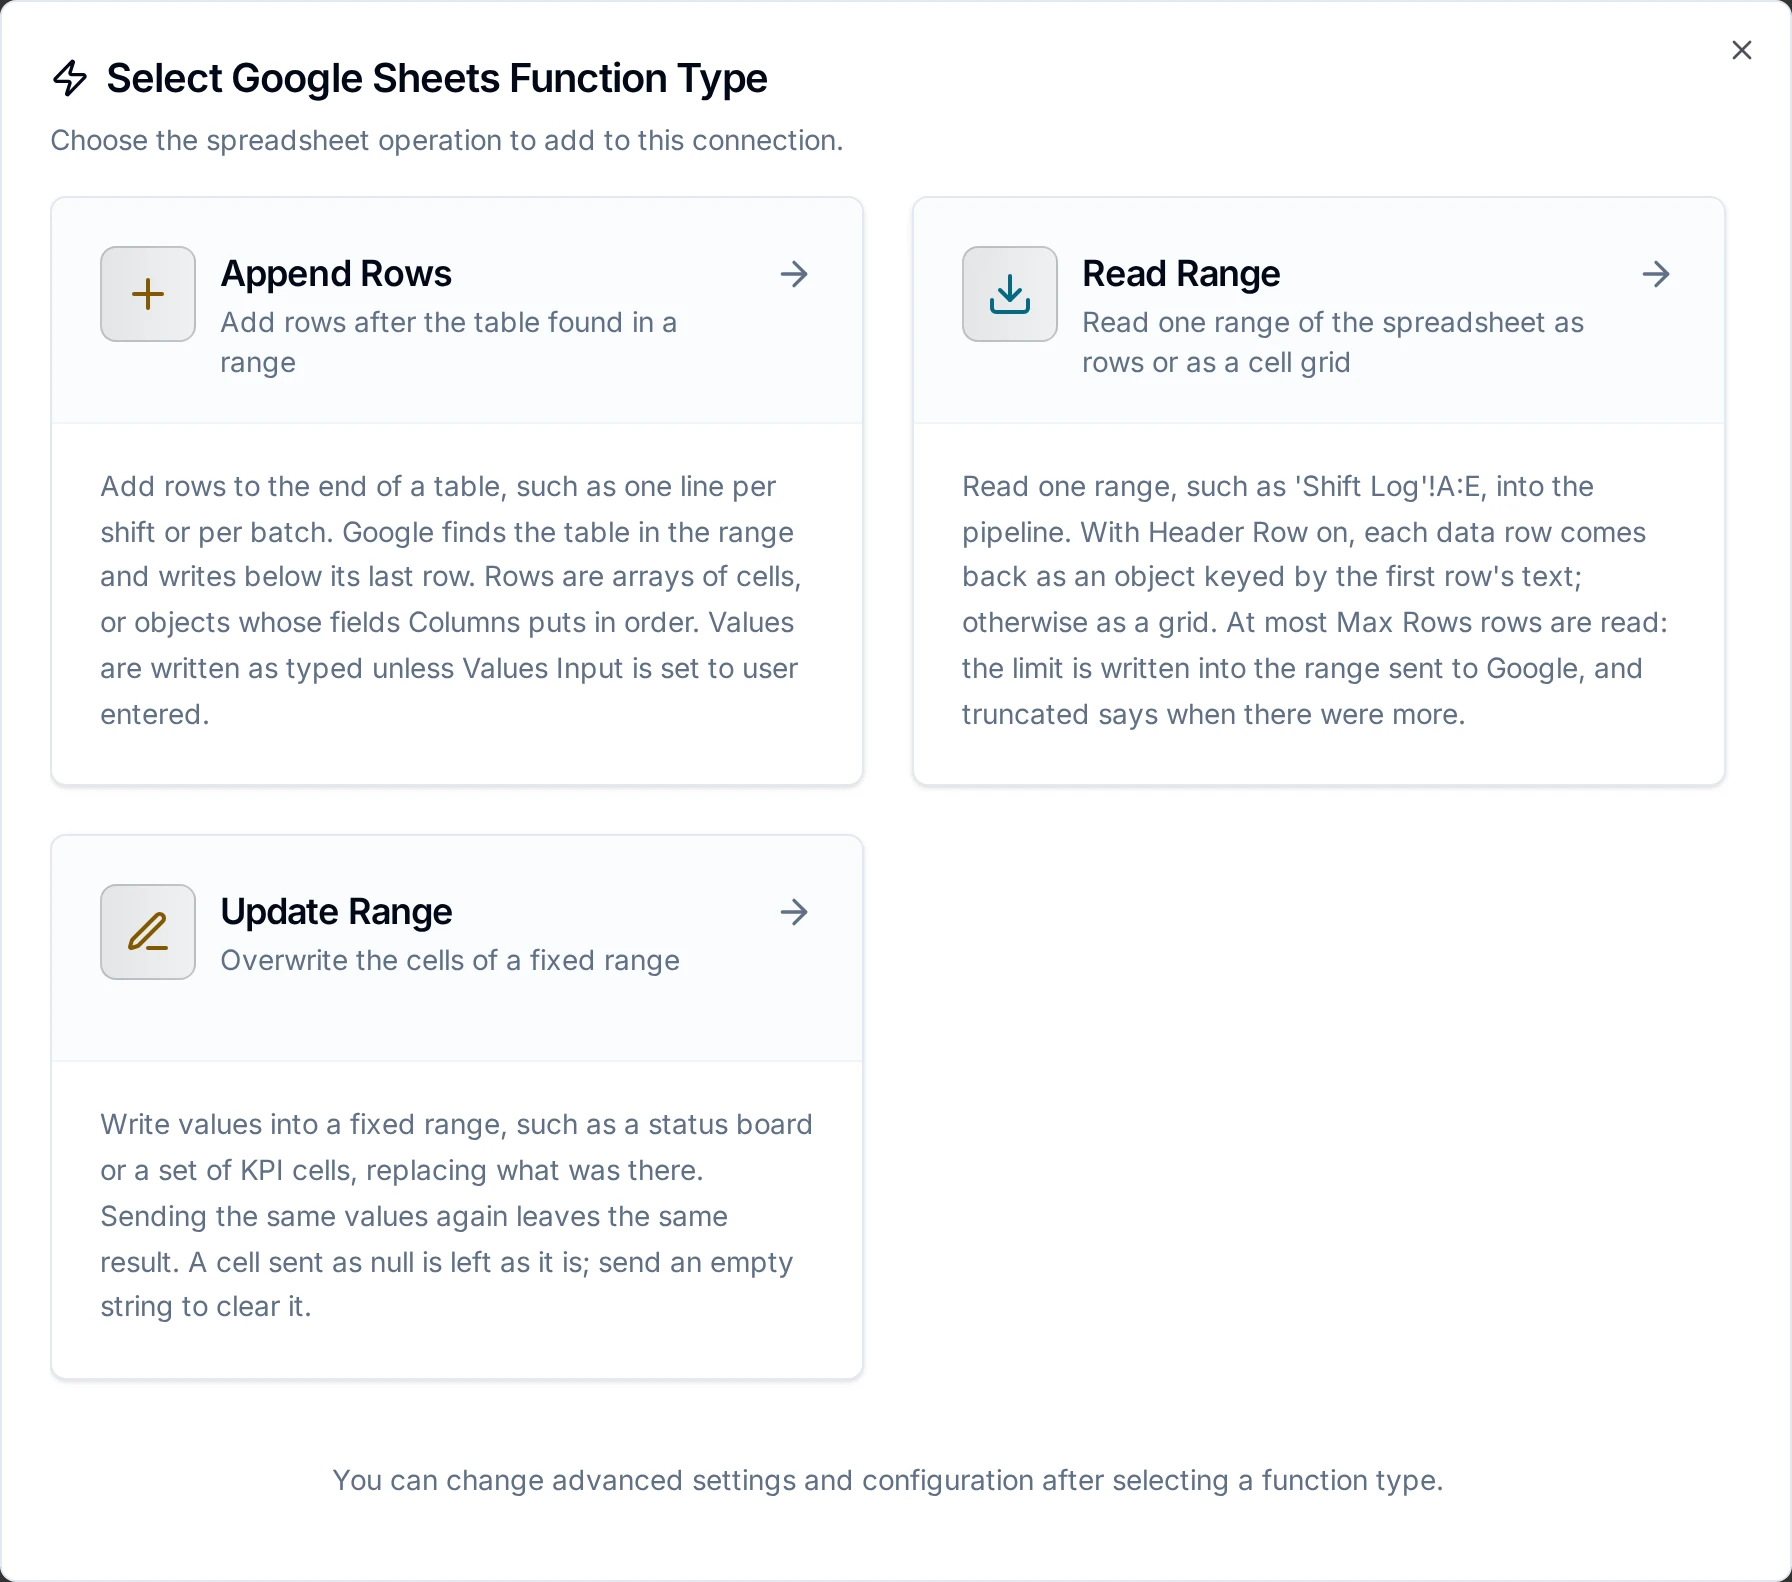
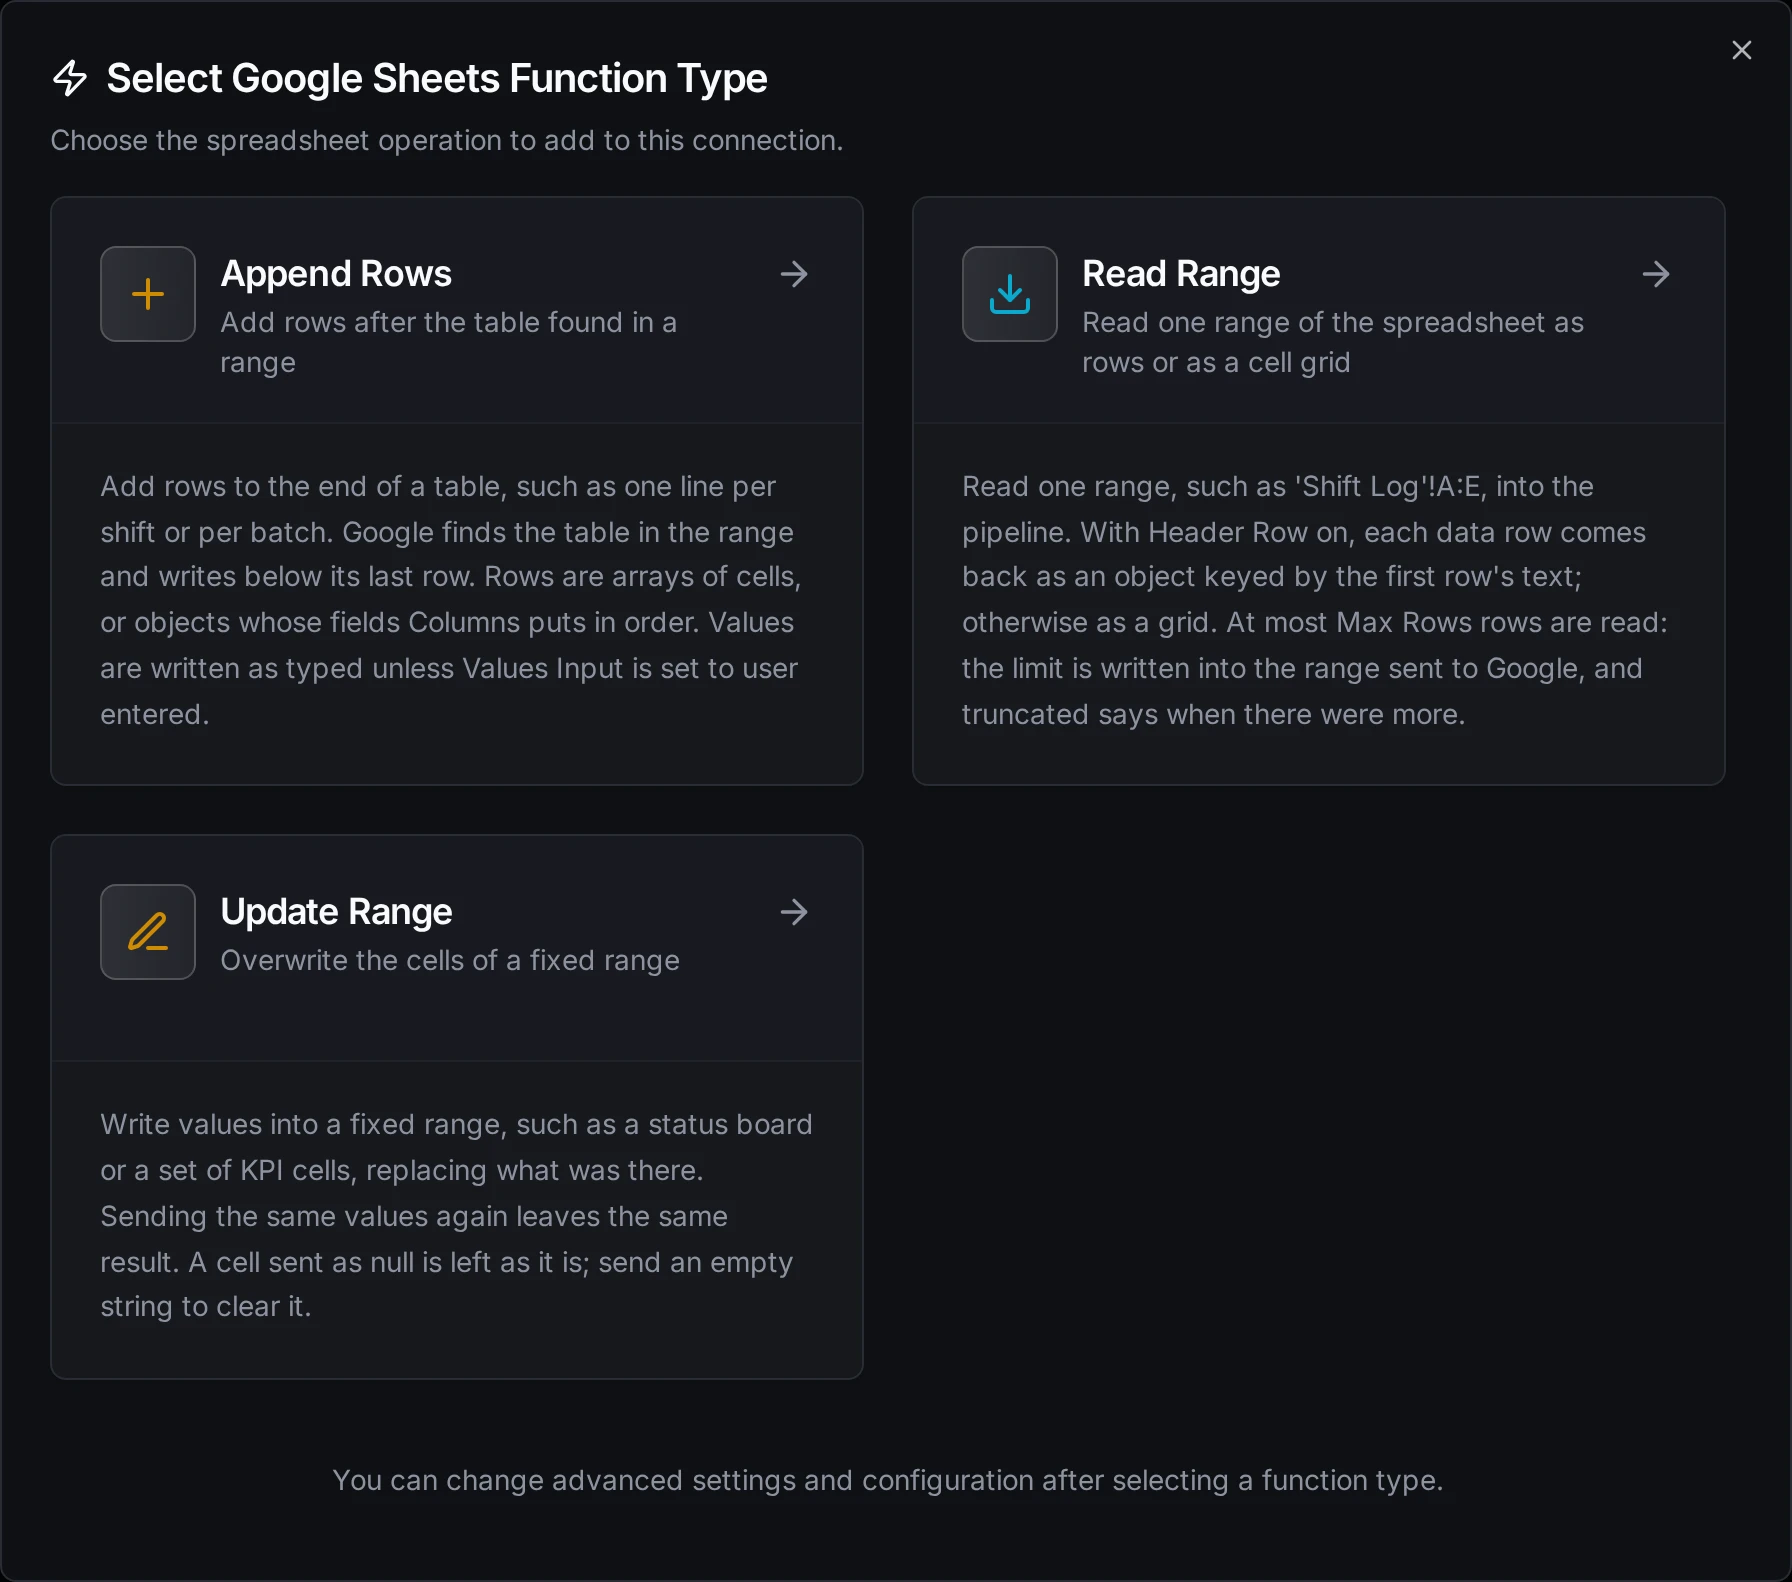
Read Range, Append Rows and Update Range
Ranges
Every operation takes a range in A1 notation:
| Range | Means |
|---|---|
'Shift Log'!A1:E50 | A block of cells |
'Shift Log'!A:E | Whole columns A to E |
'Shift Log'!A5:E | Columns A to E, from row 5 down |
'Shift Log'!1:10 | Rows 1 to 10 |
'Shift Log' | Every cell of the sheet |
A1:E50 | A block on the spreadsheet's first sheet |
A sheet name with spaces can be written with or without quotes (Shift Log!A:E works). A sheet whose name looks like a cell, such as Q1, must be quoted: 'Q1'!A:C. Named ranges are not supported; give the sheet and cells.
Read Range
Purpose: read one range into the pipeline.
| Field | Type | Required | Default | Description |
|---|---|---|---|---|
| Range | String | Yes | - | The range to read. Supports ((parameters)) |
| Header Row | Boolean | No | On | Use the range's first row as field names, so each data row comes back as an object |
| Max Rows | Number | No | 1000 | The most data rows to read (1-10000). The limit is written into the range sent to Google, so A:E with 1,000 rows asks for A1:E1002 (header, rows, and one more to tell whether there was more) |
| Values As | Enum | No | unformatted | unformatted: numbers and booleans as JSON values, dates as the sheet shows them. formatted: every cell as the text the sheet displays, in the spreadsheet's locale (1.234,5 in a German sheet). formula: formulas rather than their results |
| Timeout | Duration | No | 60s | Bound on this read (1s-3m) |
With Header Row on:
- Google leaves out trailing empty cells, so a short row is padded with
nullto the header's width. - Two columns with the same header, or data in a column with no header, fail the read rather than merging or dropping cells. Fix the header row, or turn Header Row off.
- Truncated in the result is
truewhen the range held more than Max Rows data rows.
Append Rows
Purpose: add rows to the end of a table, such as one line per shift.
| Field | Type | Required | Default | Description |
|---|---|---|---|---|
| Range | String | Yes | - | Where Google looks for the table, such as 'Shift Log'!A:E. Anchor it at the table's first column |
| Rows | JSON | Yes | - | An array of rows, each an array of cells: [["2026-11-02","A","BC-41",1840,12]]; or an array of objects placed by Columns: [{"Date":"2026-11-02","Good":1840}]. A single object is one row |
| Columns | String | When rows are objects | - | The field names in cell order, comma-separated: Date, Shift, Line, Good, Scrap. A field not listed is refused rather than dropped; a listed field an object lacks leaves its cell empty |
| Values Input | Enum | No | raw | raw stores values exactly as sent. userEntered parses them as if typed: numbers, dates and formulas |
| Insert New Rows | Boolean | No | On | Insert rows for the data, so nothing below the table is overwritten. Off writes into the empty rows below the table |
| Timeout | Duration | No | 60s | Bound on this append (1s-3m) |
Google finds "the table" by scanning the range for the last row with data. A blank row inside the data, or a note under the table, changes where the next row lands; tableRange and updatedRange in the result show where it went.
With raw, a value such as =IMPORTXML("https://…") coming from a device or a form stays text. With userEntered, Google evaluates it as a formula, which can fetch URLs or read other cells. Use userEntered only for data you control.
Appends are buffered through an outage (store-and-forward) and replayed in order. If a request times out after it reached Google, the rows may already be in the sheet, and the replay adds them again. For a log this shows as a duplicate line; Google has no way to recognise a repeated append.
Update Range
Purpose: overwrite the cells of a fixed range, such as a status board or a row of KPIs.
| Field | Type | Required | Default | Description |
|---|---|---|---|---|
| Range | String | Yes | - | The cells to overwrite, such as Status!B2:D4. Rows larger than an explicit range are refused before anything is sent |
| Rows | JSON | Yes | - | An array of rows, each an array of cells: [["Running", 1840]]. null leaves a cell as it is; "" clears it |
| Values Input | Enum | No | raw | As for Append Rows |
| Timeout | Duration | No | 60s | Bound on this update (1s-3m) |
Sending the same values to the same range again leaves the same result, so a replayed update is harmless; two updates of the same range are replayed in their original order.
Limits
One append or update writes at most 10,000 rows in one request, and lands whole or not at all. Google recommends keeping a request under 2 MB.
Using Parameters
Use ((parameterName)) in Range, Rows, Columns and Max Rows to bind values from the pipeline at run time, for example [["((date))", "((shift))", ((good)), ((scrap))]] or ((rows)) for an array built upstream.
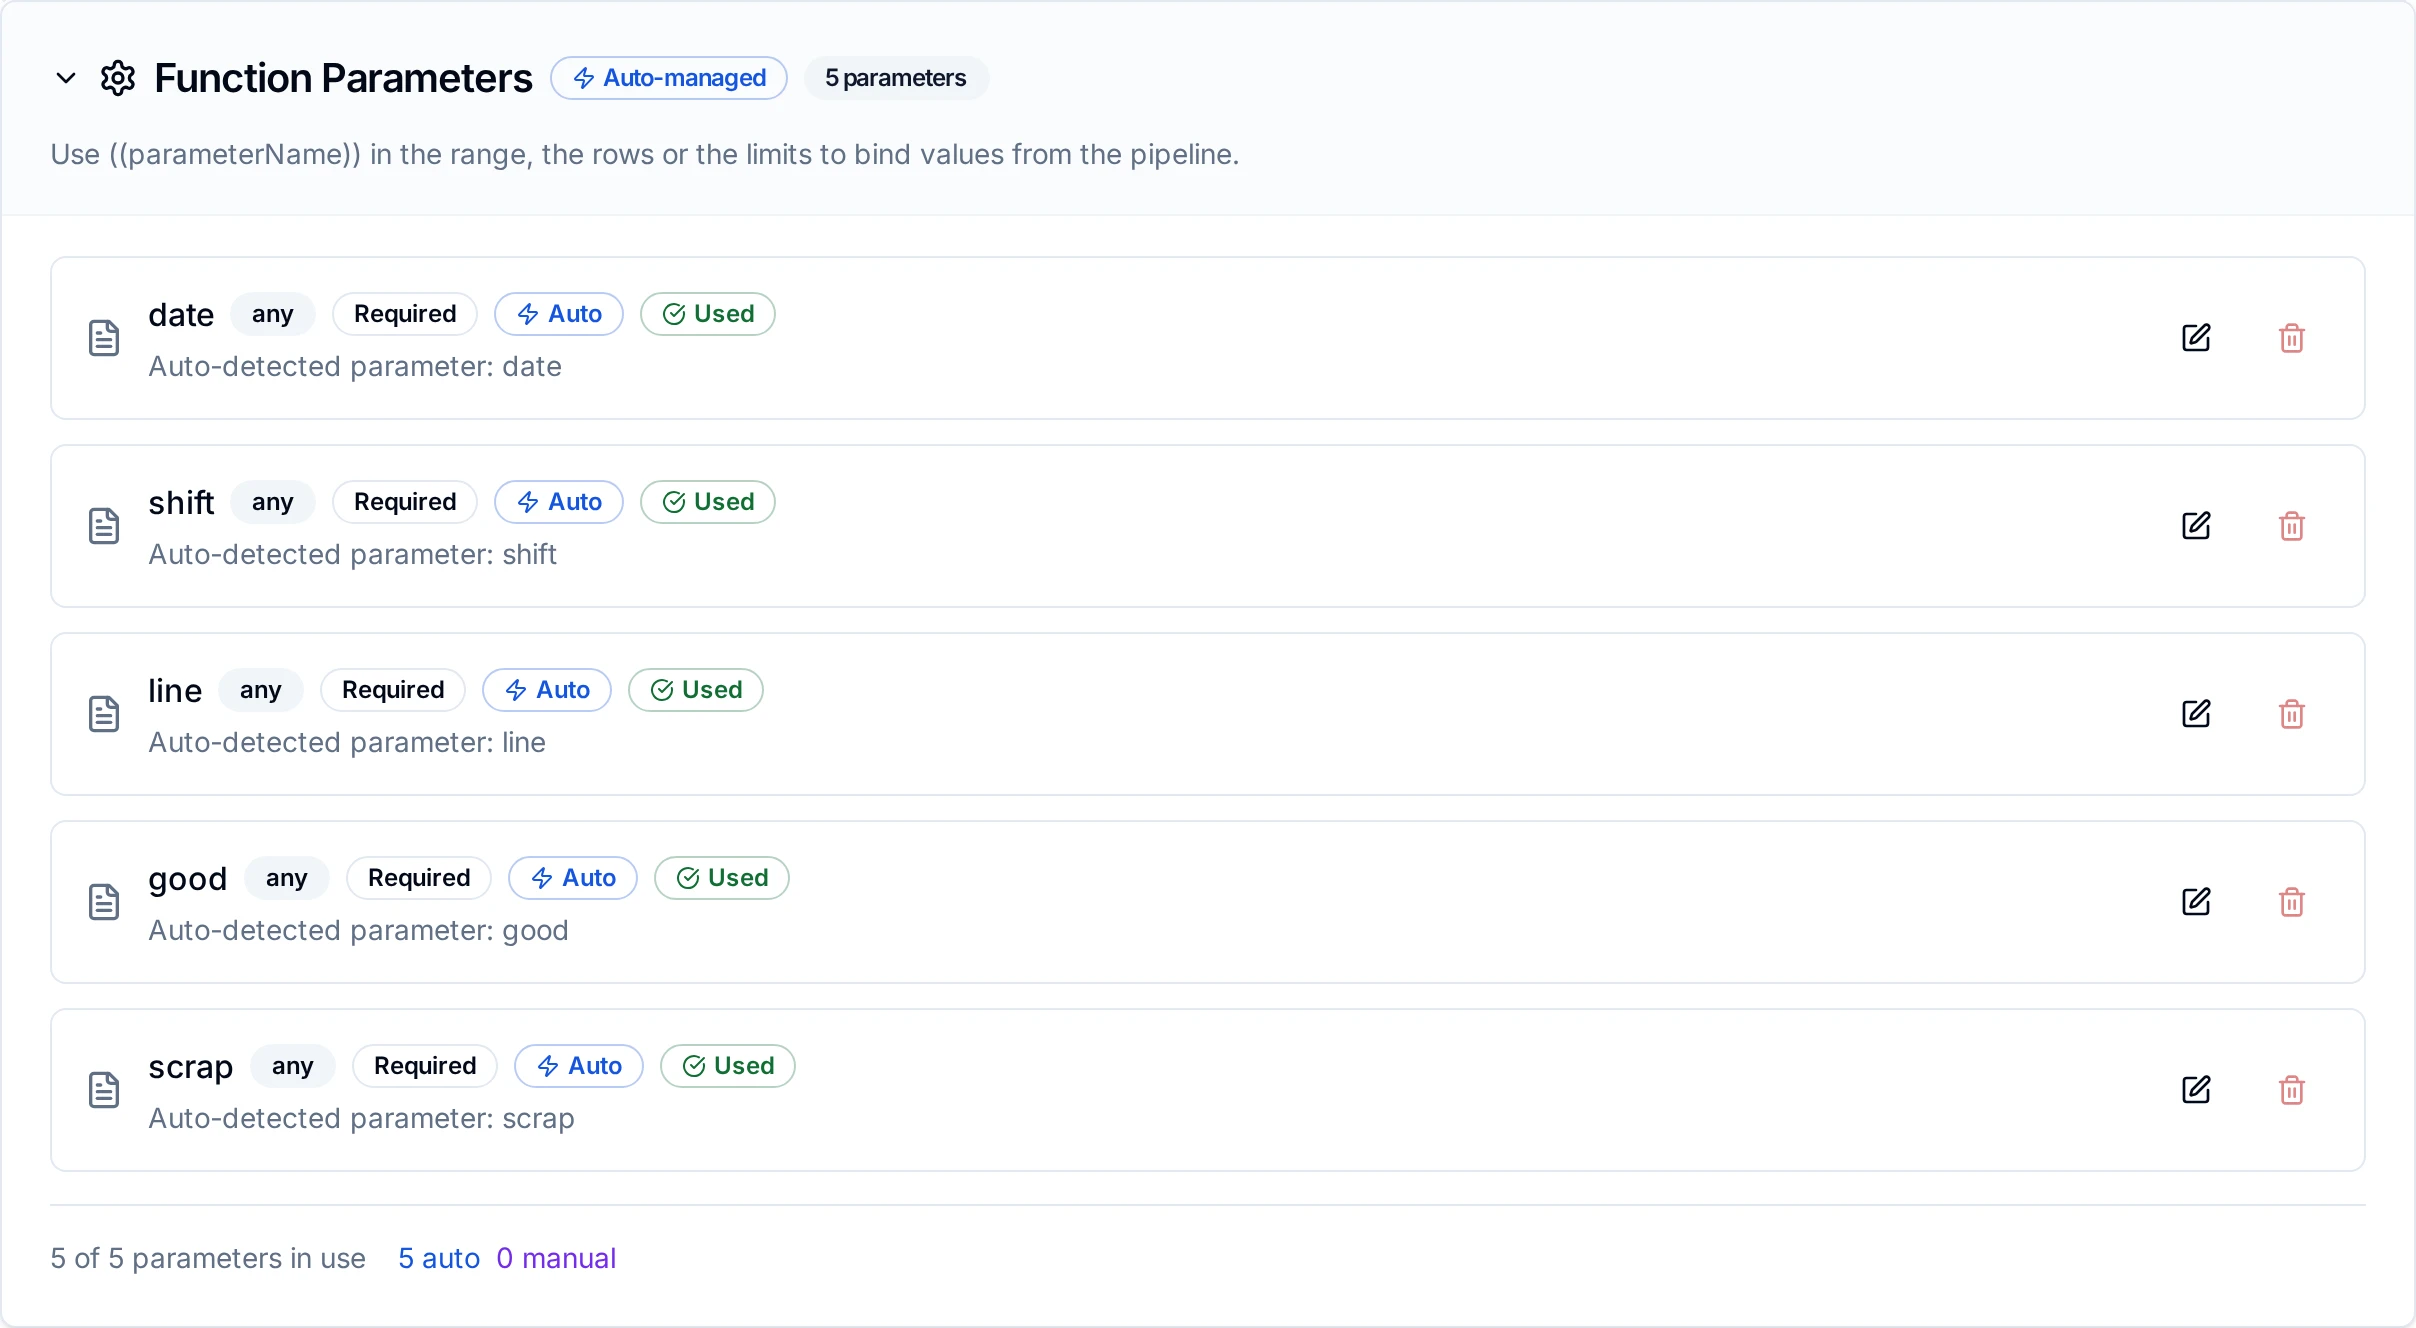
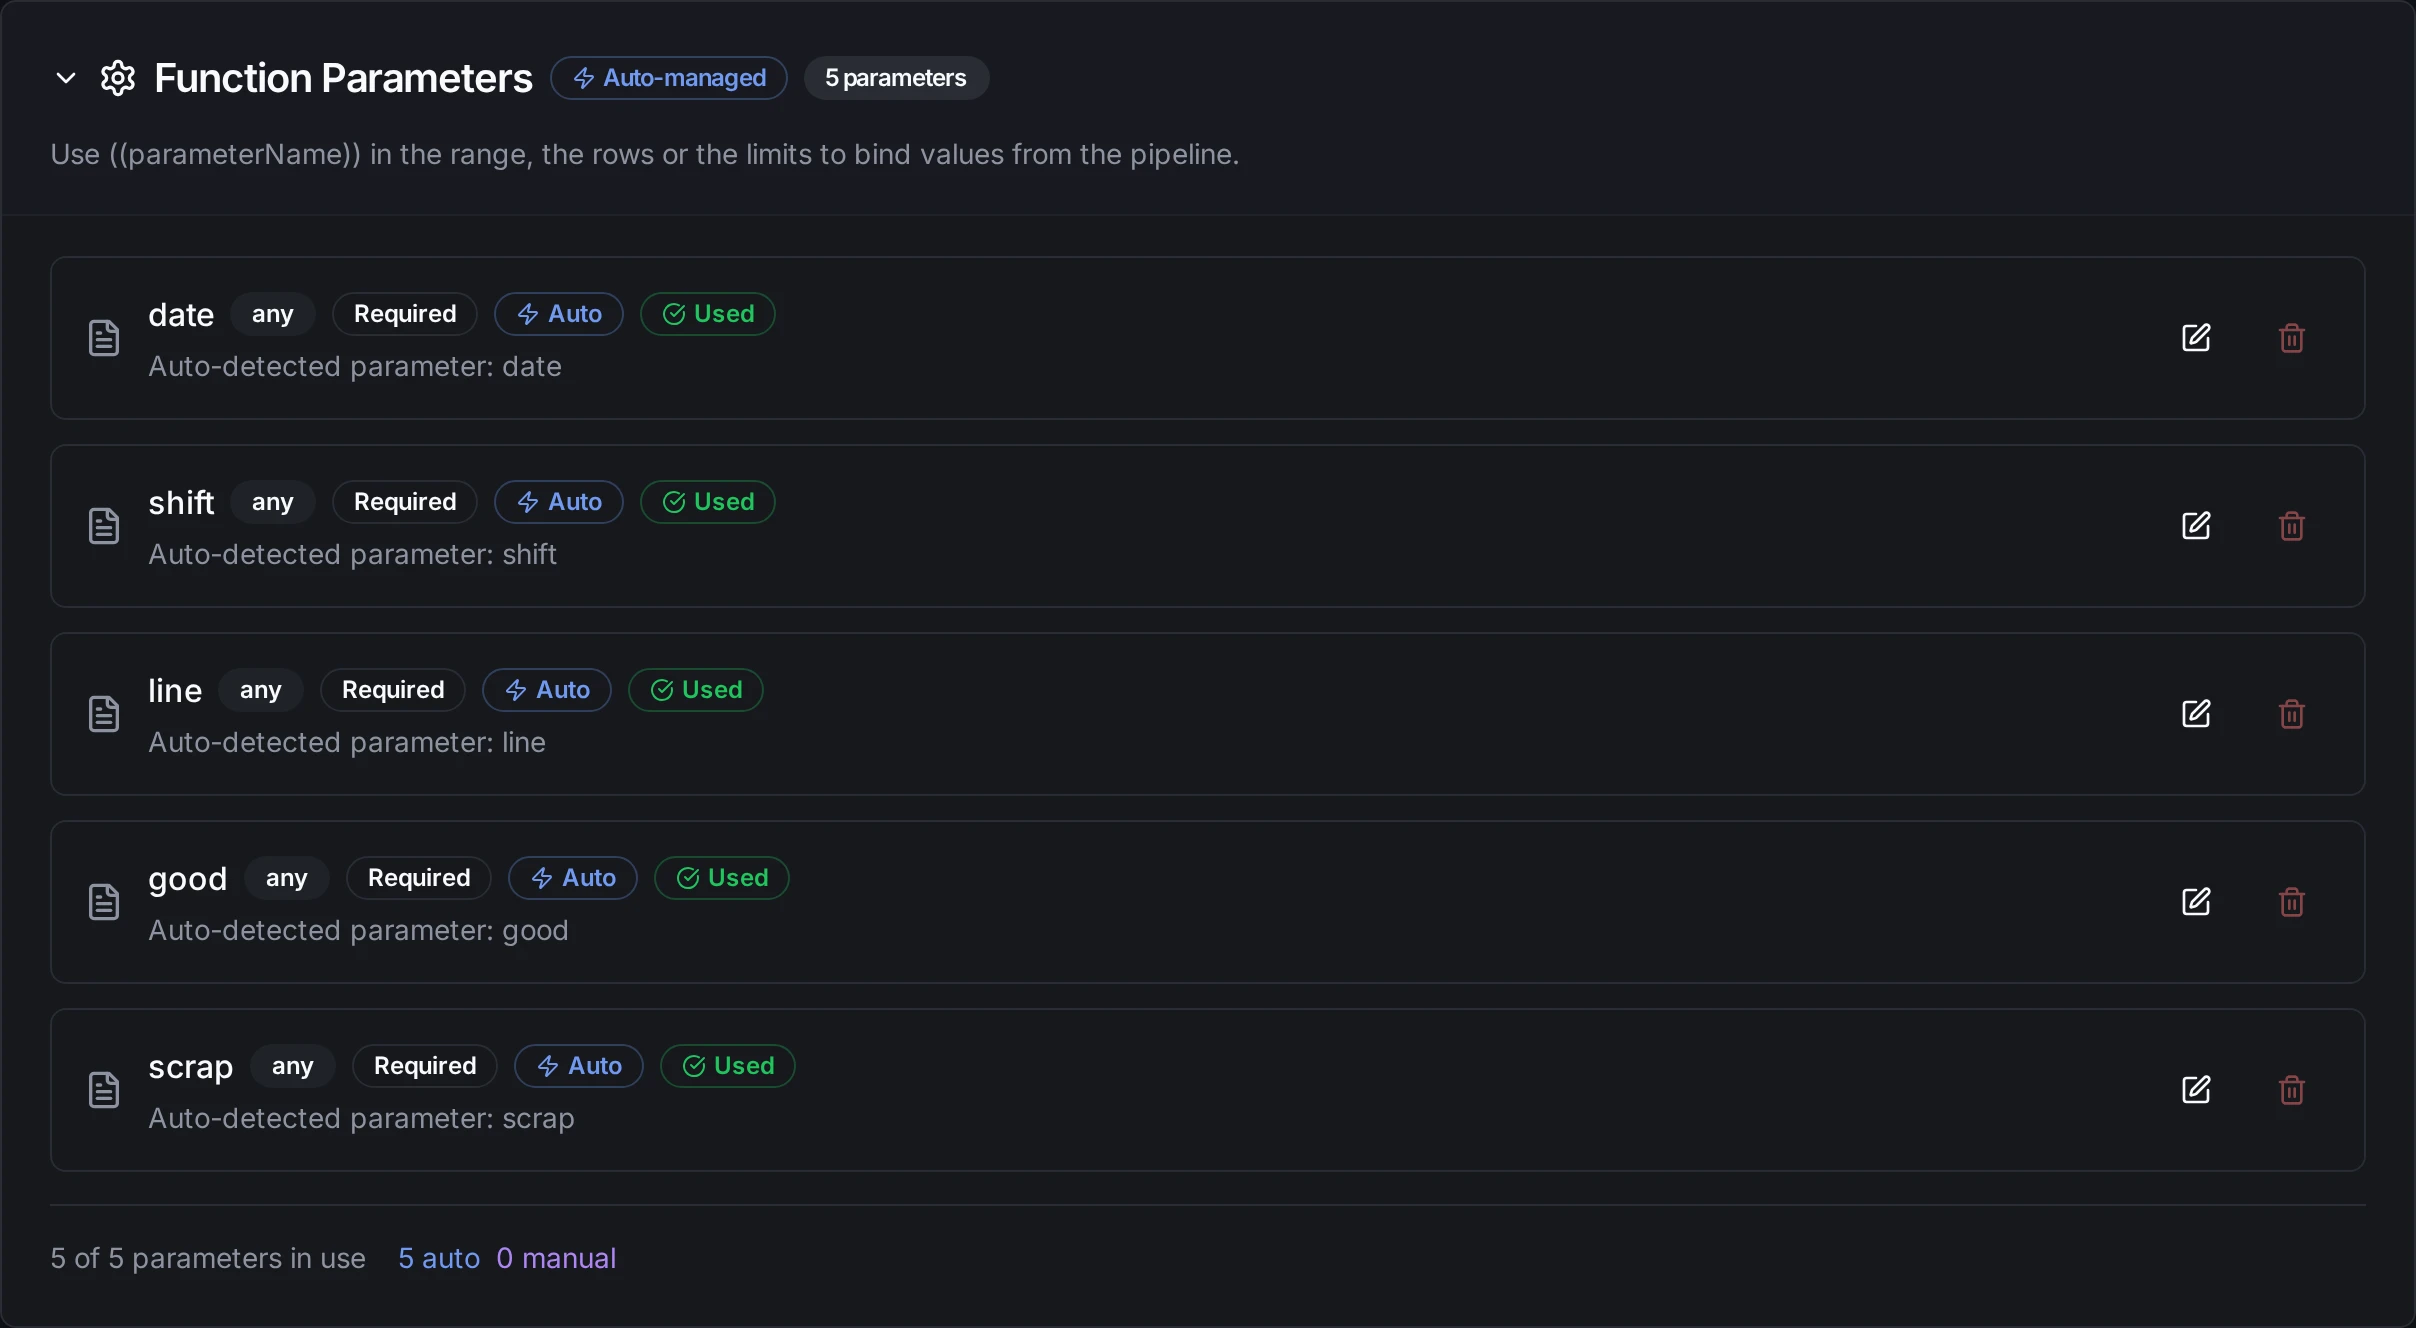
Parameters bound into the rows an append writes
Pipeline Integration
Each function you configure is a node in the Pipeline Designer, under Google Sheets. See the Google Sheets Nodes reference for the output of each node.
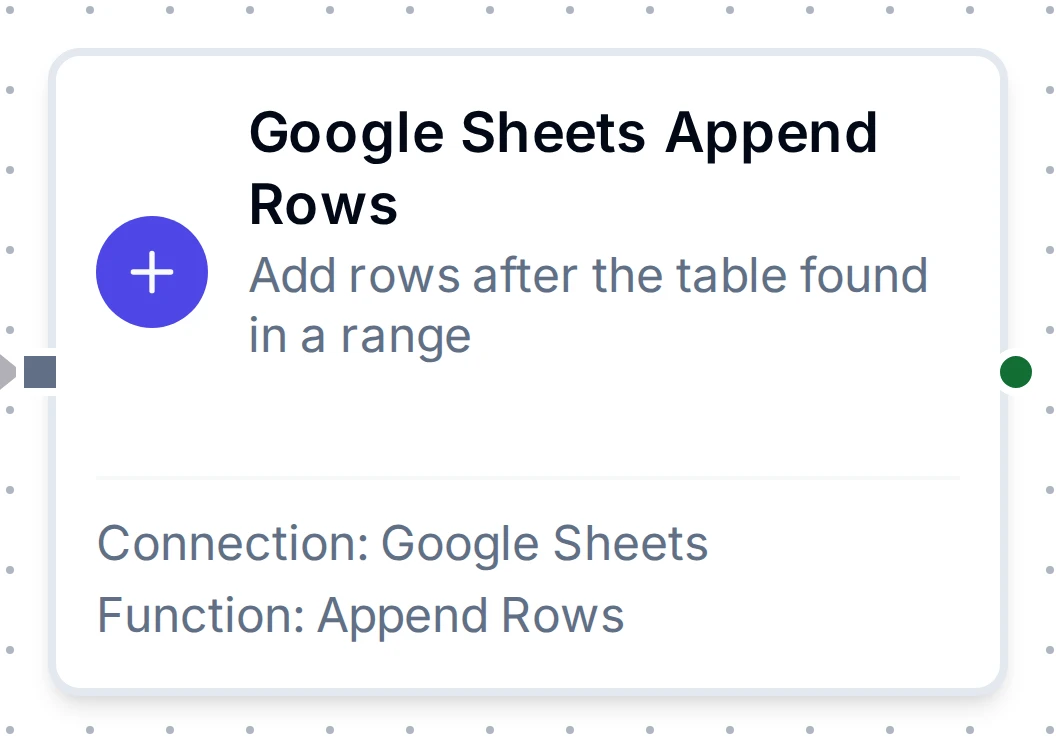
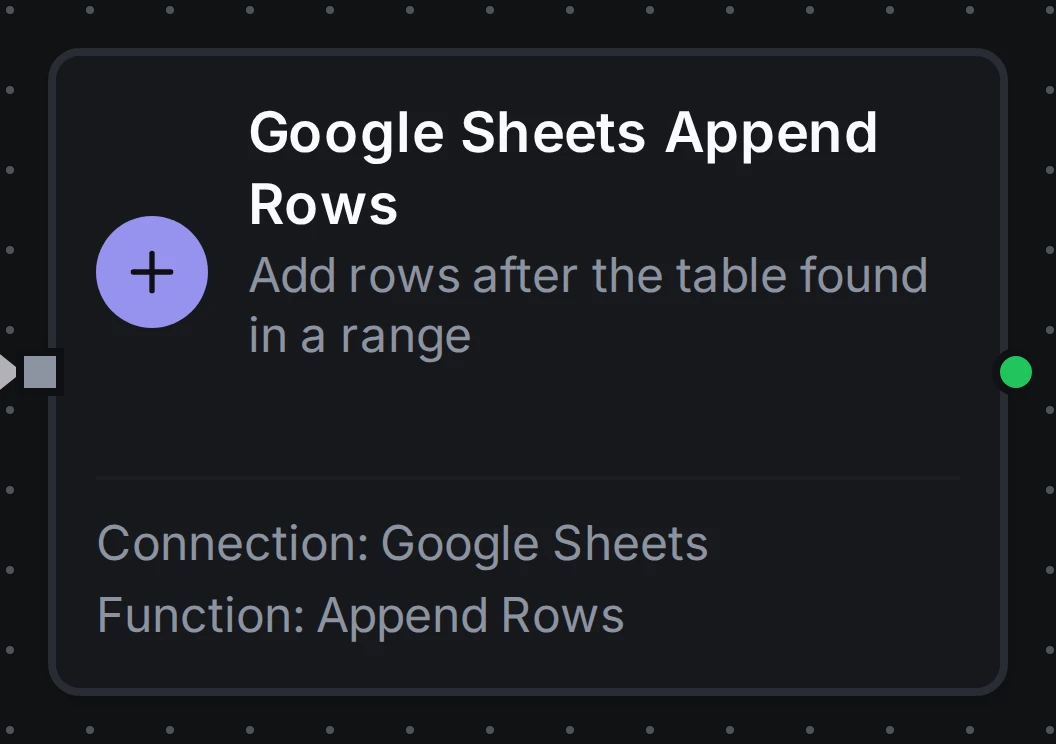
Google Sheets Append Rows node
Starting a pipeline from the sheet
There is no Google Sheets trigger. To run a pipeline when someone edits the sheet, have the spreadsheet call a Webhook trigger. In the spreadsheet, open Extensions → Apps Script and add:
function onSheetEdit(e) {
  const range = e.range;
  UrlFetchApp.fetch('https://maestrohub.example.com/api/v1/scheduler/webhooks/sheet-edits', {
    method: 'post',
    contentType: 'application/json',
    headers: { 'X-Webhook-Secret': 'replace-with-your-secret' },
    payload: JSON.stringify({
      sheet: range.getSheet().getName(),
      range: range.getA1Notation(),
      value: e.value,
    }),
  });
}
Then, in Apps Script, open Triggers → Add Trigger, choose onSheetEdit, event source From spreadsheet, event type On edit. A simple onEdit function cannot call external URLs; the installable trigger can. For a periodic push instead, choose a Time-driven trigger. The webhook's path and secret must match the trigger node's settings.
Common Use Cases
Shift log
At the end of each shift, a pipeline reads the line's counters and appends one row (date, shift, line, good, scrap) to a Shift Log sheet the plant manager already uses.
Lookup table
A pipeline reads Machines!A:C (machine ID, line, cost centre) once, and enriches incoming readings with the line and cost centre before they reach the historian.
Status board
Every minute, a pipeline writes each line's state and output into Status!B2:C10, so a sheet on a wall display always shows the current picture.
Troubleshooting
| Error contains | Cause | Fix |
|---|---|---|
The caller does not have permission … share the spreadsheet with … | The spreadsheet is not shared with the service account, or only as Viewer for a write | Share it with the email the error names: Viewer to read, Editor to write |
| … enable the Google Sheets API … | The API is disabled in the key's project | Enable Google Sheets API under APIs & Services → Library |
Requested entity was not found | The spreadsheet ID is wrong, or the spreadsheet was deleted | Paste the spreadsheet's URL again into Spreadsheet |
Unable to parse range … check the sheet name … | The sheet name in the range does not match a tab | Copy the tab name exactly; quote it if it looks like a cell ('Q1'!A:C) |
Quota exceeded … 60 reads and 60 writes per minute … | Too many requests per minute for this service account | The platform retries; for steady load, batch rows into fewer appends or use a second service account |
| … has data but no header … / … both have the header … | Header Row is on and the header row is incomplete or repeated | Fix the header row, or turn Header Row off |
| … rows but range … has … | An update sends more rows or cells than its range holds | Widen the range, or send fewer values |