Pipelines
Overview
A Pipeline in MaestroHub is a visual workflow that automates data processing and business logic. Pipelines combine nodes (building blocks) to create sophisticated automation without writing code. Each pipeline can be triggered manually or on a schedule, and includes built-in execution monitoring and debugging capabilities.
Navigation Path: Orchestrate > Pipelines
Creating a Pipeline
Click + New Pipeline to open the creation dialog. The dialog has two tabs: Basic Settings and Advanced Settings.
Basic Settings
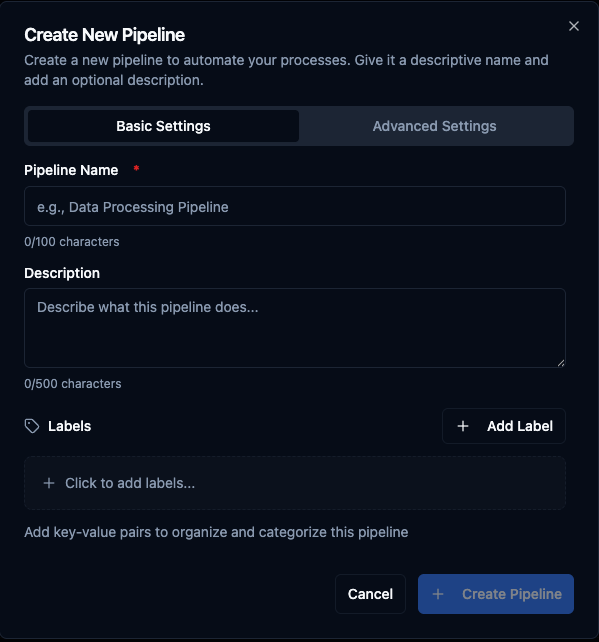
Basic Settings: pipeline name, description, and labels.
| Field | Required | Description |
|---|---|---|
| Pipeline Name | Yes | Unique name for your pipeline (3–100 characters). The system validates uniqueness in real time and suggests alternatives if the name is already taken. |
| Description | No | Describe what this pipeline does (max 500 characters). |
| Labels | No | Key-value pairs to organize and categorize the pipeline (e.g., environment:production, team:data-engineering, owner:mike.jones). |
Advanced Settings
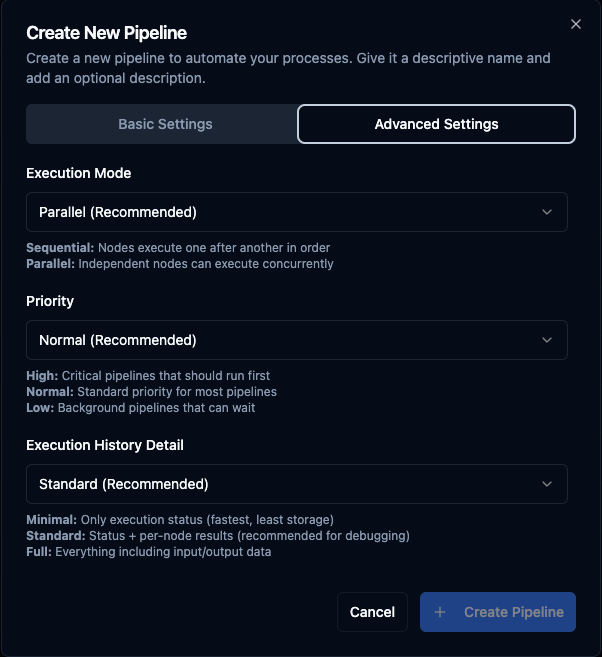
Advanced Settings: execution mode, priority, and execution history detail level.
| Field | Default | Options |
|---|---|---|
| Execution Mode | Parallel (Recommended) | Parallel — independent nodes execute concurrently. Sequential — nodes execute one after another in order. |
| Priority | Normal (Recommended) | High — critical pipelines that should run first. Normal — standard priority for most pipelines. Low — background pipelines that can wait. |
| Execution History Detail | Standard (Recommended) | Minimal — only execution status (fastest, least storage). Standard — status + per-node results (recommended for debugging). Full — everything including input/output data. |
After creating your pipeline, the application redirects you to the Pipeline Designer where you build your workflow.
Pipeline Designer
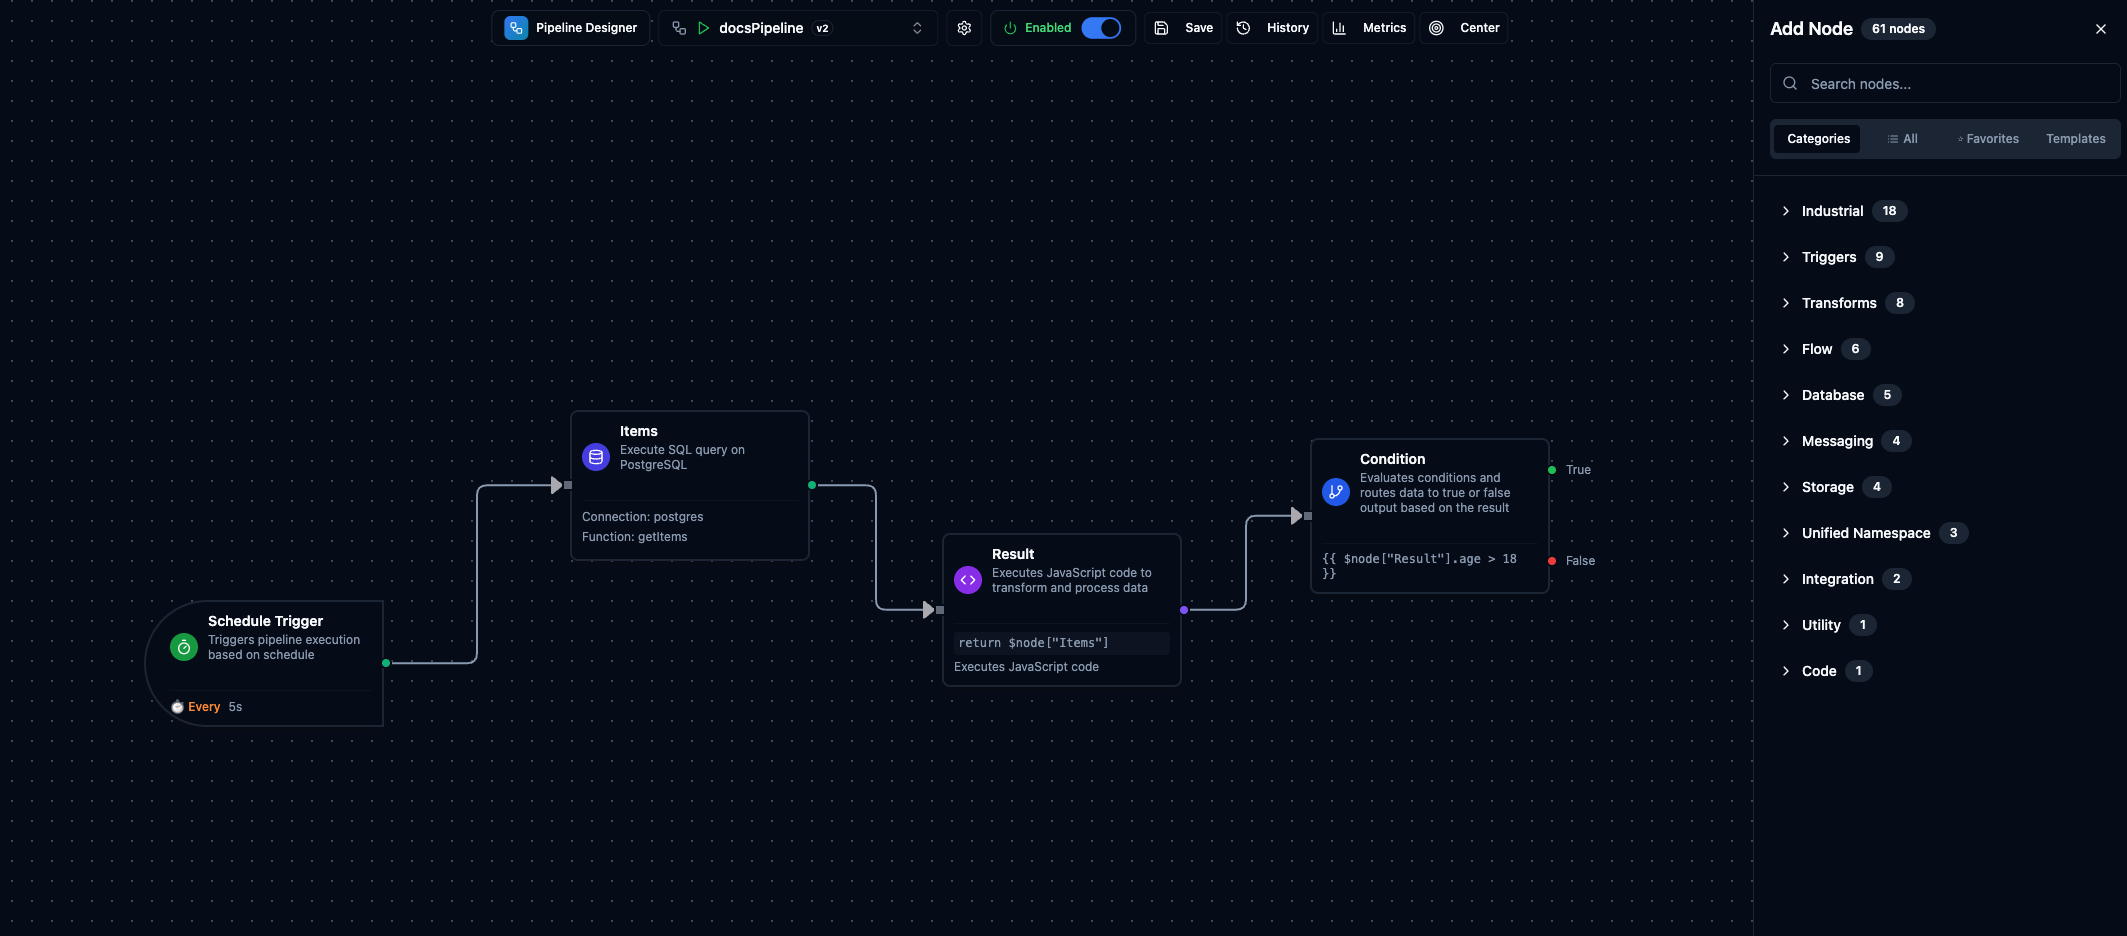
Pipeline Designer showing the toolbar, drag-and-drop canvas with nodes, and the Add Node panel.
The Pipeline Designer is a visual canvas where you build workflows by dragging nodes, drawing connections, and configuring logic. The canvas supports zoom, pan, multi-select, and a minimap for navigating large pipelines.
Toolbar
The toolbar at the top provides quick access to pipeline controls:
| Button | Description |
|---|---|
| Pipeline Selector | Dropdown to switch between pipelines without leaving the designer. |
| Enabled / Disabled | Toggle to activate or deactivate pipeline execution. |
| Save | Saves all changes. Shows a badge with the number of unsaved changes. |
| History | Opens the Execution History sidebar on the right. |
| Metrics | Opens the Pipeline Metrics panel with success rate, run counts, and percentile timings. |
| Center | Fits all nodes into view. |
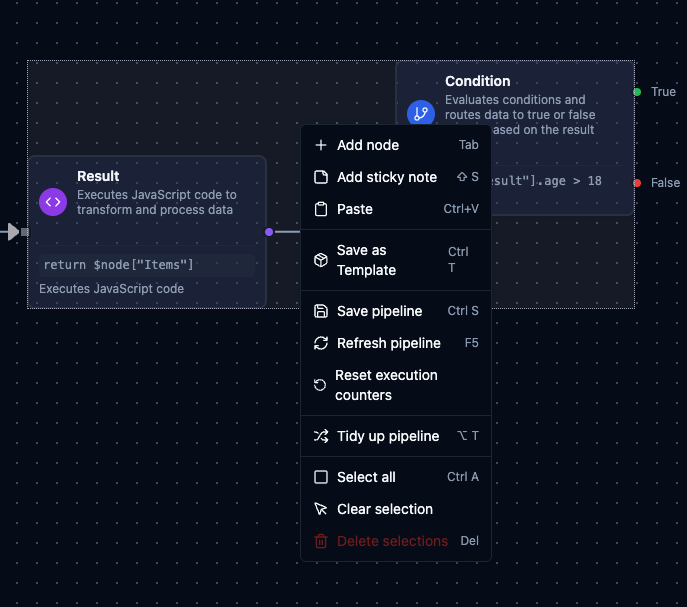
Context Menu
Right-click on the canvas to access common actions:
| Action | Shortcut |
|---|---|
| Add node | Tab |
| Add sticky note | Shift + S |
| Save as Template | Ctrl + T |
| Save pipeline | Ctrl + S |
| Refresh pipeline | F5 |
| Reset execution counters | — |
| Tidy up pipeline | Alt + T |
| Select all | Ctrl + A |
Test Pipeline
A floating Test Pipeline button lets you execute the pipeline on demand without leaving the designer. During execution, nodes update in real-time to show their current status.
Node Types
MaestroHub provides a growing library of nodes organized into categories. Open the Add Node panel (press Tab or click the + button) to browse and drag nodes onto the canvas.
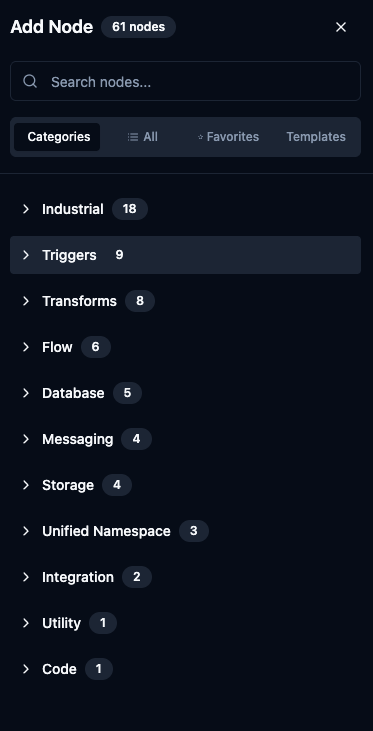
Add Node panel with Categories, All, Favorites, and Templates tabs.
| Category | Nodes | Examples |
|---|---|---|
| Industrial | 18 | OPC UA Read/Write, Modbus Read/Write, Siemens S7 Read/Write, OPC DA |
| Triggers | 9 | Manual, Schedule, MQTT, OPC UA, Webhook |
| Transforms | 8 | Set, Buffer, Merge, Group By, Serializer |
| Flow | 6 | Condition, For Each Loop, No Operation |
| Database | 5 | PostgreSQL, MSSQL, Oracle, InfluxDB |
| Messaging | 4 | MQTT Publish, MS Teams, SMTP |
| Storage | 4 | S3 Fetch, Local File |
| Unified Namespace | 3 | UNS Publish, UNS Subscribe, UNS Query |
| Integration | 2 | REST Request, Ignition Read |
| Utility | 1 | File Extractor |
| Code | 1 | JavaScript |
The node library grows continuously with new integrations and capabilities. For detailed documentation on specific node types, see the Nodes documentation.
Templates
Templates let you save a selected group of nodes and their internal connections as a reusable building block that can be dropped into any pipeline.
- Where to find: Open the Add Node panel and switch to the Templates tab.
- How to create: Select nodes on the canvas and use Save as Template from the right-click context menu (Ctrl + T).
Save as Template from the canvas context menu to create reusable building blocks.
Templates help you standardize common sub-flows (notification handlers, error-handling patterns, multi-step integrations) and reuse them across pipelines without rebuilding the same logic each time.
Node Configuration
Each node follows a standardized configuration structure with Basic Information, Parameters, and Settings tabs. When you select a node on the canvas, the configuration panel opens on the right side.
For detailed information about node configuration structure, error handling strategies, and best practices, see the Nodes documentation.
Execution History
Navigation: Orchestrate → Execution History
The Execution History page shows a global table of all pipeline executions across the entire system. Use it to search across pipelines, track specific runs, and monitor overall execution health.
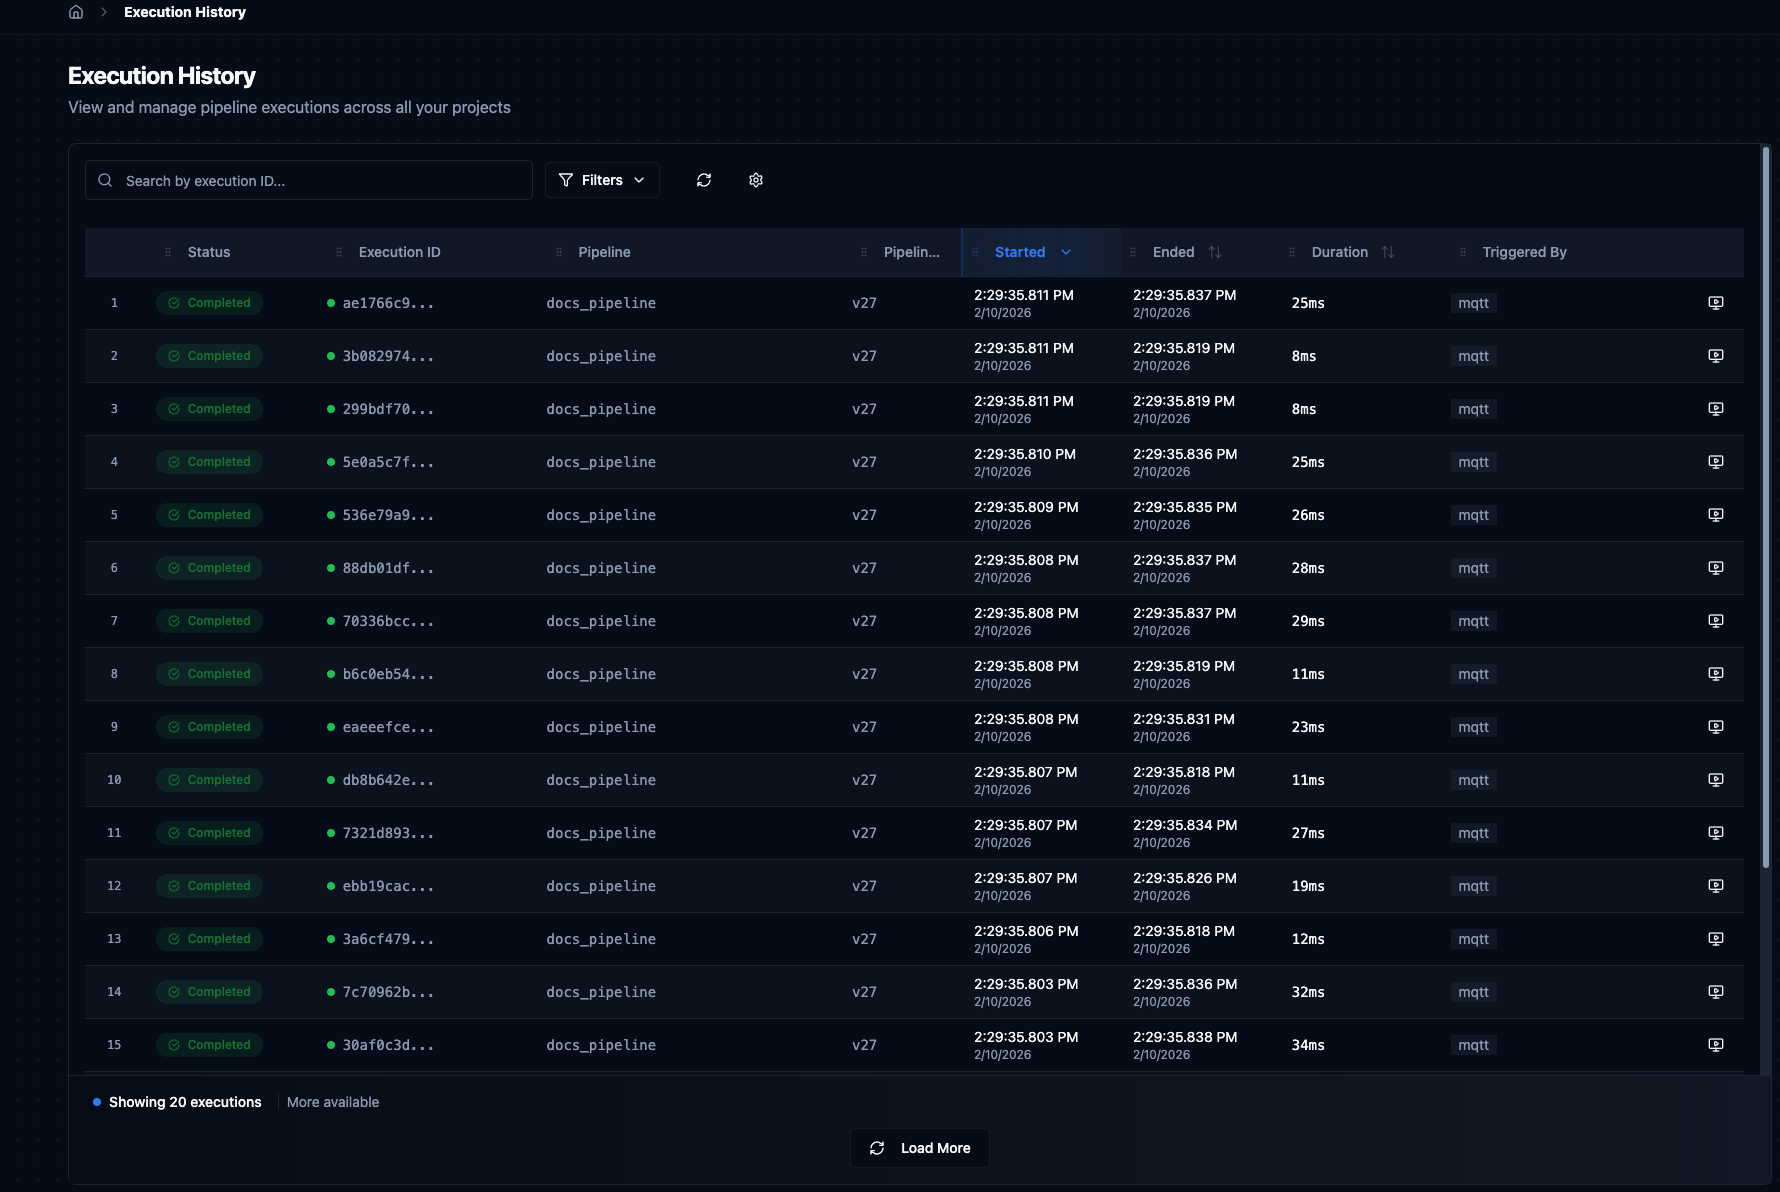
Execution History table showing recent pipeline runs with status, timing, and action buttons.
Table Columns
| Column | Description |
|---|---|
| Status | Color-coded badge — Completed, Completed with Errors, Failed, Running, Queued, or Cancelled. |
| Execution ID | Unique UUID. Click to copy to clipboard. |
| Pipeline | Name of the pipeline that ran. Click to open it in the designer. |
| Pipeline Version | Which version of the pipeline was executed (e.g. v37). |
| Started | Timestamp when execution began. Sortable. |
| Ended | Timestamp when execution finished. Shows "Still running..." for active executions. Sortable. |
| Duration | Total execution time. Color-coded: green under 1 minute, orange over 1 minute. Sortable. |
| Triggered By | How the execution was started — Schedule, Manual, Webhook, or Event. |
Filters
Click Filters to expand the Advanced Filters panel.
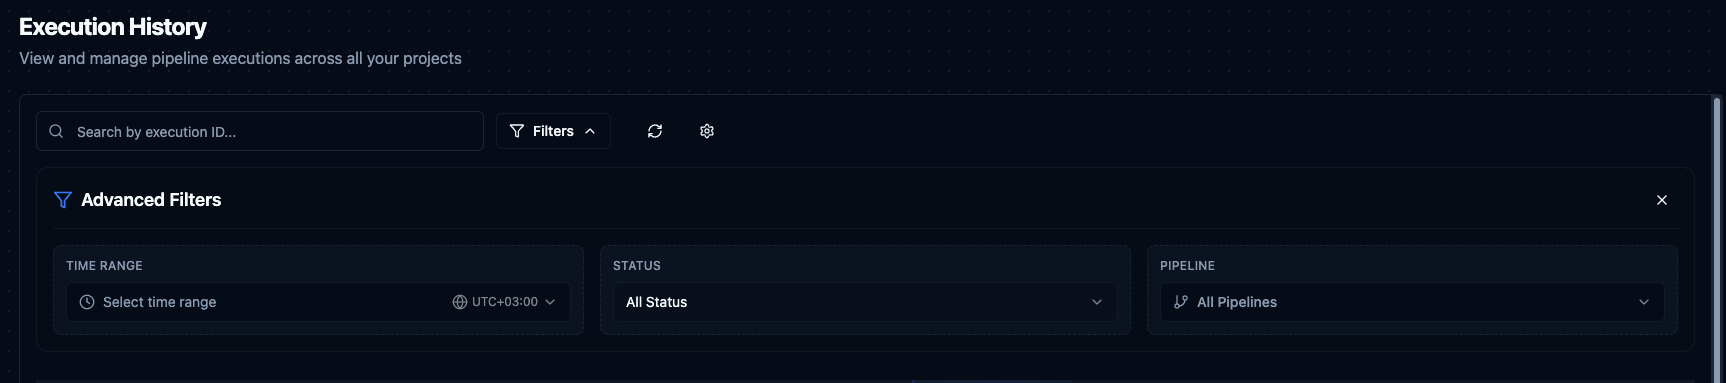
Advanced Filters: Time Range, Status, and Pipeline selectors.
| Filter | Description |
|---|---|
| Search | Search by execution ID with partial matching. |
| Time Range | Preset ranges (Last 1 hour, Last 24 hours, etc.) or custom date range with timezone support. |
| Status | Filter by status: All, Queued, Running, Completed, Completed with Errors, Failed, Cancelled. |
| Pipeline | Filter by a specific pipeline or show all. |
All filter and sort states persist in the URL, so you can share links with pre-applied filters or bookmark commonly used views.
Actions
| Action | Available When | Description |
|---|---|---|
| View on Canvas | Completed, Failed, Partial, Cancelled | Opens the execution in Execution Replay mode on the Pipeline Designer. |
| Retry | Failed | Reruns the pipeline with the same inputs. Creates a new execution instance. |
| Cancel | Running | Gracefully stops the execution. Completed nodes are preserved. |
Pagination
The table loads 20 executions by default. Click Load More at the bottom to fetch additional entries. Running and queued executions auto-refresh every 5 seconds.
Execution Replay
Select an execution from the History sidebar or click View on Canvas from the Execution History table to enter Execution Replay mode. This overlays the historical execution results onto the pipeline canvas so you can visually inspect what happened at each node.
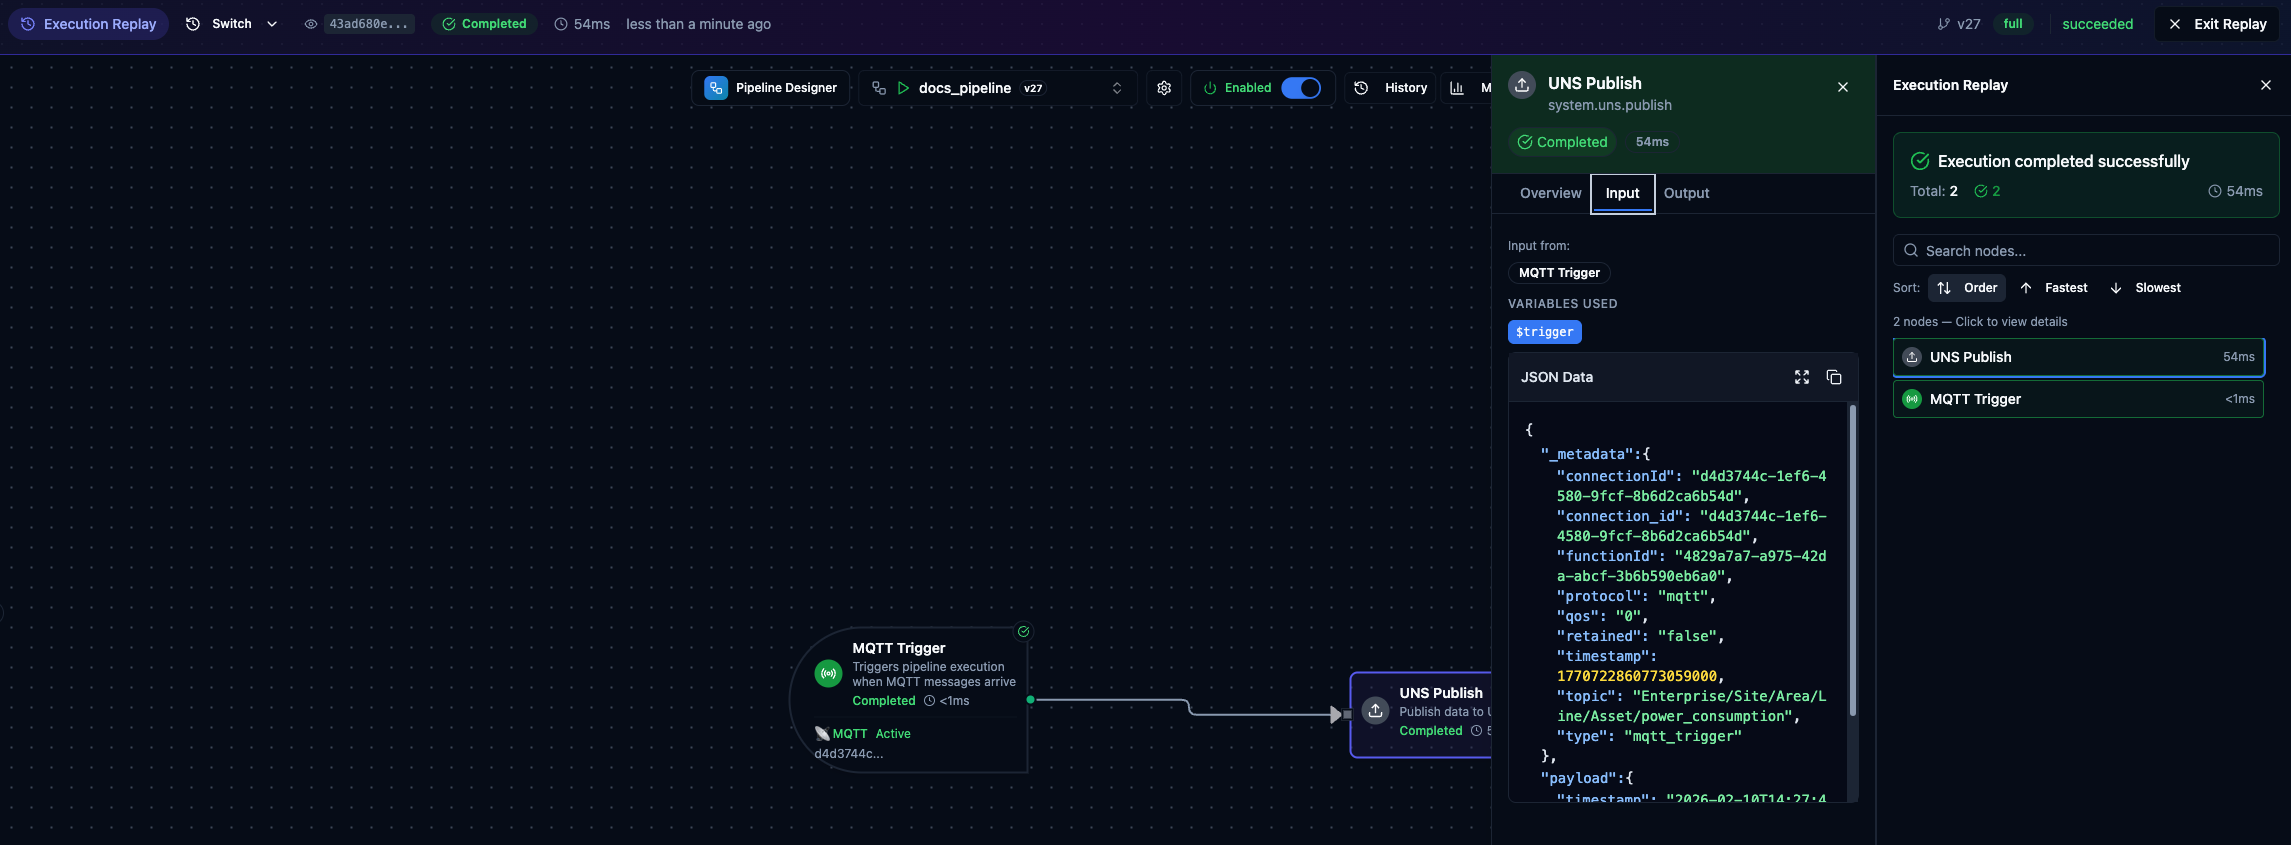
Execution Replay with node input/output inspector on the left and the node list on the right.
Replay header shows the Execution ID, status badge, duration, start time, pipeline version, and node statistics (success/failure counts). Click Exit Replay to return to normal editing mode.
Replay Node List on the right lists all nodes in the execution with their status and duration. Sort by Order (default), Fastest, or Slowest. Click a node to open its inspector panel.
Node Inspector shows:
- Overview — status, duration, and timing
- Input Data — the data the node received
- Output Data — the data the node produced
Shareable URL — when you enter Replay mode, the URL updates with ?execution={id}. Share this URL and the recipient will open the same execution directly in Replay mode.
Pipeline Metrics
Click Metrics in the Pipeline Designer toolbar to open a metrics panel showing real-time performance statistics for the current pipeline. The panel auto-refreshes every 5 seconds.
| Metric | Description |
|---|---|
| Success Rate | Percentage of successful executions with trend indicator. |
| Success / Failed | Counts of successful and failed executions. |
| Total Runs | Total number of executions. |
| Avg Time | Average execution duration. |
| P50 | Median execution time (50th percentile). |
| P95 | 95th percentile execution time. |
| P99 | 99th percentile execution time. |