Troubleshooting Guide
This guide walks you through the monitoring and diagnostic tools available in MaestroHub. Whether you need to verify a new connection, investigate a pipeline failure, or track system health over time, the sections below explain where to look and what each page provides.
Overview Dashboard
Navigation: Home
The Overview Dashboard is the first screen you see after logging in. It provides a real-time snapshot of three core subsystems in a single view: Connection Health, Pipeline Metrics, and UNS Status.

The Overview Dashboard with Connection Health, Pipeline Metrics, and UNS Status at a glance.
Connection Health
| Metric | Description |
|---|---|
| Connected | Number of active connections out of total (e.g. 4/10). |
| Current Issues | Connections that are not in a healthy state and need attention. |
| Failures (24h) | Total failure events in the last 24 hours, with state change count. |
| Activity | Total state changes across all connections in the last 24 hours. |
An Issues Detected badge appears in the header when one or more connections require attention. Click the refresh button to update the data manually.
Pipeline Metrics
| Metric | Description |
|---|---|
| Active Pipelines | Number of pipelines with recent execution activity. |
| Total Executions | Cumulative execution count with throughput (runs/sec). |
| Success Rate | Percentage of successful executions, with success and failure counts. |
| Current Load | Number of executions currently in progress. |
A time indicator shows how long the system has been collecting metrics (e.g. "Since: 3m 14s ago") and an All-time toggle lets you view lifetime statistics.
UNS Status
| Metric | Description |
|---|---|
| Broker | Health status and type of the MQTT broker (e.g. external). |
| Storage | Health status and backend (e.g. timescale). |
| Topics | Total topic count with active topic count. |
| Uptime | Time elapsed since the last UNS service restart. |
A Healthy badge in the header confirms that the UNS subsystem is operating normally.
System Logs
Navigation: System Management → Logs
Overview
The System Logs page gives you centralized access to log records from all MaestroHub backend services. Use it to verify operations, diagnose errors, trace execution flows, and monitor service health.
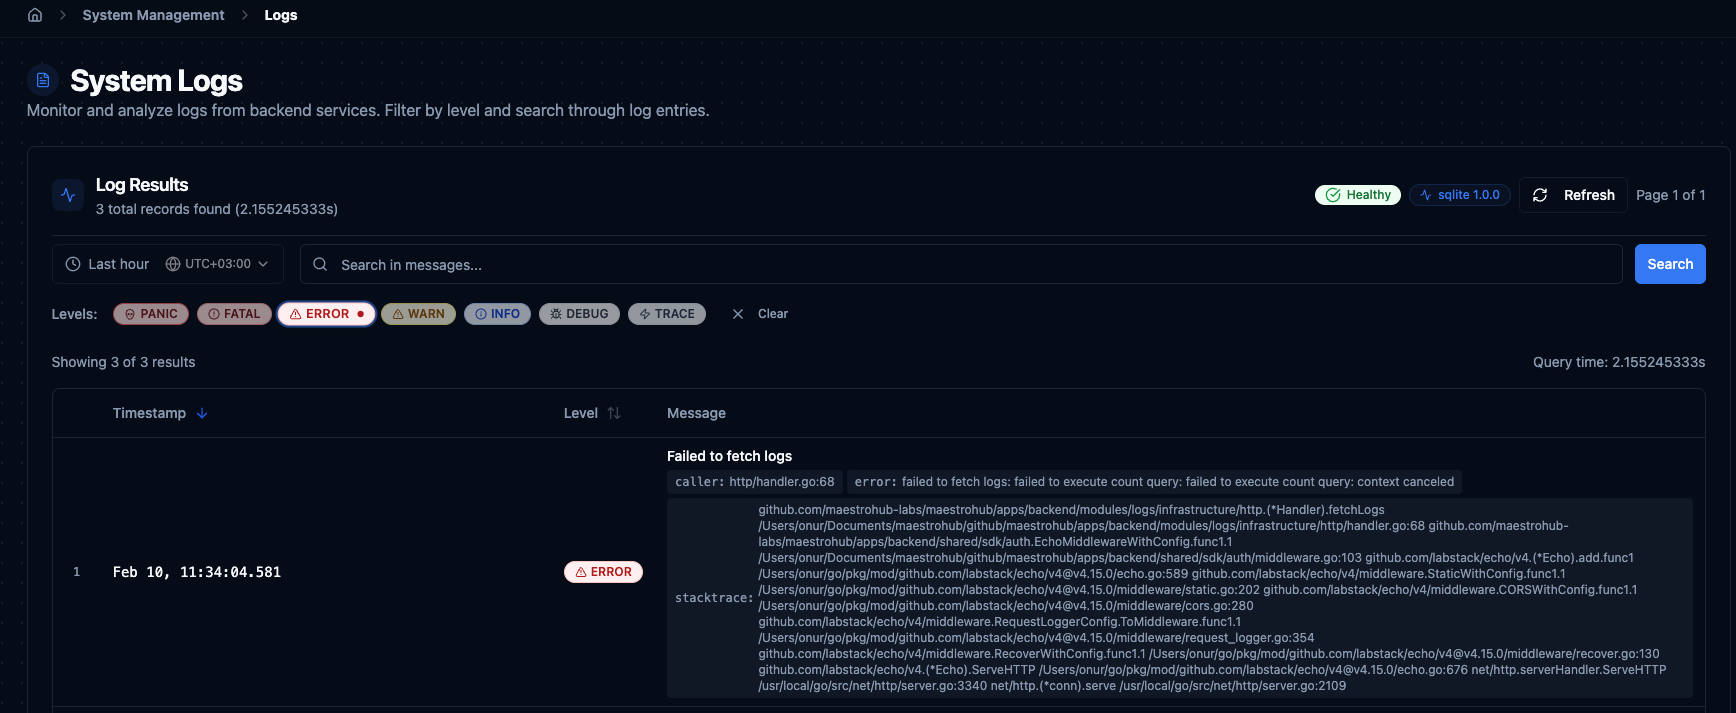
System Logs viewer with time range, search, level filter chips, and paginated results.
Time Range
Every log query requires a time range. Presets are available for quick selection, or you can define a custom window.
| Preset | When to Use |
|---|---|
| Last 15 minutes | Quick check for recent activity or to verify an operation you just performed. |
| Last hour | Standard troubleshooting starting point when you are not sure when the issue occurred. |
| Last 6 hours | Investigating intermittent or recurring problems that do not appear in shorter windows. |
| Last 24 hours | Full-day analysis for pattern recognition or investigating issues reported hours ago. |
| Custom range | Specify exact start and end date/time for precise investigation. |
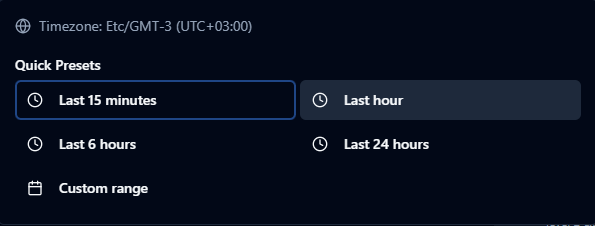
Time range presets and custom range picker for filtering logs.
The custom range picker includes a calendar for date selection, hour/minute/second fields, quick-set buttons (00:00:00, 12:00:00, 23:59:59), and timezone display with UTC offset.
Search
The search bar searches across all log message content. Type a keyword or phrase and press Enter. Search is case-insensitive and works together with level filters and the selected time range — all criteria apply simultaneously. Clear the search with the X button to reset results.
Level Filter Chips
Below the search bar, clickable level chips filter logs by severity. Multiple levels can be selected at the same time. When no level is selected, all levels are shown.

Level chips: PANIC, FATAL, ERROR, WARN, INFO, DEBUG, and TRACE.
| Level | Description | When to Focus |
|---|---|---|
| PANIC | System-wide failure that may cause the service to become unresponsive. | Immediate investigation. Rare but critical. |
| FATAL | Critical failure that stops a service component. | Immediate investigation. Check whether the affected function is required for your workflow. |
| ERROR | Operation failures — failed connections, execution errors, timeouts. | Primary troubleshooting level. Start here when diagnosing issues. |
| WARN | Potential problems — retry attempts, deprecation warnings, approaching limits. | Monitor regularly. Warnings often precede errors. |
| INFO | Normal operations — successful connections, completed executions, status updates. | Use to confirm expected behaviour. |
| DEBUG | Detailed internal diagnostics — request/response payloads, intermediate steps. | Deep troubleshooting when ERROR and WARN lack context. |
| TRACE | Step-by-step execution traces at the lowest level. | Specific deep investigations only. Very high volume. |
Log Table
| Column | Description |
|---|---|
| Timestamp | When the event occurred, in MMM DD, HH:mm:ss.SSS format. Sortable. |
| Level | Severity badge with color coding. Sortable. |
| Message | Primary log content describing what happened. |
Below the message, log entries may display additional context tags:
| Tag | Purpose |
|---|---|
connection_id / connection_name | Identify the connection involved. |
pipeline_id / pipeline_name | Identify the pipeline involved. |
execution_id | Trace a single pipeline execution end-to-end. |
node_id / node_name | Identify the specific node that produced the log. |
duration | How long the operation took. |
error | Detailed error description or stack trace. |
Pagination
| Setting | Value |
|---|---|
| Page size options | 50, 100 (default), 250, 500 records per page |
| Maximum result window | 10,000 records — when reached, an orange "10K limit reached" badge appears and further pagination is disabled |
| Data freshness | Logs are considered fresh for 10 seconds; after that, interacting with the page triggers a background refresh |
If you hit the 10,000 record limit, narrow the time range, add level filters, or use specific search terms to reduce the result set.
Pipeline Troubleshooting
MaestroHub provides several tools for monitoring and debugging pipelines directly from the Pipeline Designer canvas: an Execution History sidebar, an Execution Replay mode, a Pipeline Metrics panel, and detailed execution dialogs.
Execution History Sidebar
Navigation: Pipeline Designer → History button (toolbar)
Click History in the pipeline toolbar to open a sidebar on the right showing all executions for the current pipeline. The sidebar auto-refreshes every 10 seconds with a visible countdown timer.
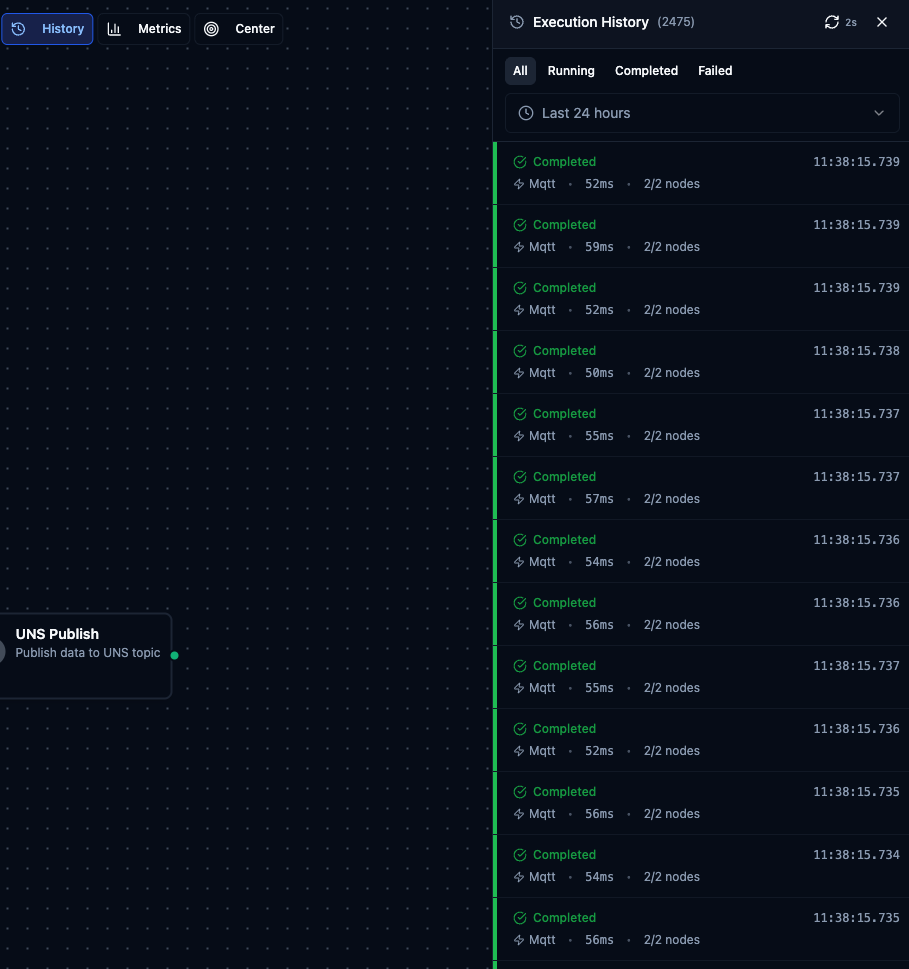
Execution History sidebar showing recent pipeline runs with status, trigger type, duration, and node counts.
Filters: Use the status tabs (All, Running, Completed, Failed) and the time range dropdown (default: last 24 hours) to narrow the list.
Each execution row shows:
- Status indicator — colored stripe on the left (green = Completed, red = Failed, blue = Running, yellow = Partial, gray = Queued, orange = Cancelled)
- Time — when the execution started, with full date in tooltip
- Trigger type — Manual, Webhook, or Schedule (shown as icon)
- Duration — total execution time; "Running..." animation for active executions
- Node statistics —
X/Y nodescompleted, with failed count in red if any - Error preview — first 60 characters of the error message for failed executions
Click an execution to select it, then use View on Canvas to enter Execution Replay mode. The sidebar loads 30 executions by default; click Load More to fetch additional entries.
Execution Replay
Select an execution from the sidebar and click View on Canvas to enter Execution Replay mode. This overlays the historical execution results onto the pipeline canvas so you can visually inspect what happened.
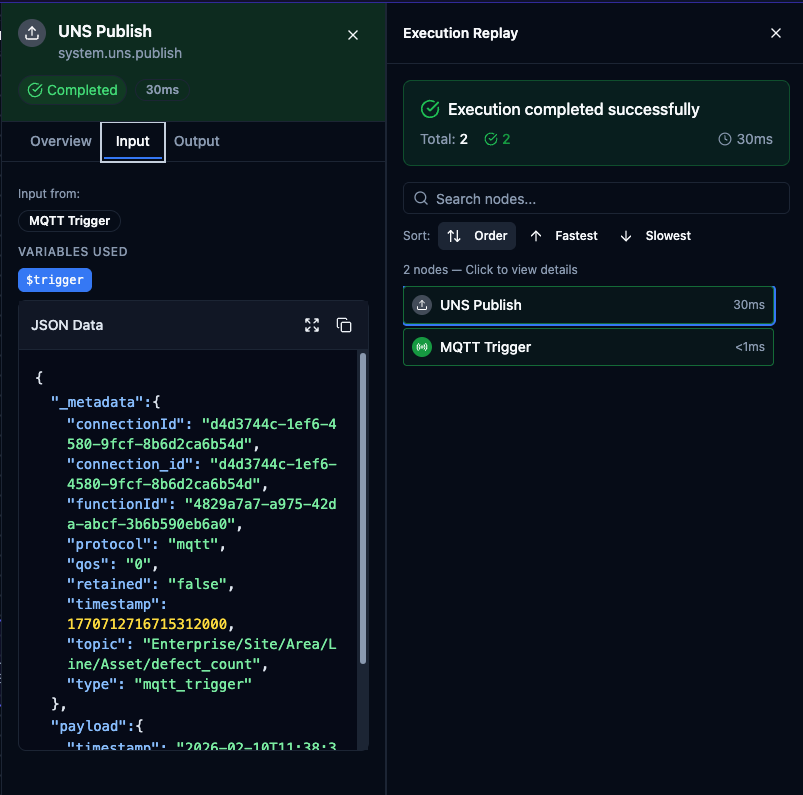
Execution Replay showing node input/output data on the left and the node list on the right.
Replay header shows the Execution ID, status badge, duration, start time, pipeline version, snapshot mode indicator, and node statistics (success/failure counts). Click Exit Replay to return to normal editing mode.
Replay Node List on the right lists all nodes in the execution with their status and duration. Sort by Order (default), Fastest, or Slowest. Click a node to open its inspector panel.
Node Inspector shows:
- Overview — status, duration, and timing
- Input Data — the data the node received, including variables used and source nodes
- Output Data — the data the node produced
If the execution ran on an older pipeline version, a yellow warning banner indicates how many nodes were added or removed since then.
Shareable URL — when you enter Replay mode, the URL updates with ?execution={id}. Share this URL and the recipient will open the same execution in Replay mode.
Pipeline Metrics Panel
Navigation: Pipeline Designer → Metrics button (toolbar)
Click Metrics in the toolbar to open a metrics panel showing real-time performance statistics for the current pipeline. The panel auto-refreshes every 5 seconds.
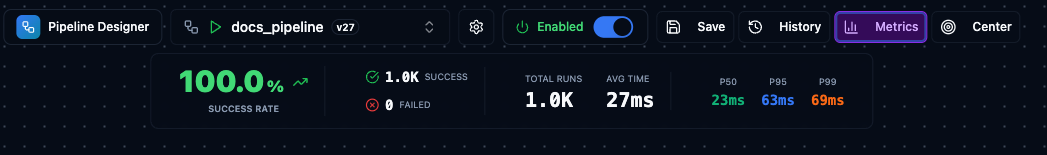
Pipeline Metrics panel with success rate, run counts, average time, and P50/P95/P99 latencies.
| Metric | Description |
|---|---|
| Success Rate | Percentage of successful executions (green ≥95%, yellow ≥80%, red below 80%). |
| Success / Failed | Counts of successful and failed executions. |
| Total Runs | Total number of executions since the system started. |
| Avg Time | Average execution duration. |
| P50 | Median execution time (50th percentile). |
| P95 | 95th percentile execution time. |
| P99 | 99th percentile execution time. |
All Executions View
Navigation: Orchestrate → Execution History
The All Executions page shows a global table of all pipeline executions across the entire system. Use this when you need to search across pipelines or do not know which pipeline produced a specific execution.
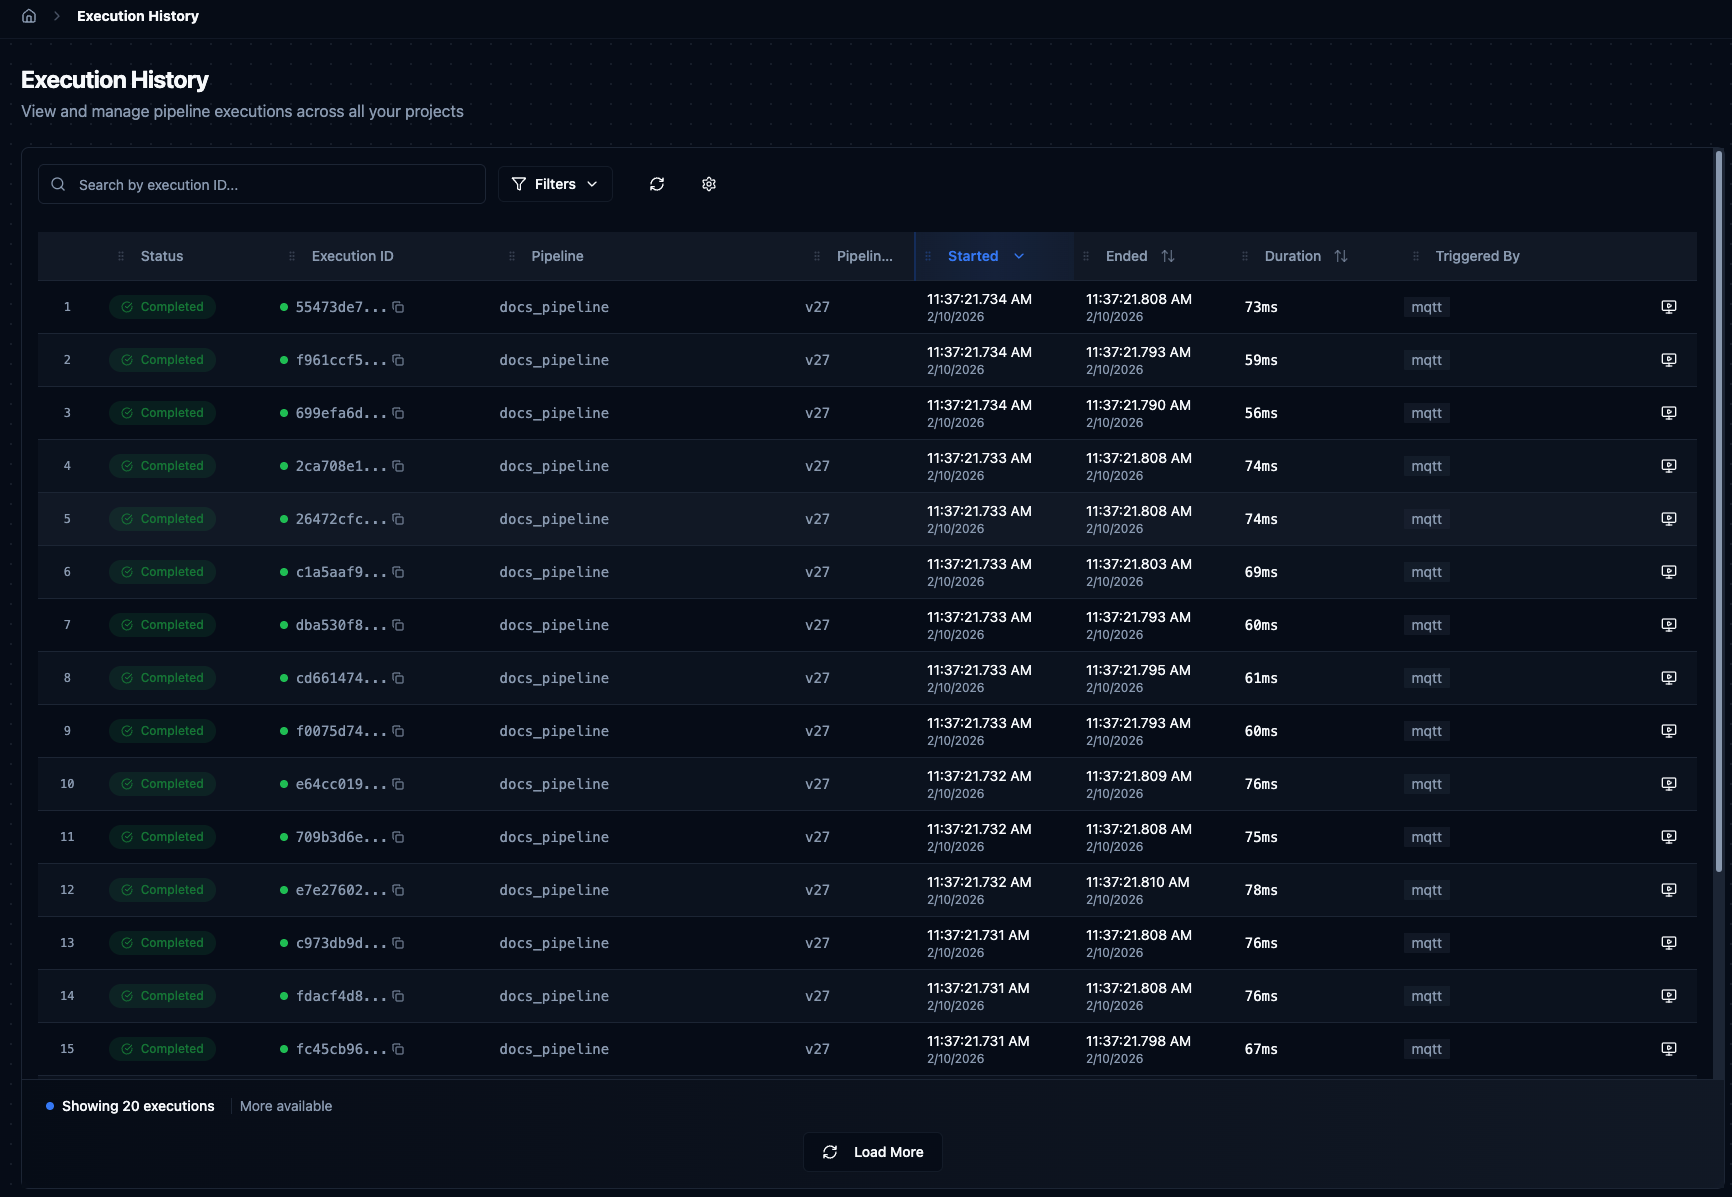
Global Execution History table with filters, search, and sortable columns.
| Column | Description |
|---|---|
| Execution ID | Unique UUID with a copy button. Use this to search in System Logs. |
| Pipeline | Name of the pipeline that ran. Click to filter by that pipeline. |
| Status | Color-coded badge — Completed, Failed, Running, Pending, Cancelled, Paused, or Partial. |
| Started / Ended | Timestamps for execution start and end. |
| Duration | Total time from start to finish. Sort to find the slowest runs. |
| Triggered By | How the execution was started — Schedule, Manual, Webhook, or API. |
Actions: View on Canvas opens the execution in Replay mode on the Pipeline Designer. Rerun launches the same pipeline configuration again. Cancel stops a running execution.
Filters: Status dropdown, Pipeline dropdown, and Execution ID search. Click column headers to sort.
Detailed logs for executions older than 2 hours are removed automatically. You can still see high-level information (status, duration, metadata) for older executions, but node-level input/output data will no longer be available.
Pipeline Advanced Settings
The Edit Pipeline → Advanced tab contains settings that affect troubleshooting and execution behaviour.
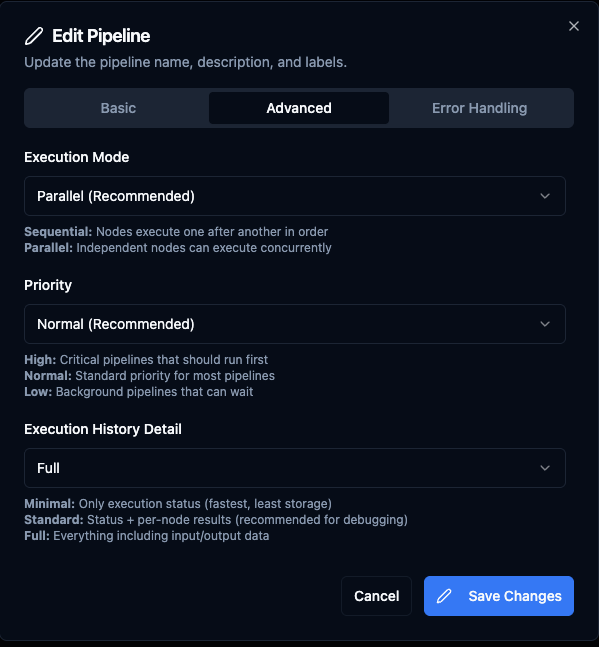
Advanced pipeline settings: Execution Mode, Priority, and Execution History Detail level.
Execution Mode — Parallel (default, recommended): independent nodes run concurrently. Sequential: nodes run one after another in order.
Priority — High: critical pipelines execute first. Normal (default): standard priority. Low: background pipelines that can wait.
Execution History Detail — controls how much data is captured during execution:
| Level | What is Recorded | Use Case |
|---|---|---|
| Minimal | Execution status only (started/completed/failed). | Production pipelines where you only need to know if it ran. Fastest performance, least storage. |
| Standard (default) | Status + per-node results (success/fail, duration). | Recommended for debugging. Shows which node failed without storing full payloads. |
| Full | Everything including node input/output data. | Complete debug capability. Uses more storage. Recommended for development and testing. |
Changing this setting only affects new executions. Previous executions retain whatever detail level was active when they ran.
Error Handling tab — configure default timeout (1–600s, default 30s), retry on timeout, retry on failure, and error behaviour (Stop Pipeline or Continue Execution). When retry is enabled, additional settings control max attempts (1–10), initial delay, max delay, backoff multiplier, and jitter factor.
Connection Status
Navigation: Connect → Connections
Overview
The Status column in the connections table shows real-time connectivity and health information for every configured connection. The system continuously monitors connections through a runtime supervisor that tracks state transitions, manages automatic reconnection, and provides circuit-breaker protection. Status data refreshes every 10 seconds.
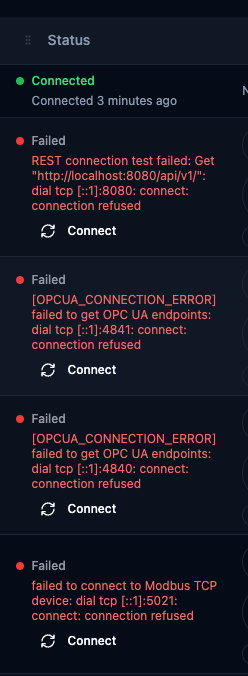
Connection status column with mixed Connected and Failed states, including inline error messages and action buttons.
Connection States
| State | Indicator | Description |
|---|---|---|
| Connected | Green dot | Active connection established and operational. Shows "Connected X ago" with elapsed time. |
| Idle | Gray dot | Connection registered but not started yet. Initial state after creating a new connection. |
| Connecting | Yellow pulsing dot | Initial connection attempt in progress. If it persists beyond 30 seconds, investigate network or configuration issues. |
| Reconnecting | Blue pulsing dot | Connection lost, automatic reconnection in progress. Shows retry count (e.g. "Retry #3") and the triggering error message. Uses exponential backoff. |
| Unhealthy | Orange dot | Connected but failing health checks. Pipelines may still execute with degraded performance. |
| Suspended | Amber dot | Automatic reconnection paused — operator intervention required. A Resume button appears inline. |
| Failed | Red dot | All reconnection attempts exhausted. Shows the final error message. A Connect button appears inline. |
| Draining | Purple dot | Graceful shutdown in progress. Active operations are completing before the connection closes. |
| Disconnected | Gray dot | No active connection. Connection pool is empty. |
Health Status
| Health | Meaning |
|---|---|
| Healthy | Fully operational, passing all health checks. |
| Degraded | Operational but experiencing performance or intermittent issues. |
| Unhealthy | Not operational or has critical issues. |
| Unknown | Cannot be determined — connection is in a transitional state (Idle, Connecting, Reconnecting). |
When a connection is in a problematic state, the error message appears directly below the status indicator. Common patterns: connection refused (service not running), timeout (network latency or firewall), authentication failure (wrong credentials), TLS/SSL errors (certificate issues), DNS resolution failure (bad hostname).
Circuit Breaker
Each connection is protected by a circuit breaker that prevents cascading failures.
| State | Meaning |
|---|---|
| Closed | Normal operation. Requests pass through. Failures are counted in the background. |
| Open | Too many consecutive failures. Requests are blocked. An "On Hold" badge appears. Shows failure count, opened time, and next retry time. |
| Half-Open | After cooldown, a limited number of test requests are allowed. Success returns to Closed; failure returns to Open. |
Use Reset Circuit Breaker from the connection's dropdown menu to force it back to Closed immediately after fixing the underlying issue.
Connection Actions
| Action | Available When | What It Does |
|---|---|---|
| Connect | Failed, Idle, Disconnected | Starts a fresh connection attempt. |
| Resume Reconnection | Suspended | Resumes paused automatic reconnection. |
| Force Reconnect | Failed, Suspended, Idle, Disconnected | Full stop and restart of the connection. Use after configuration changes. |
| Reset Circuit Breaker | Circuit breaker Open | Resets to Closed, allowing requests immediately. |
| Test Connection | All states | One-time connectivity test without affecting the running connection. |
| View Status History | All states | Opens the Connection Health page filtered to this connection. |
Connection Health Dashboard
Navigation: Connect → Connection Health
The Connection Health dashboard provides a historical view of connection state changes across the entire deployment. While the connections table shows current status, this dashboard reveals patterns over time.
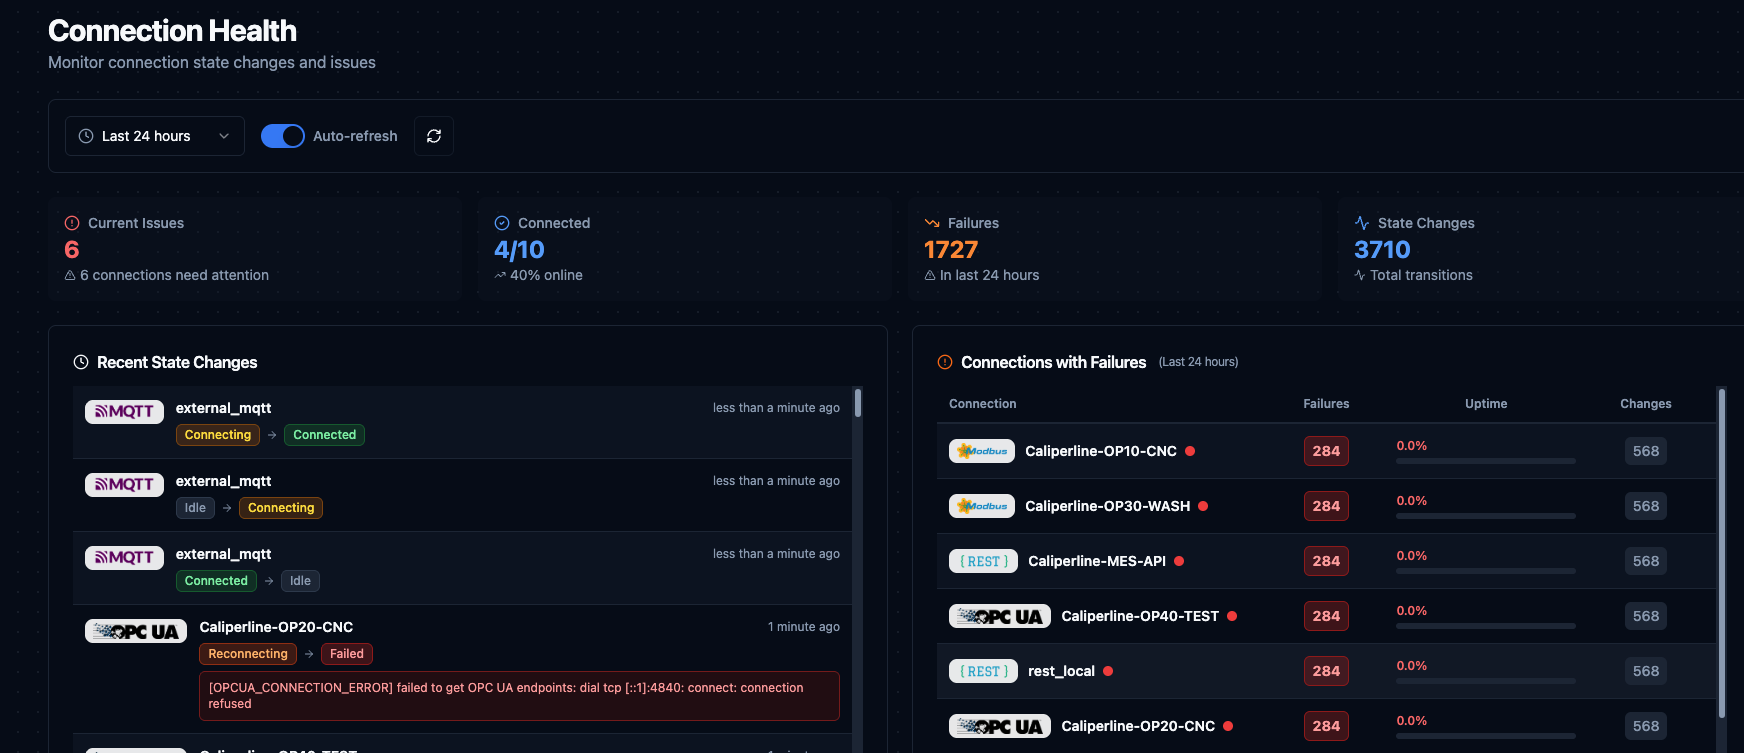
Connection Health dashboard showing current issues, connectivity ratio, failures, state changes, and connections with failures.
Time range options: Last 10 minutes, 1 hour, 6 hours, 24 hours (default), 3 days, or 7 days (maximum).
Auto-refresh: Summary statistics refresh every 30 seconds, state changes every 15 seconds, runtime status every 10 seconds. Toggle off when analysing a specific point in time.
Statistics cards:
| Metric | Description |
|---|---|
| Current Issues | Connections not in Connected or Idle state right now. |
| Connected | Ratio of connected to total connections with percentage. |
| Failures | Total failure events in the selected time period. |
| State Changes | Total state transitions. A high number relative to connection count indicates instability. |
Recent State Changes (left panel) shows the most recent 50 state transitions with connection name, connector logo, state transition badges (e.g. Connected → Failed), relative timestamp, and error message when applicable.
Connections with Failures (right panel) ranks connections by failure count for the selected period. Columns: connection name with live status dot, failure count, uptime percentage (green ≥99%, yellow 95–98.9%, red below 95%), and total state changes.
Per-Connection Health Tab
Navigation: Connect → Select Connection → Edit → Health tab
Each connection has a dedicated Health tab with detailed historical statistics and a visual timeline.
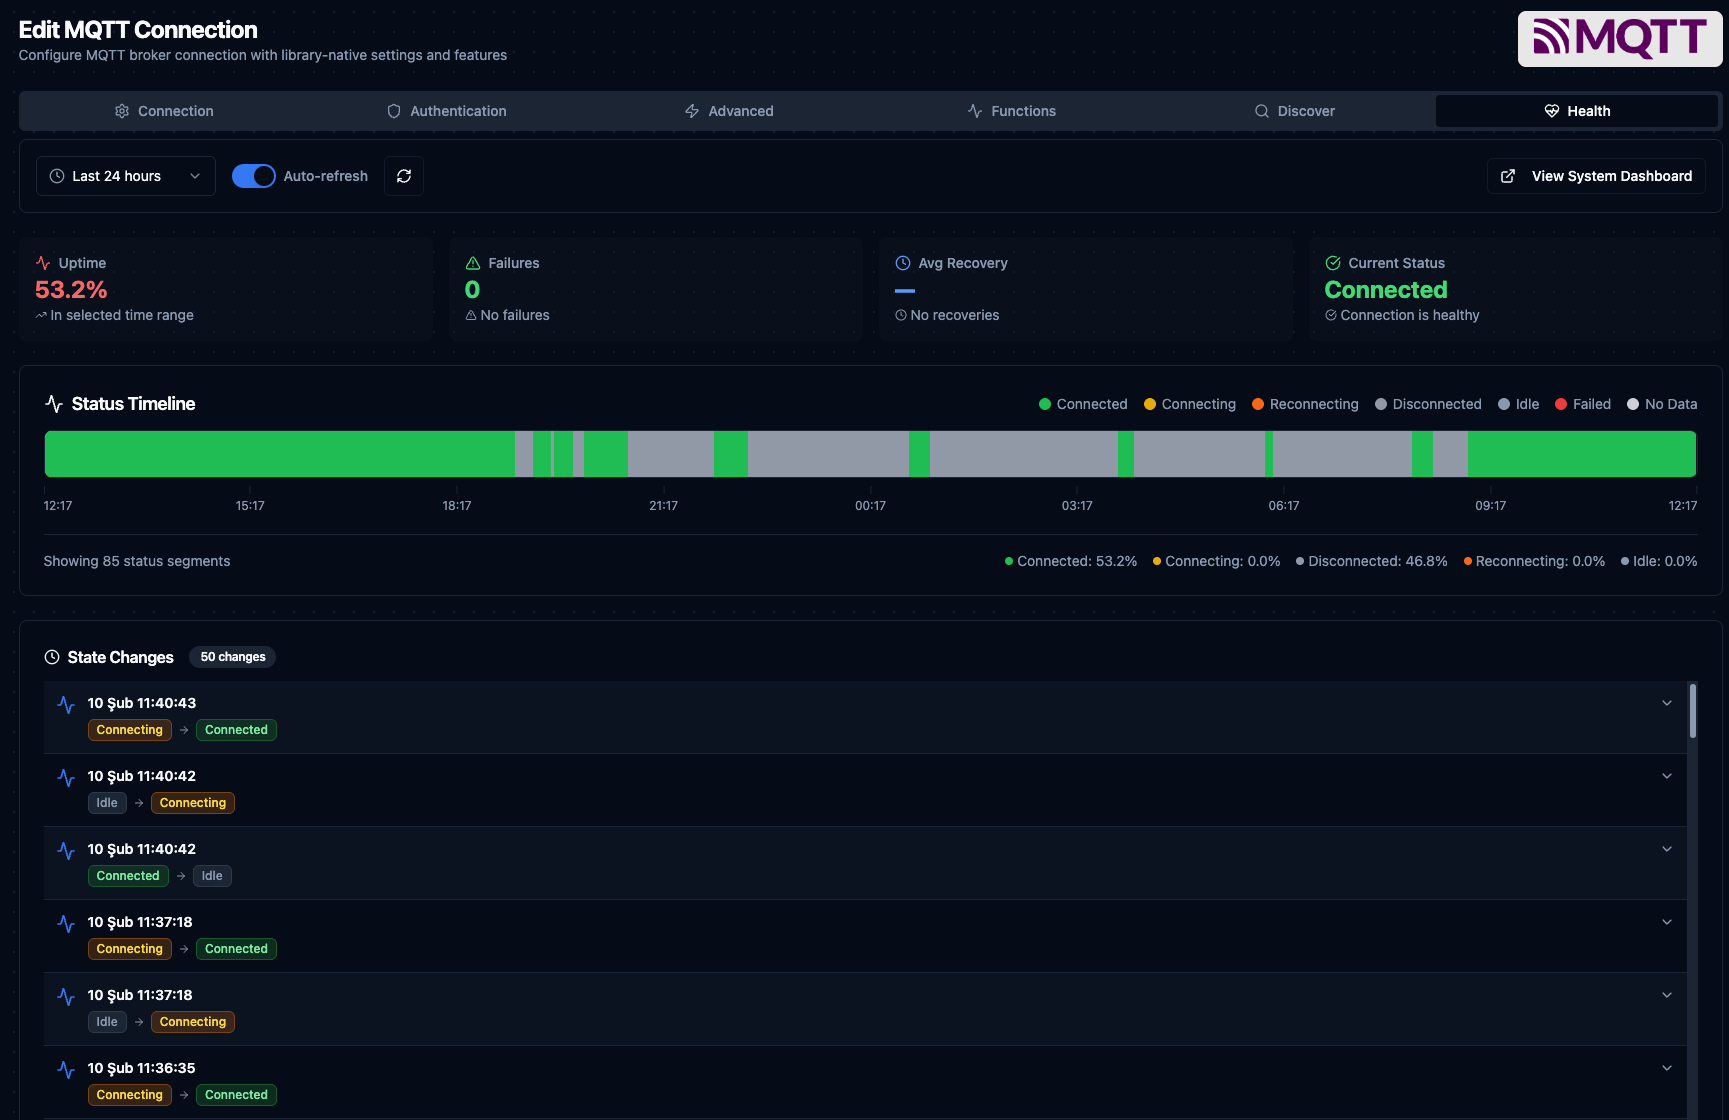
Health tab for an MQTT connection with uptime, failures, recovery stats, status timeline, and state change history.
Statistics: Uptime percentage, failure count, average recovery time, and current live status — all for the selected time range.
Status Timeline: A color-coded bar spanning the selected period shows exactly when the connection was in each state (green = Connected, yellow = Connecting, orange = Reconnecting, gray = Disconnected/Idle, red = Failed).
State Change Events: Scrollable list of up to 50 events showing state transitions with timestamps, error messages, and duration since the previous change.
Connection Limits
| Limit | Value |
|---|---|
| Maximum history range | 7 days |
| Recent state changes display | 50 events |
| Aggregate events (system dashboard) | 500 events |
| Top unstable connections | 50 connections |
| Connection profiles in aggregate view | 100 profiles |
| History states tracked | 6 of 9 (Connected, Connecting, Reconnecting, Disconnected, Failed, Idle) |
The live status column supports all 9 runtime states, but historical tracking records only 6. States like Suspended appear as Disconnected in the timeline. Use live status for current state and history for trend analysis.