Outage reports
Prove it arrived: one report per outage, with the sum that closes, the outputs it covered, a timeline, and the write keys to check the destination yourself.
- Where
- Orchestrate › Store & Forward › Outage reports
- Kept
- The last 90 days are listed
- Permission
- durability:read
- Send it
- Print or save as PDF, JSON, CSV, write-key manifest
Overview
When a destination goes down, Store & Forward holds the writes and delivers them when it is back. The outage report is the proof afterwards. It is made from the same outage record the Overview reads, so the numbers agree everywhere.
An outage is the buffers of one connection that were holding at the same time. The report covers it from the first failed write until the last buffer is back to direct delivery.
Navigation Path: Orchestrate > Store & Forward > Overview > Outage reports
Find a report
There are three ways in:
- Outage reports on the Overview lists the latest three. Each title opens its report. All outage reports opens the full list.
- Last outage on the Overview, on a day with nothing holding, shows the last outage as a small timeline. Open the report opens it.
- The list itself, newest first, covers the last 90 days. Drills are in it too, marked Drill. Filters narrows it by kind (real outages or drills), state (in progress or ended), result (lost records or nothing lost) and connection; the search box filters the outages listed on screen. Show older outages reads the next 50 that match.
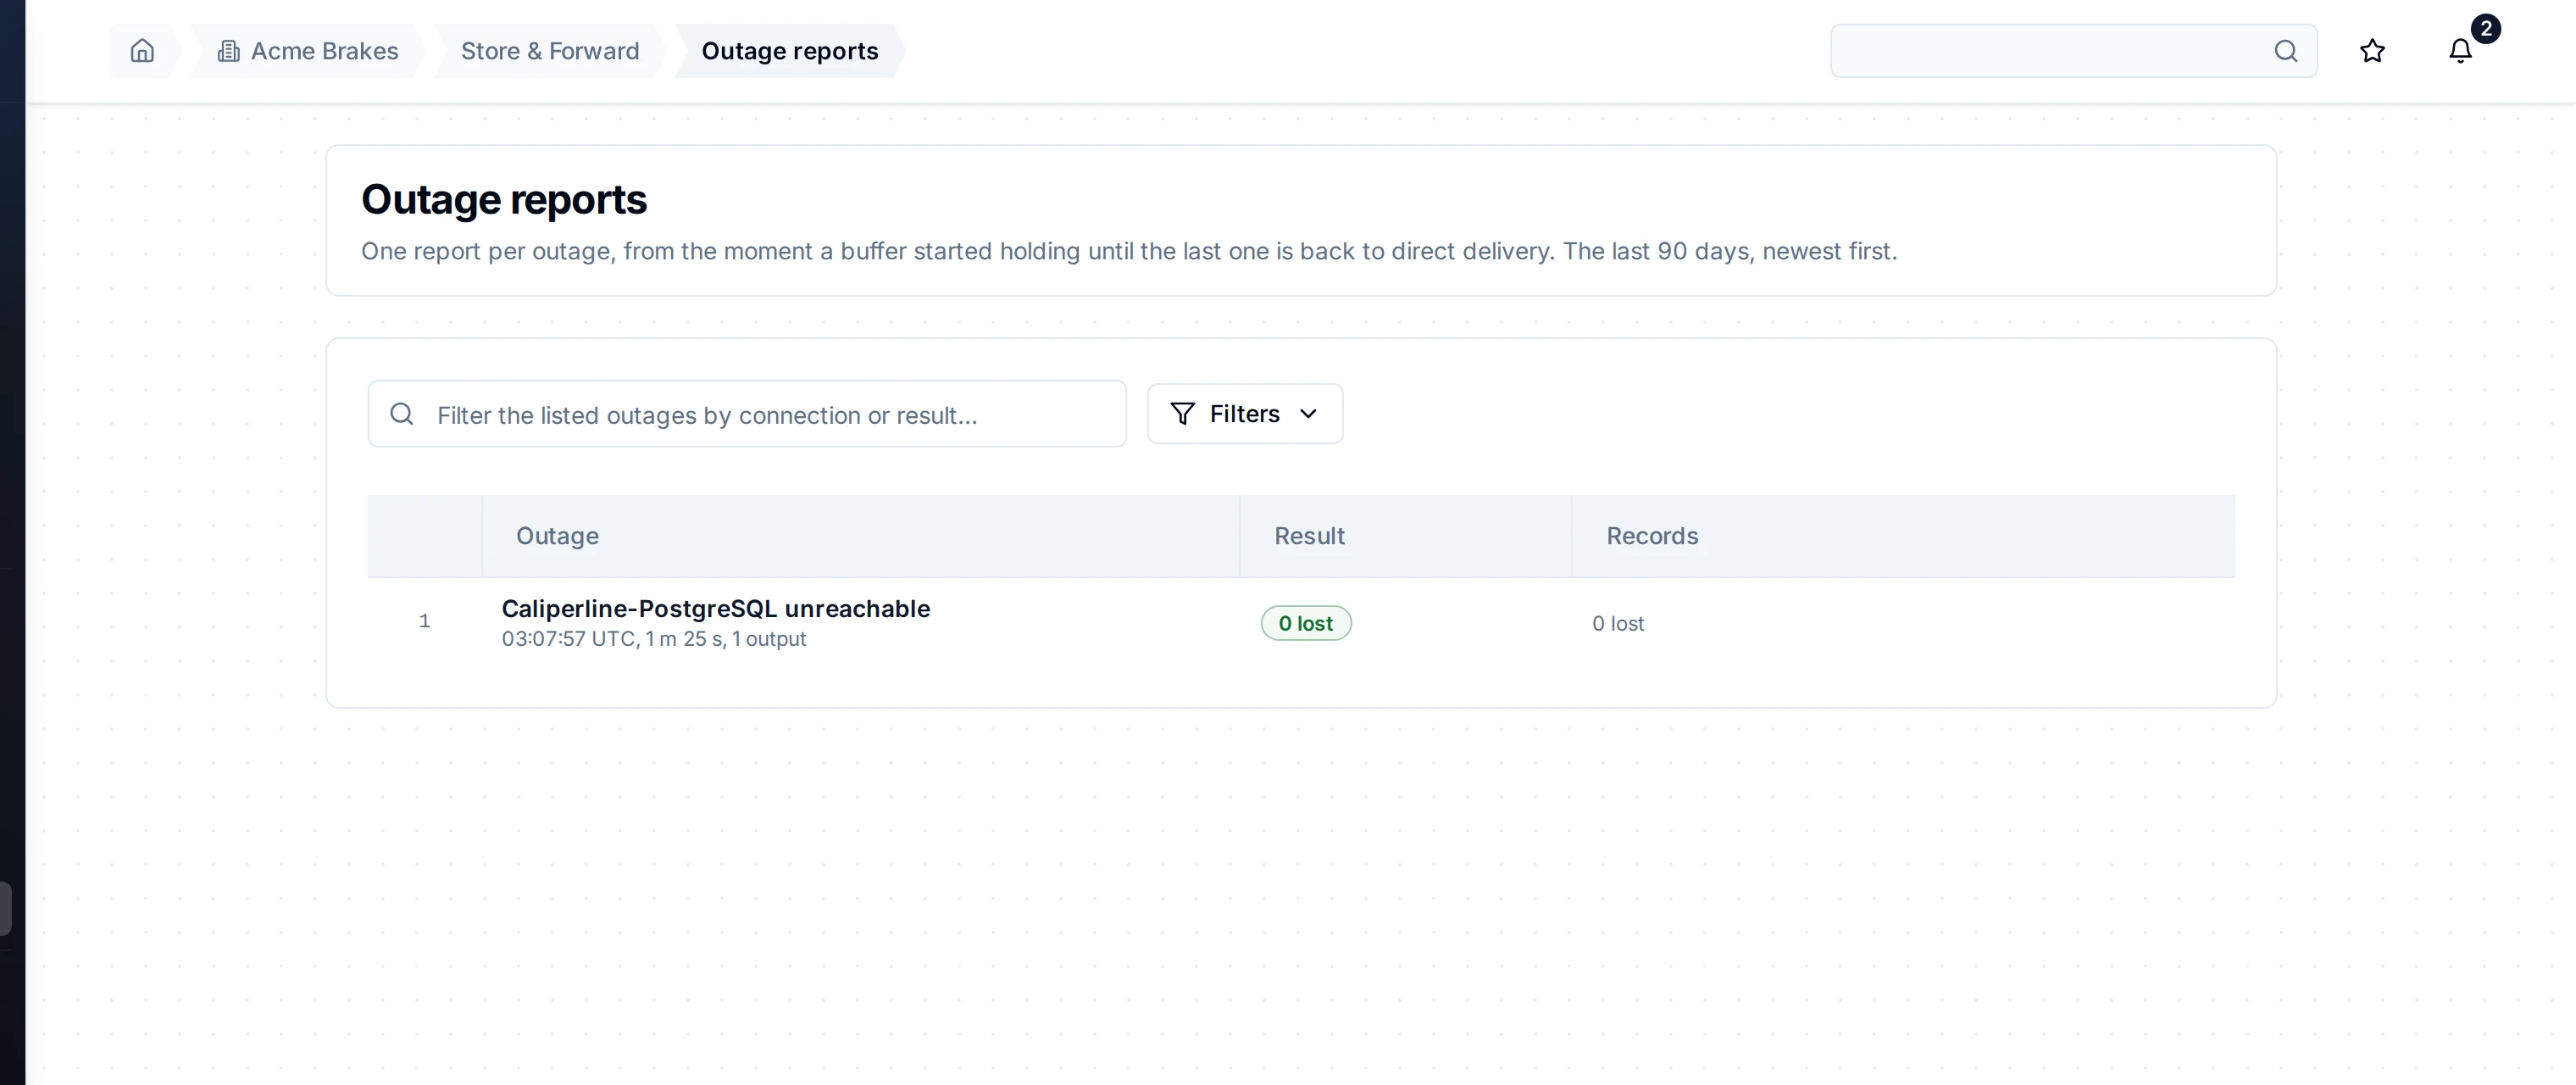
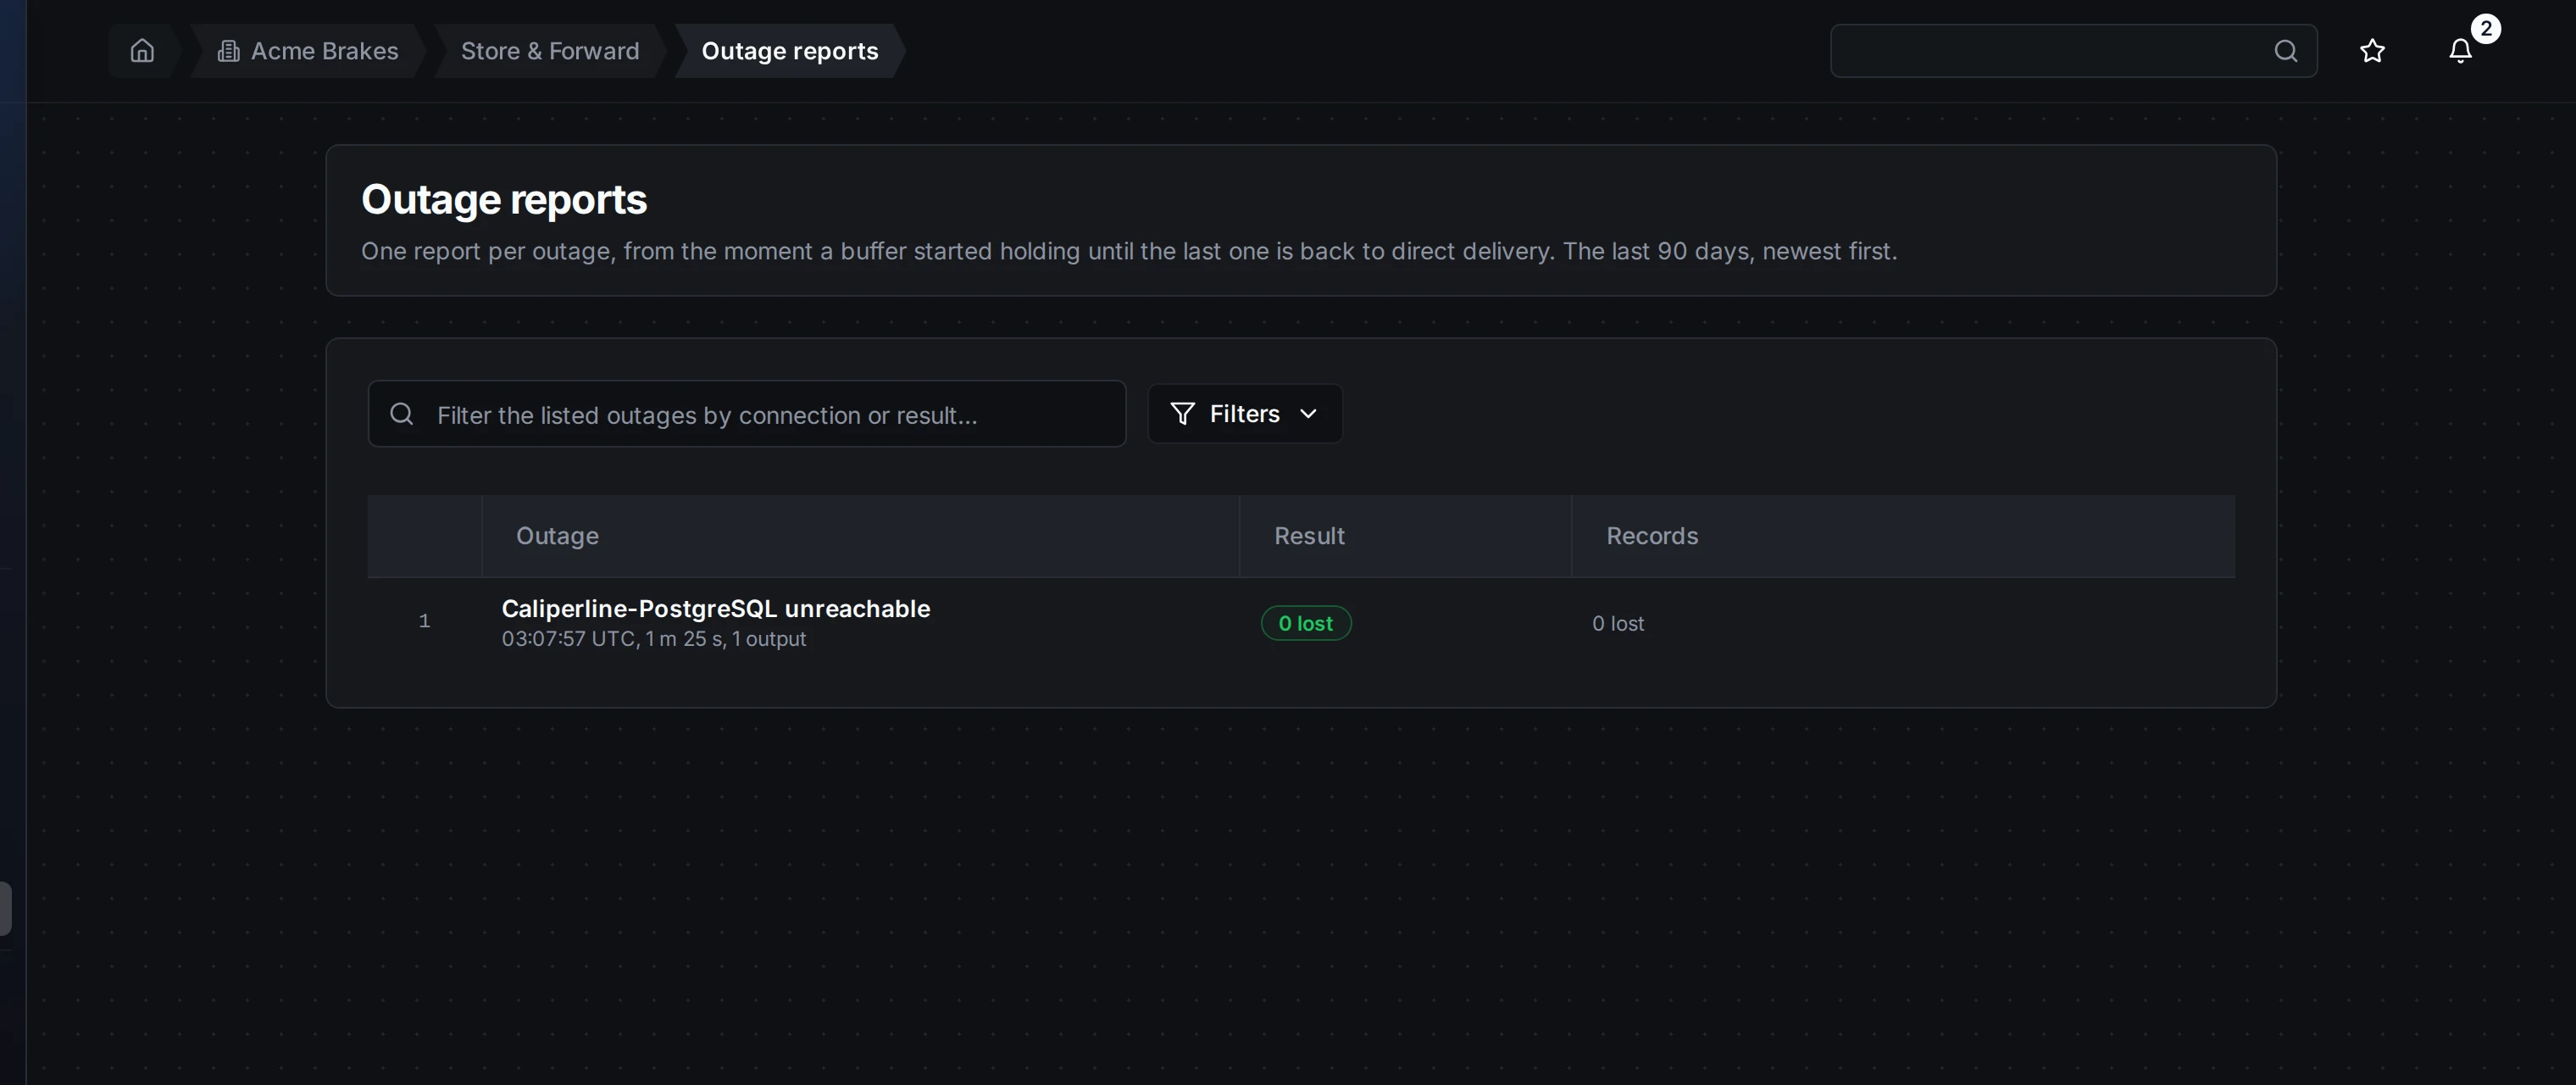
Outage reports: one row per outage, with its verdict first.
Each row leads with its verdict: 0 lost, N lost, In progress while the outage is open, or Not accounted for when part of it was not counted.
Read a report
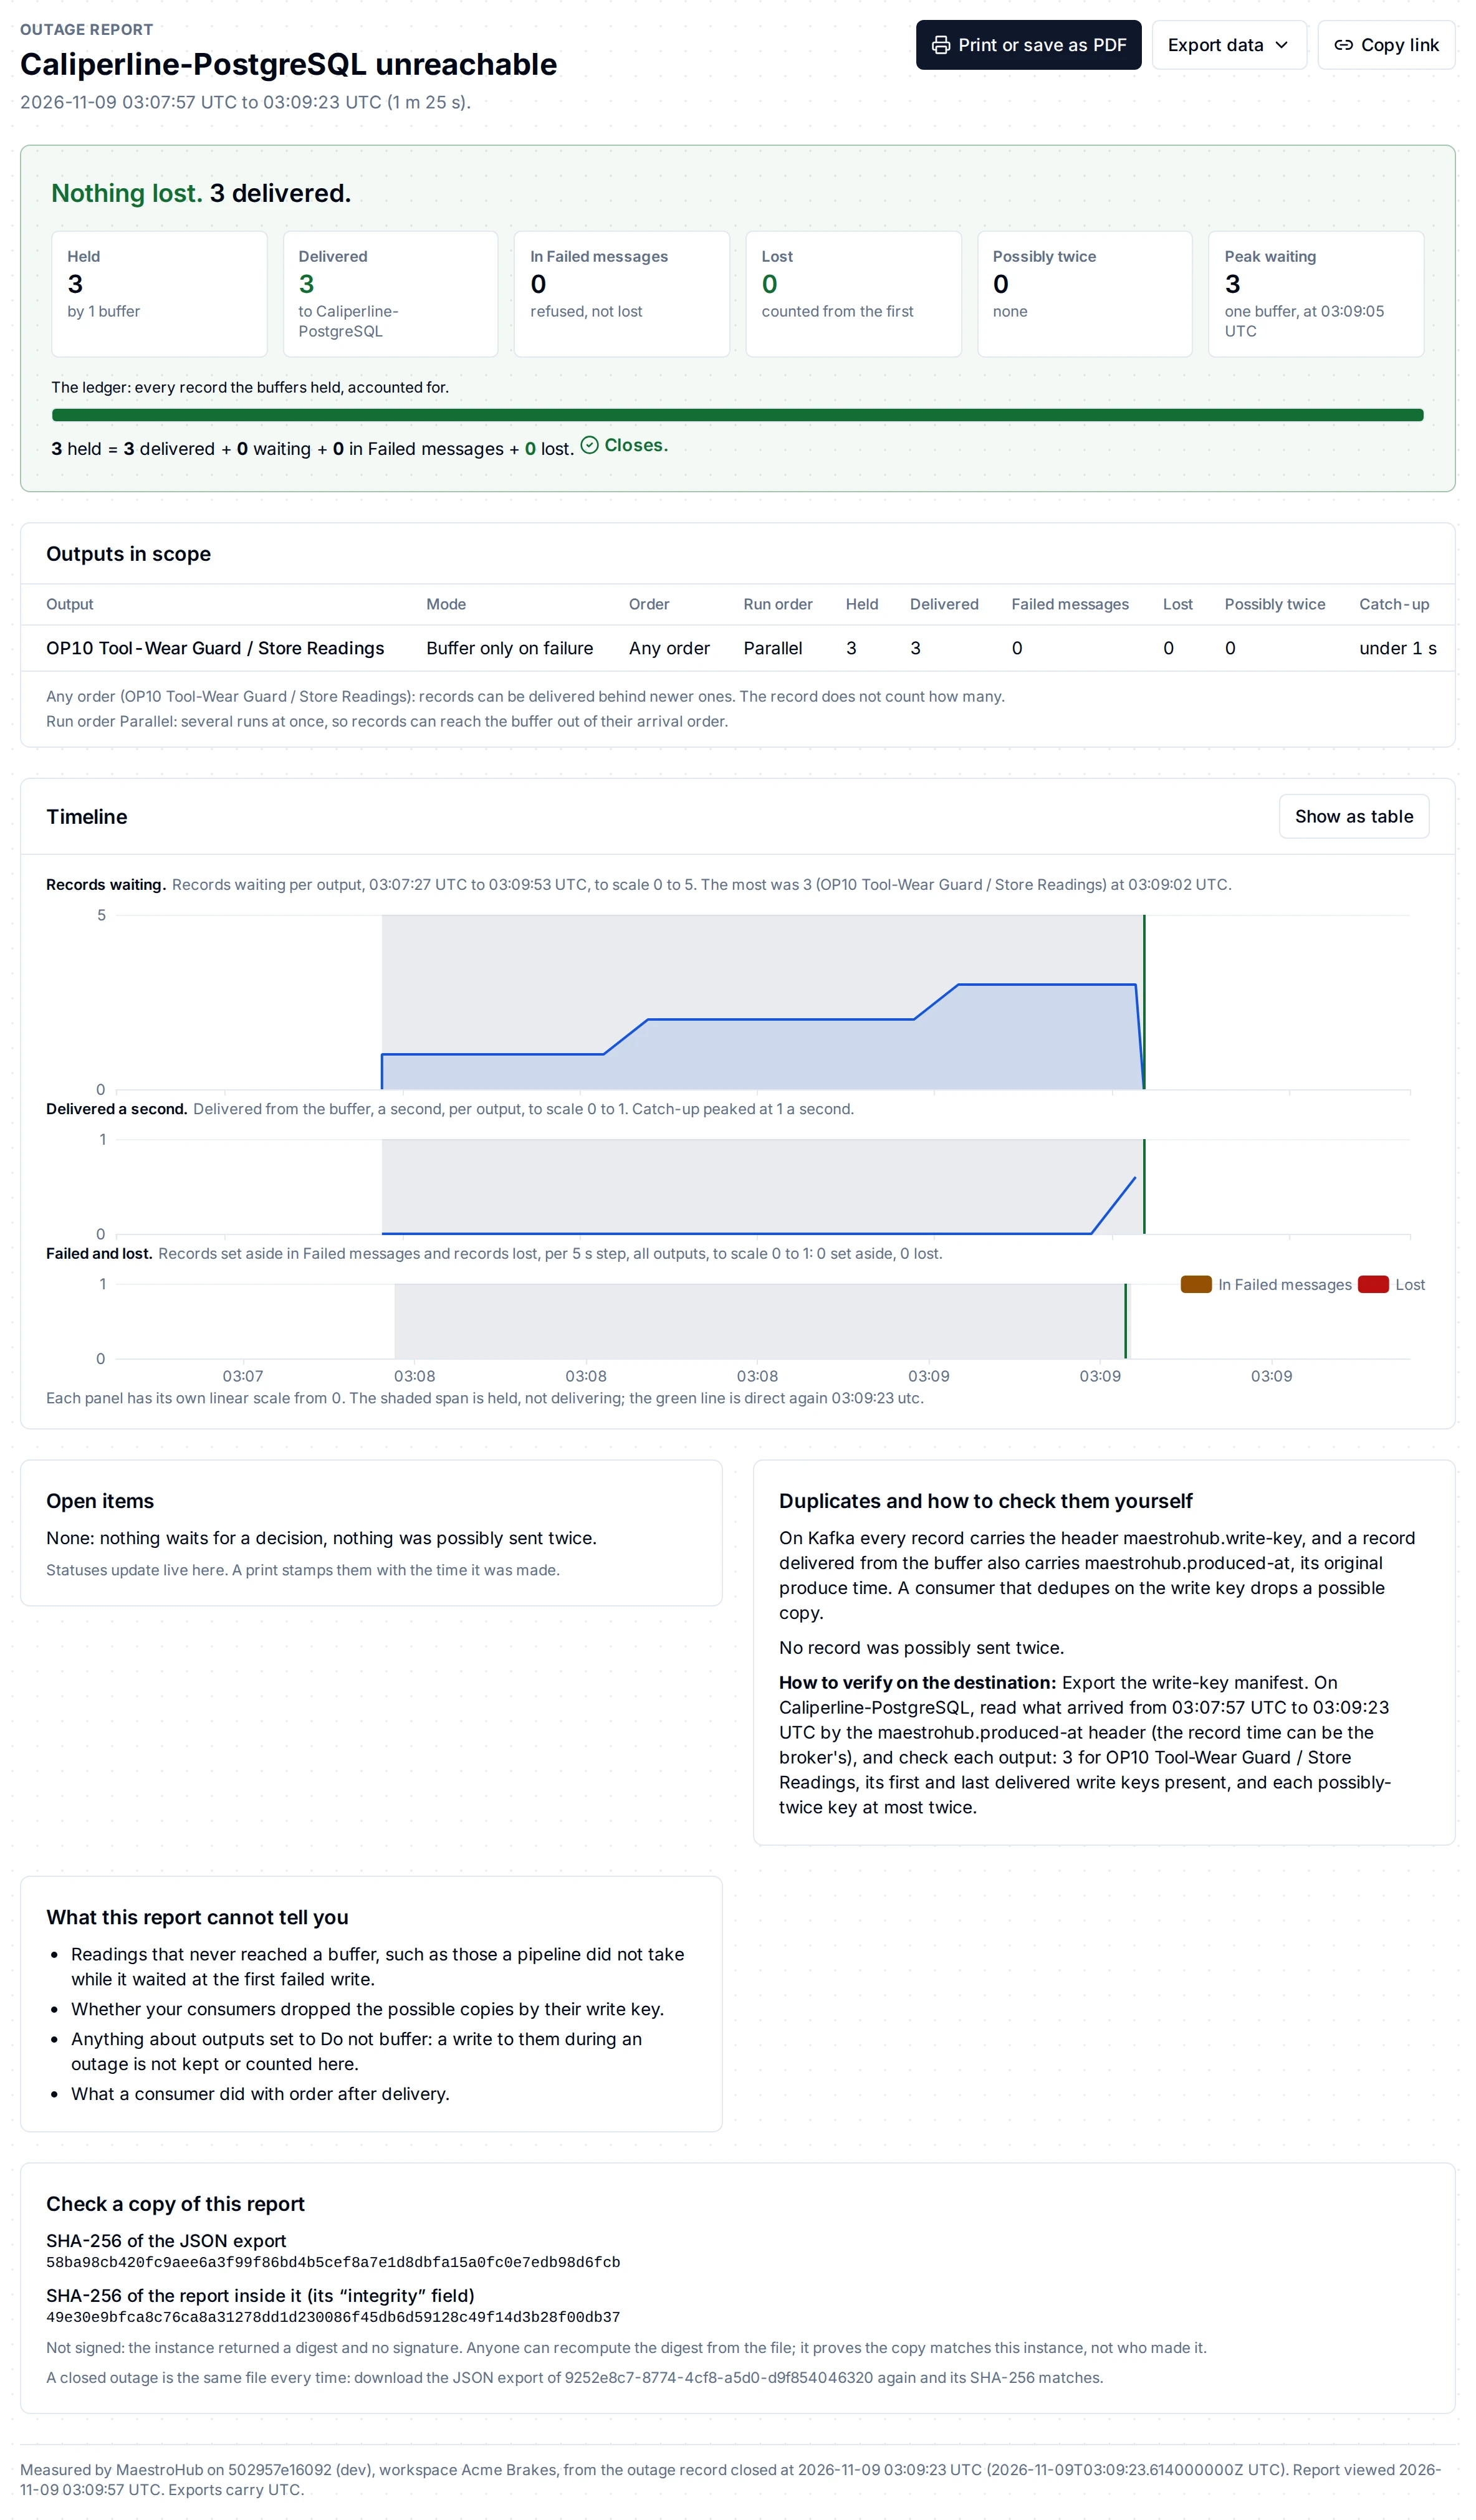
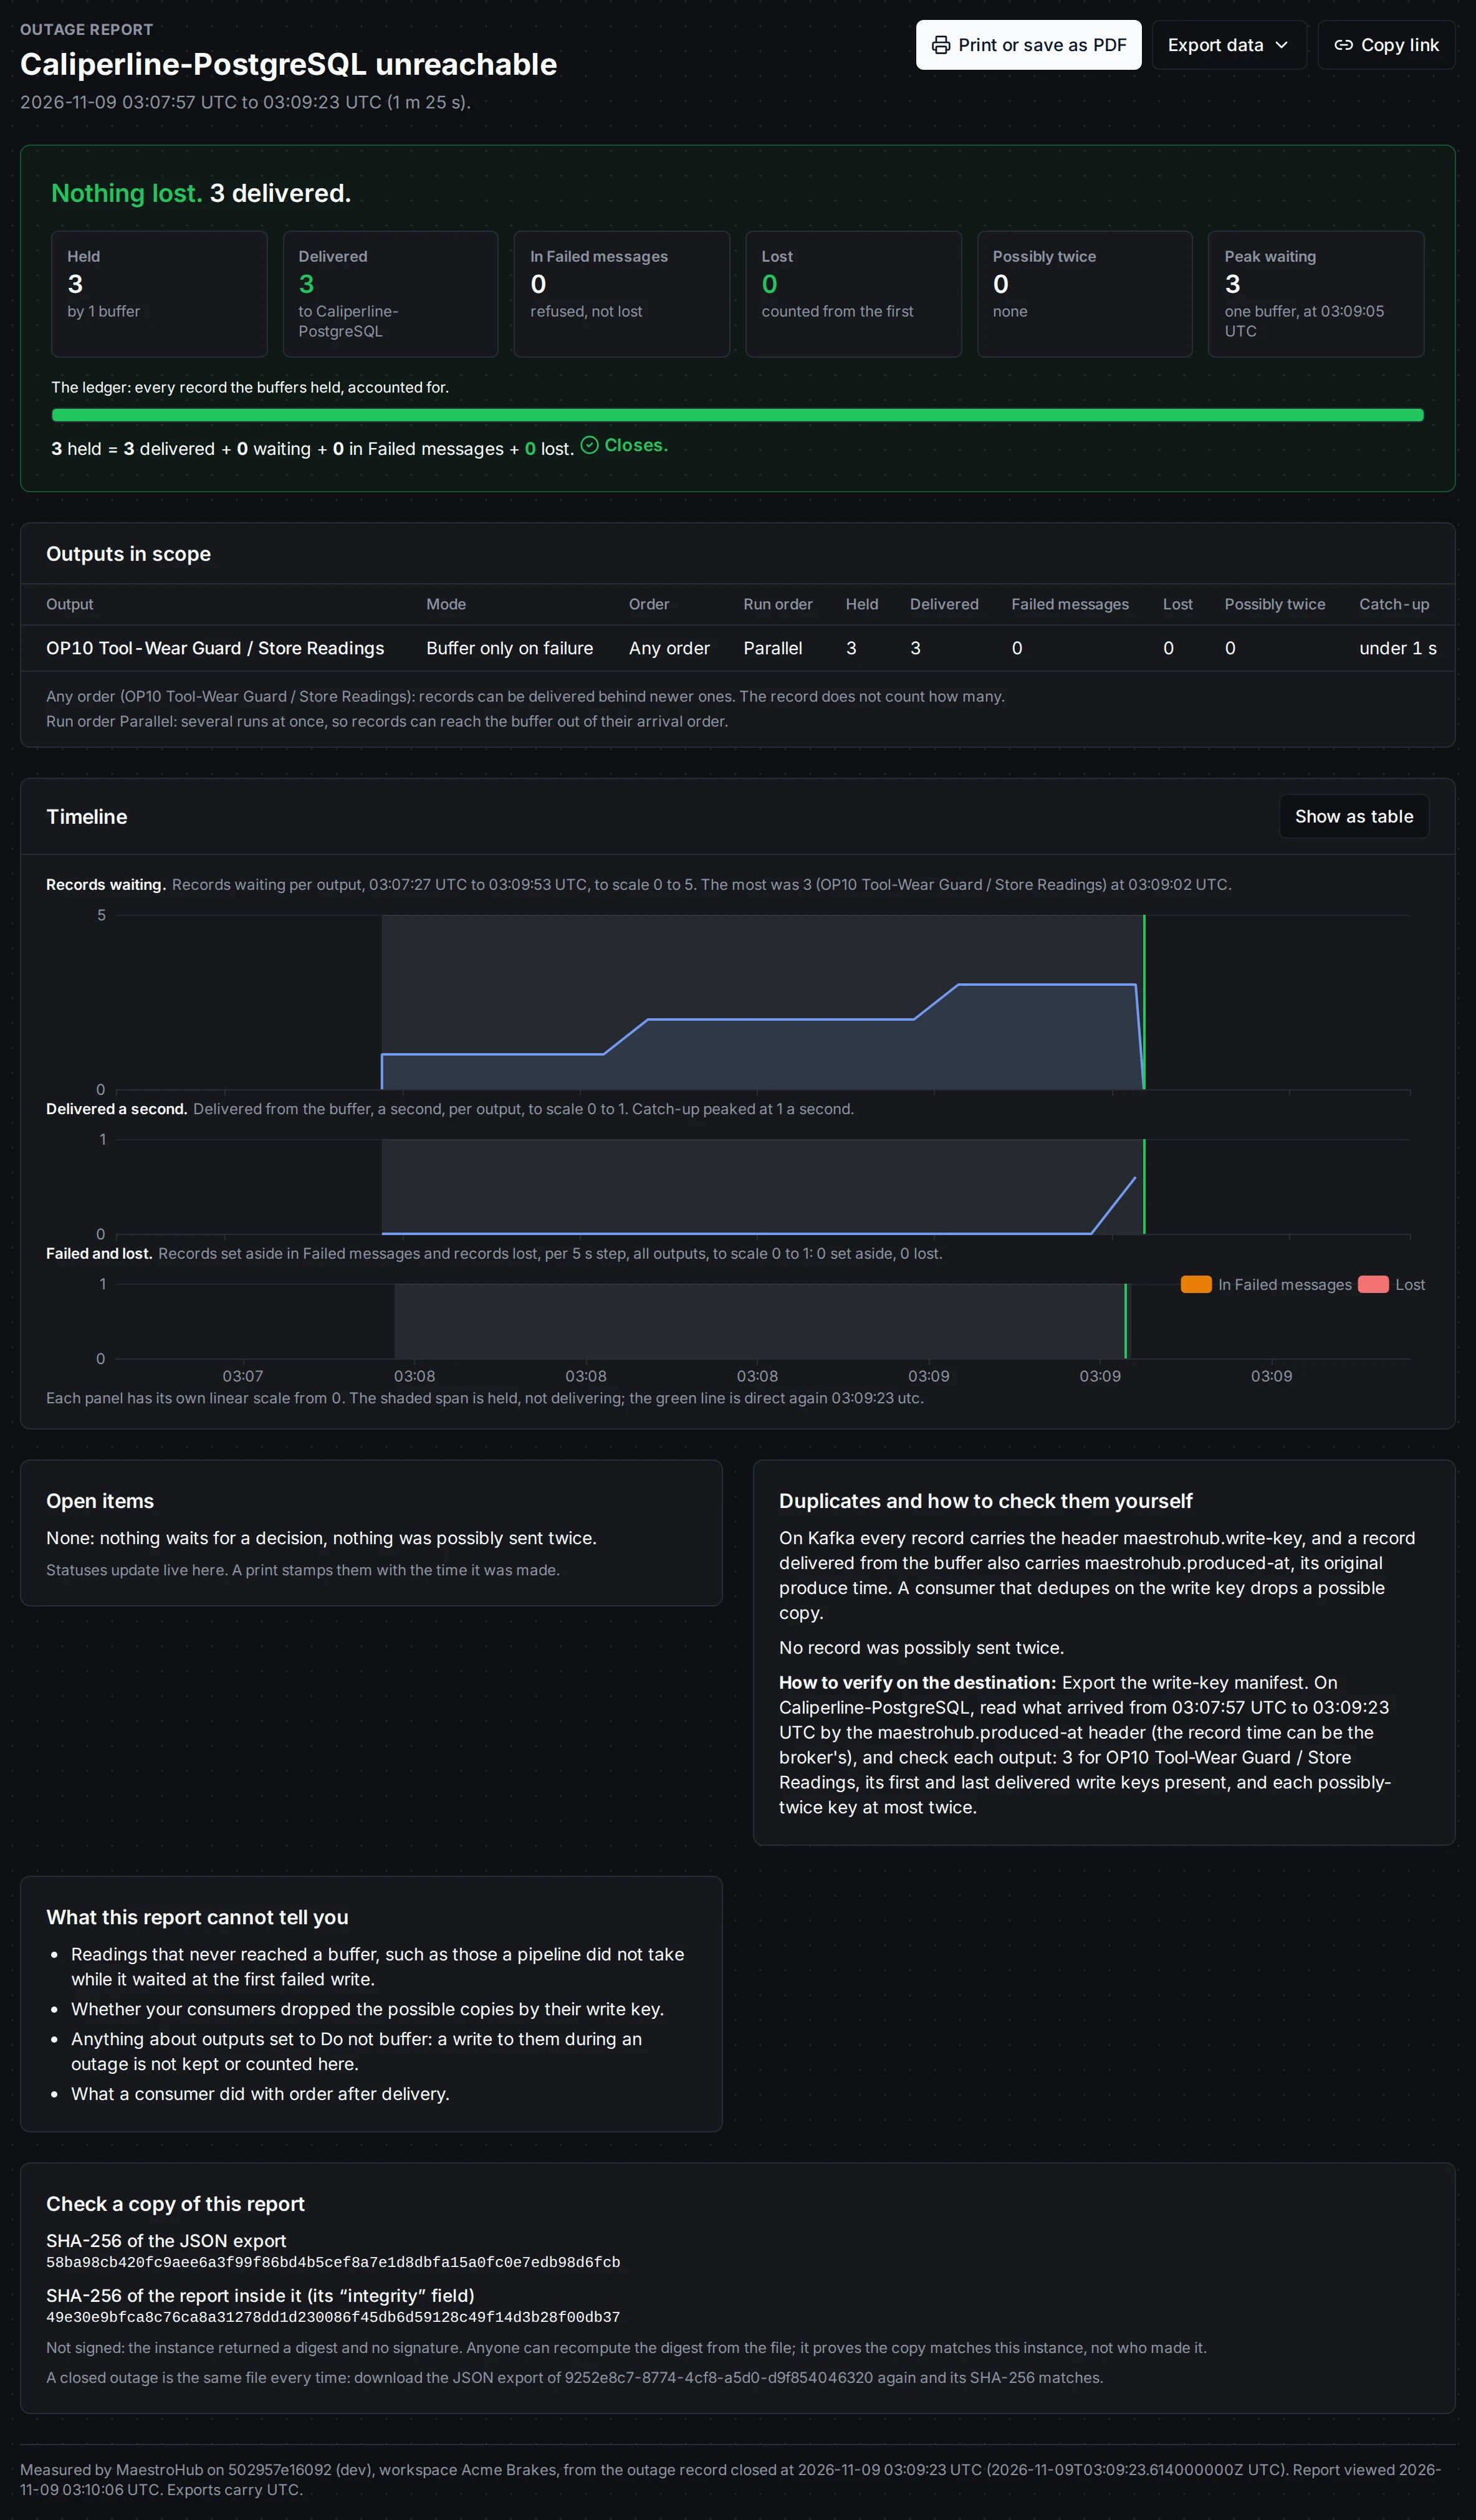
The report leads with the answer, then shows the sum that proves it.
The answer first
The report opens with one sentence:
- Nothing lost. when the outage is over, nothing was lost and every record is accounted for. Records still in Failed messages are named: they are kept, not lost.
- None lost before sending. in place of Nothing lost. when some records were sent, not confirmed (below): MaestroHub lost none, but their protocol cannot prove they arrived.
- Nothing lost so far. while the outage is still open. The numbers move until the last buffer is back to direct delivery.
- N lost. when records were lost, with the reasons.
- N records not accounted for. when part of the outage was not counted, for example because the engine restarted while records were held. The report never says "Nothing lost." in that case.
Under it, six figures: held, delivered, in Failed messages, lost, possibly twice, and the most records one buffer held at once. When an output sends over raw TCP or syslog over TLS or TCP, the sentence also names the records sent, not confirmed.
The ledger
The ledger is the proof. It shows every record the buffers held as a bar, drawn to scale, and as a sum:
held = delivered + sent, not confirmed + waiting + in Failed messages + lost
Sent, not confirmed counts records sent over a protocol with no acknowledgement (raw TCP, syslog over TLS or TCP): the network took them, nothing confirms the receiver got them, and they are never sent again. They are not delivered, and not lost: MaestroHub cannot know. The term is shown only when an output had any. See Delivery promises.
When the sum adds up, it says Closes. When it does not, the gap is added to the sum as not accounted for, with its reason.
Outputs in scope
One row per output the outage covered:
| Column | What it says |
|---|---|
| Mode | Buffer only on failure or Always buffer |
| Order | In order or Any order |
| Run order | The pipeline's run order: Parallel or One at a time |
| Held, Delivered, Failed messages, Lost | That output's own ledger |
| Possibly twice | Records that may have reached the destination twice |
| Catch-up | How long the backlog took from the first delivery to empty |
Under the table, the report says what each order means for this outage. In order delivers in the order the buffer holds the records and stops at a refused one. Any order can deliver a record behind newer ones; the record does not count how many.
The timeline
The timeline is three panels on one time axis:
- Records waiting, per output.
- Delivered a second, per output.
- Failed and lost, per step, for all outputs.
Each panel has its own linear scale from 0, and each has a caption that states its data. The shaded span is the time the buffers held and were not delivering yet. The green line is when the last buffer was back to direct delivery.
Show as table shows the same numbers as a table, one row per step and output.
Open items
What is still open, worst first:
- In Failed messages: records the destination refused. Their status is read live: Open with the number in Failed messages for that pipeline now, or None left once they were replayed or deleted. Open Failed messages takes you there.
- Possibly twice: records that were on the wire when the connection was cut. They are for your consumers to check.
- Waiting, while the outage is open.
- Not accounted for, when part of an output's outage was not counted.
Duplicates and how to check them yourself
The report lists the write key of every record that was possibly sent twice. On Kafka, every record carries the header maestrohub.write-key. A record delivered from the buffer also carries maestrohub.produced-at, its original produce time. A consumer that dedupes on the write key drops a possible copy.
To check the destination yourself, export the write-key manifest. Read what arrived in the outage window by the maestrohub.produced-at header, not by the record time, which a broker may overwrite. Then check each output: the delivered count, its first and last delivered write keys, and each possibly-twice key at most twice.
What it cannot tell you
The report says so itself:
- Readings that never reached a buffer, such as those a pipeline did not take while it waited at the first failed write. The report shows that wait per output as the start stall.
- Whether your consumers dropped the possible copies.
- Anything about outputs set to Do not buffer.
- What a consumer did with order after delivery.
Measured by
The footer names the instance and its version, the workspace, and when the outage record closed, in your zone and in UTC. Every export carries UTC.
Send it
Three buttons, the first one primary:
- Print or save as PDF opens your browser's print dialog with the report alone, in the light theme. Choose Save as PDF there for a file. The print stamps the open items' statuses with the time it was made.
- Export data downloads the instance's own files:
- JSON: the outage record with every output, its timeline and the manifest, with a SHA-256 inside.
- CSV: one row per output: the ledger, the peak, the start stall, the time to reconnect, the delivery rate and the first and last write keys.
- Write-key manifest: per output the counts, the first and last delivered write keys and the possibly-twice keys, with the header names to match on.
- Copy as API request: a
curlcommand for the JSON export. Put your own token and workspace id in it.
- Copy link copies the report's address.
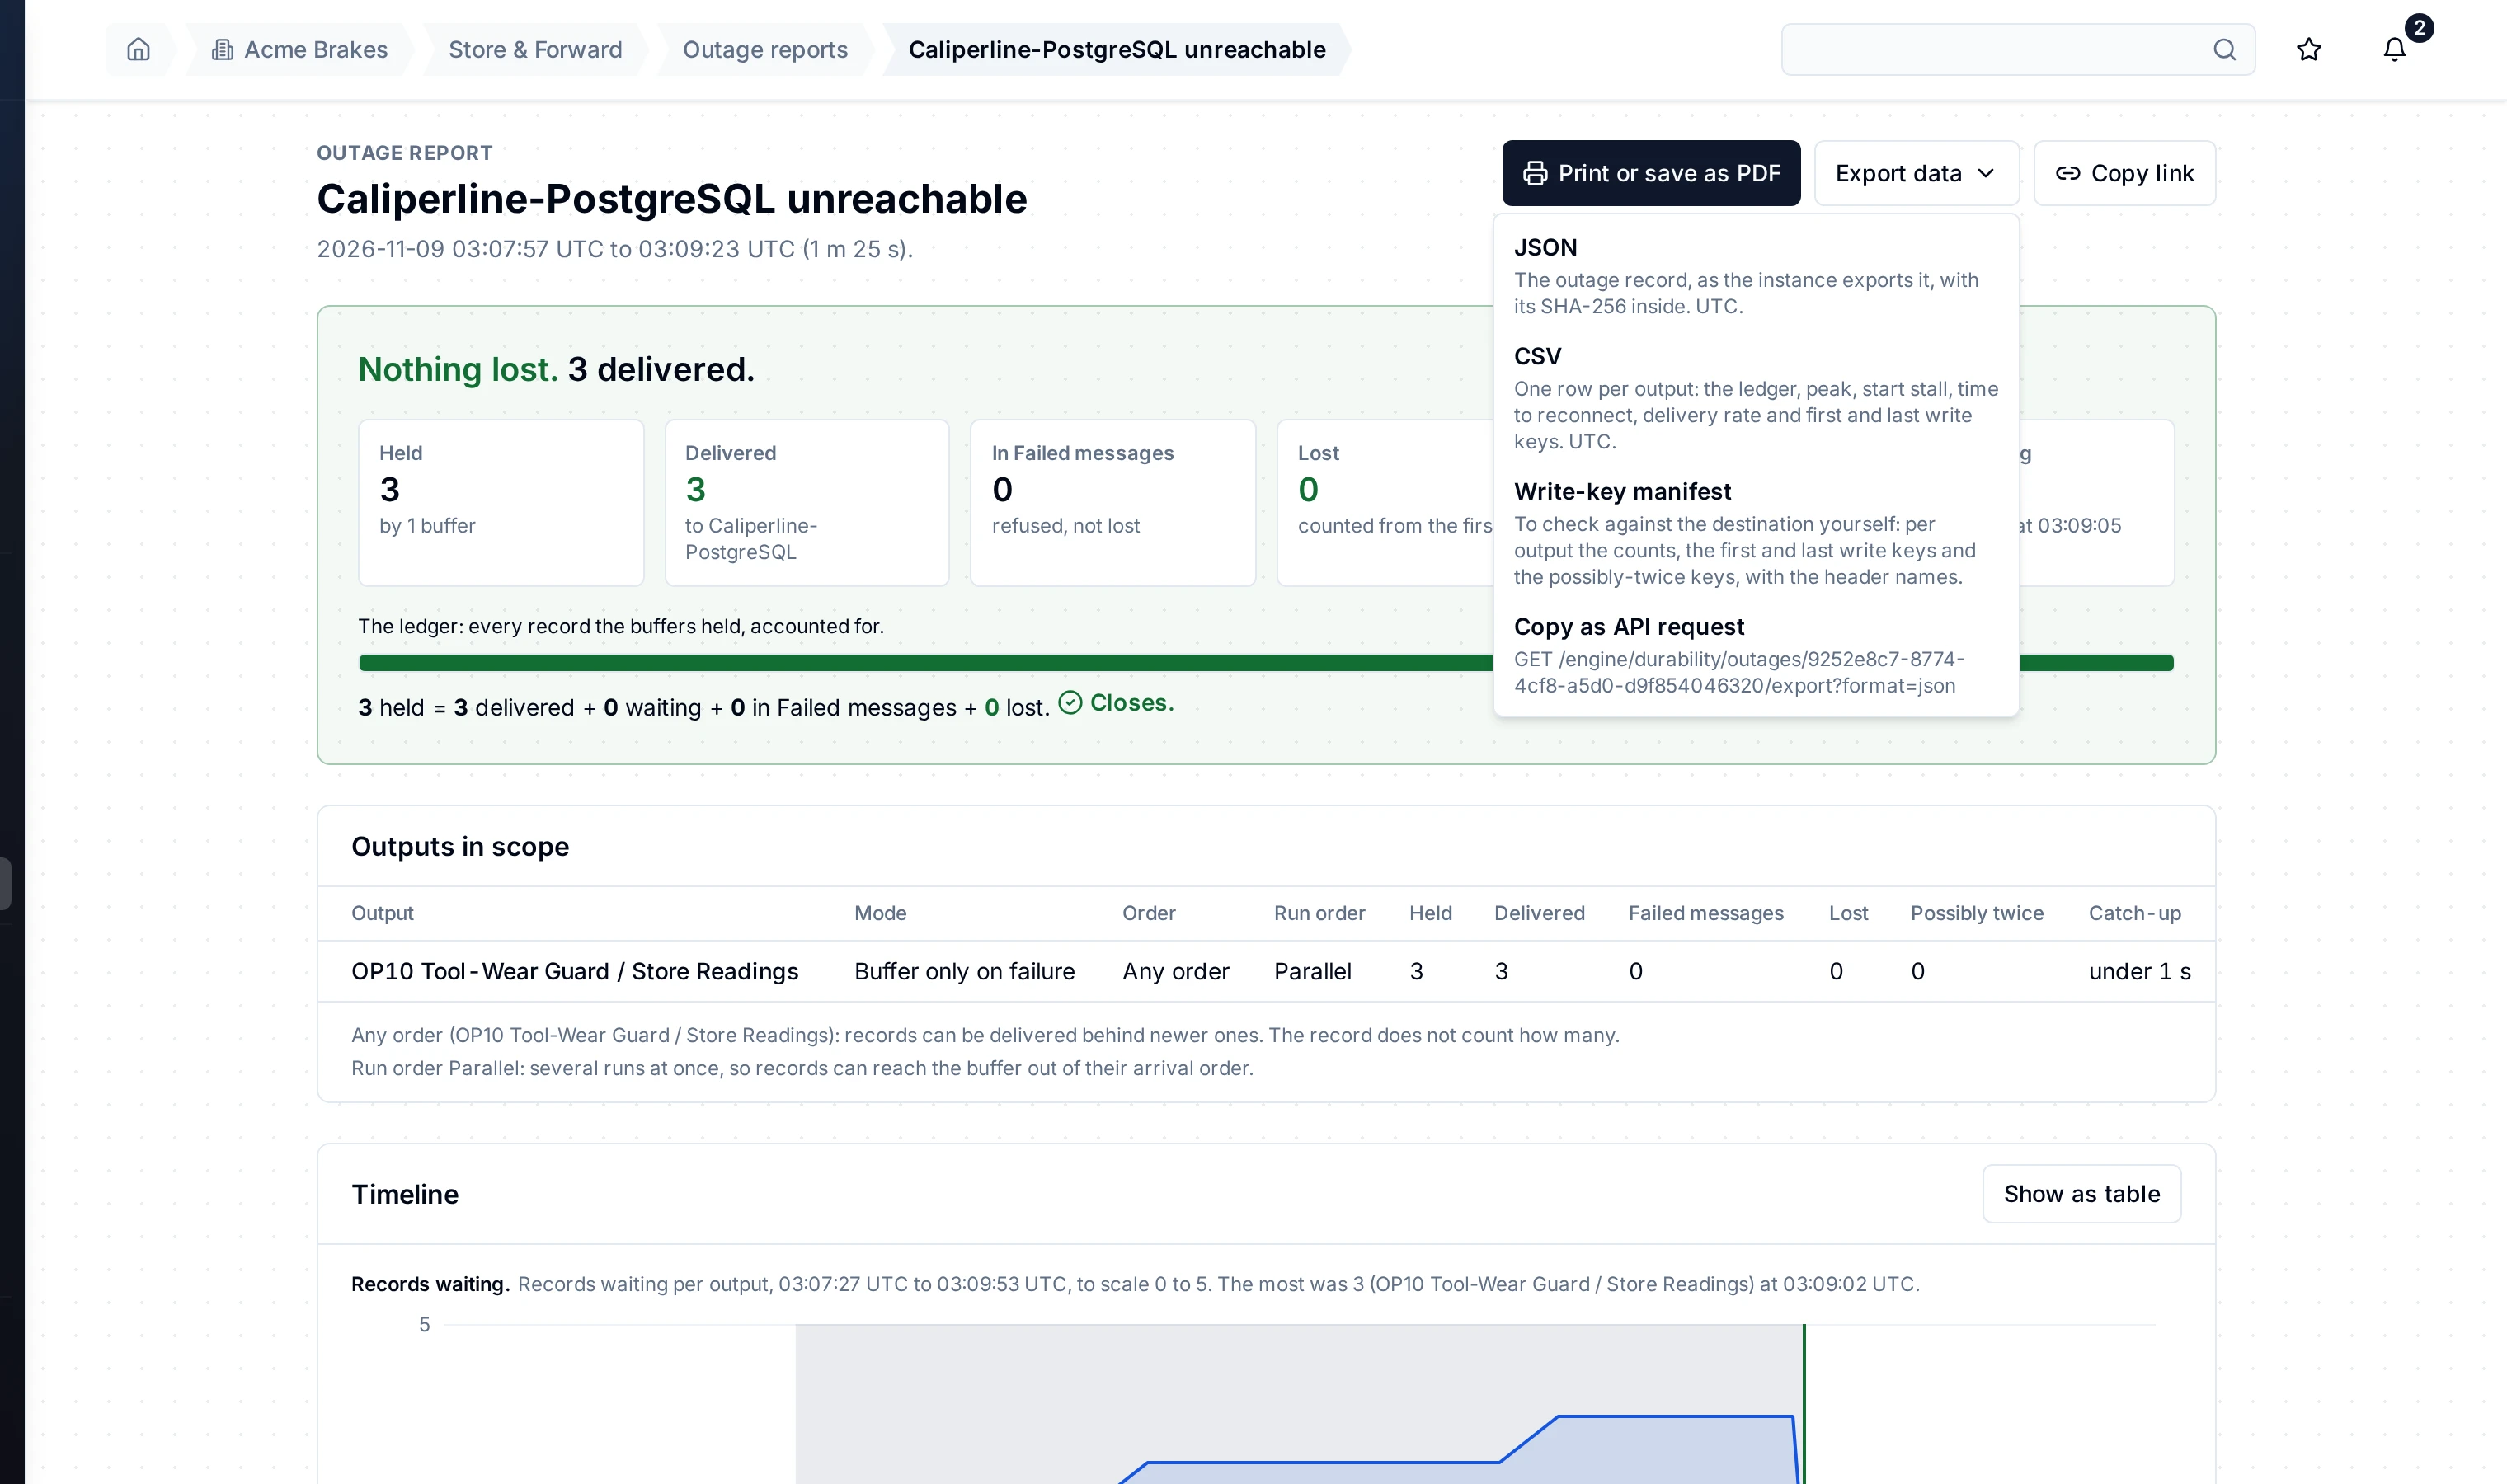
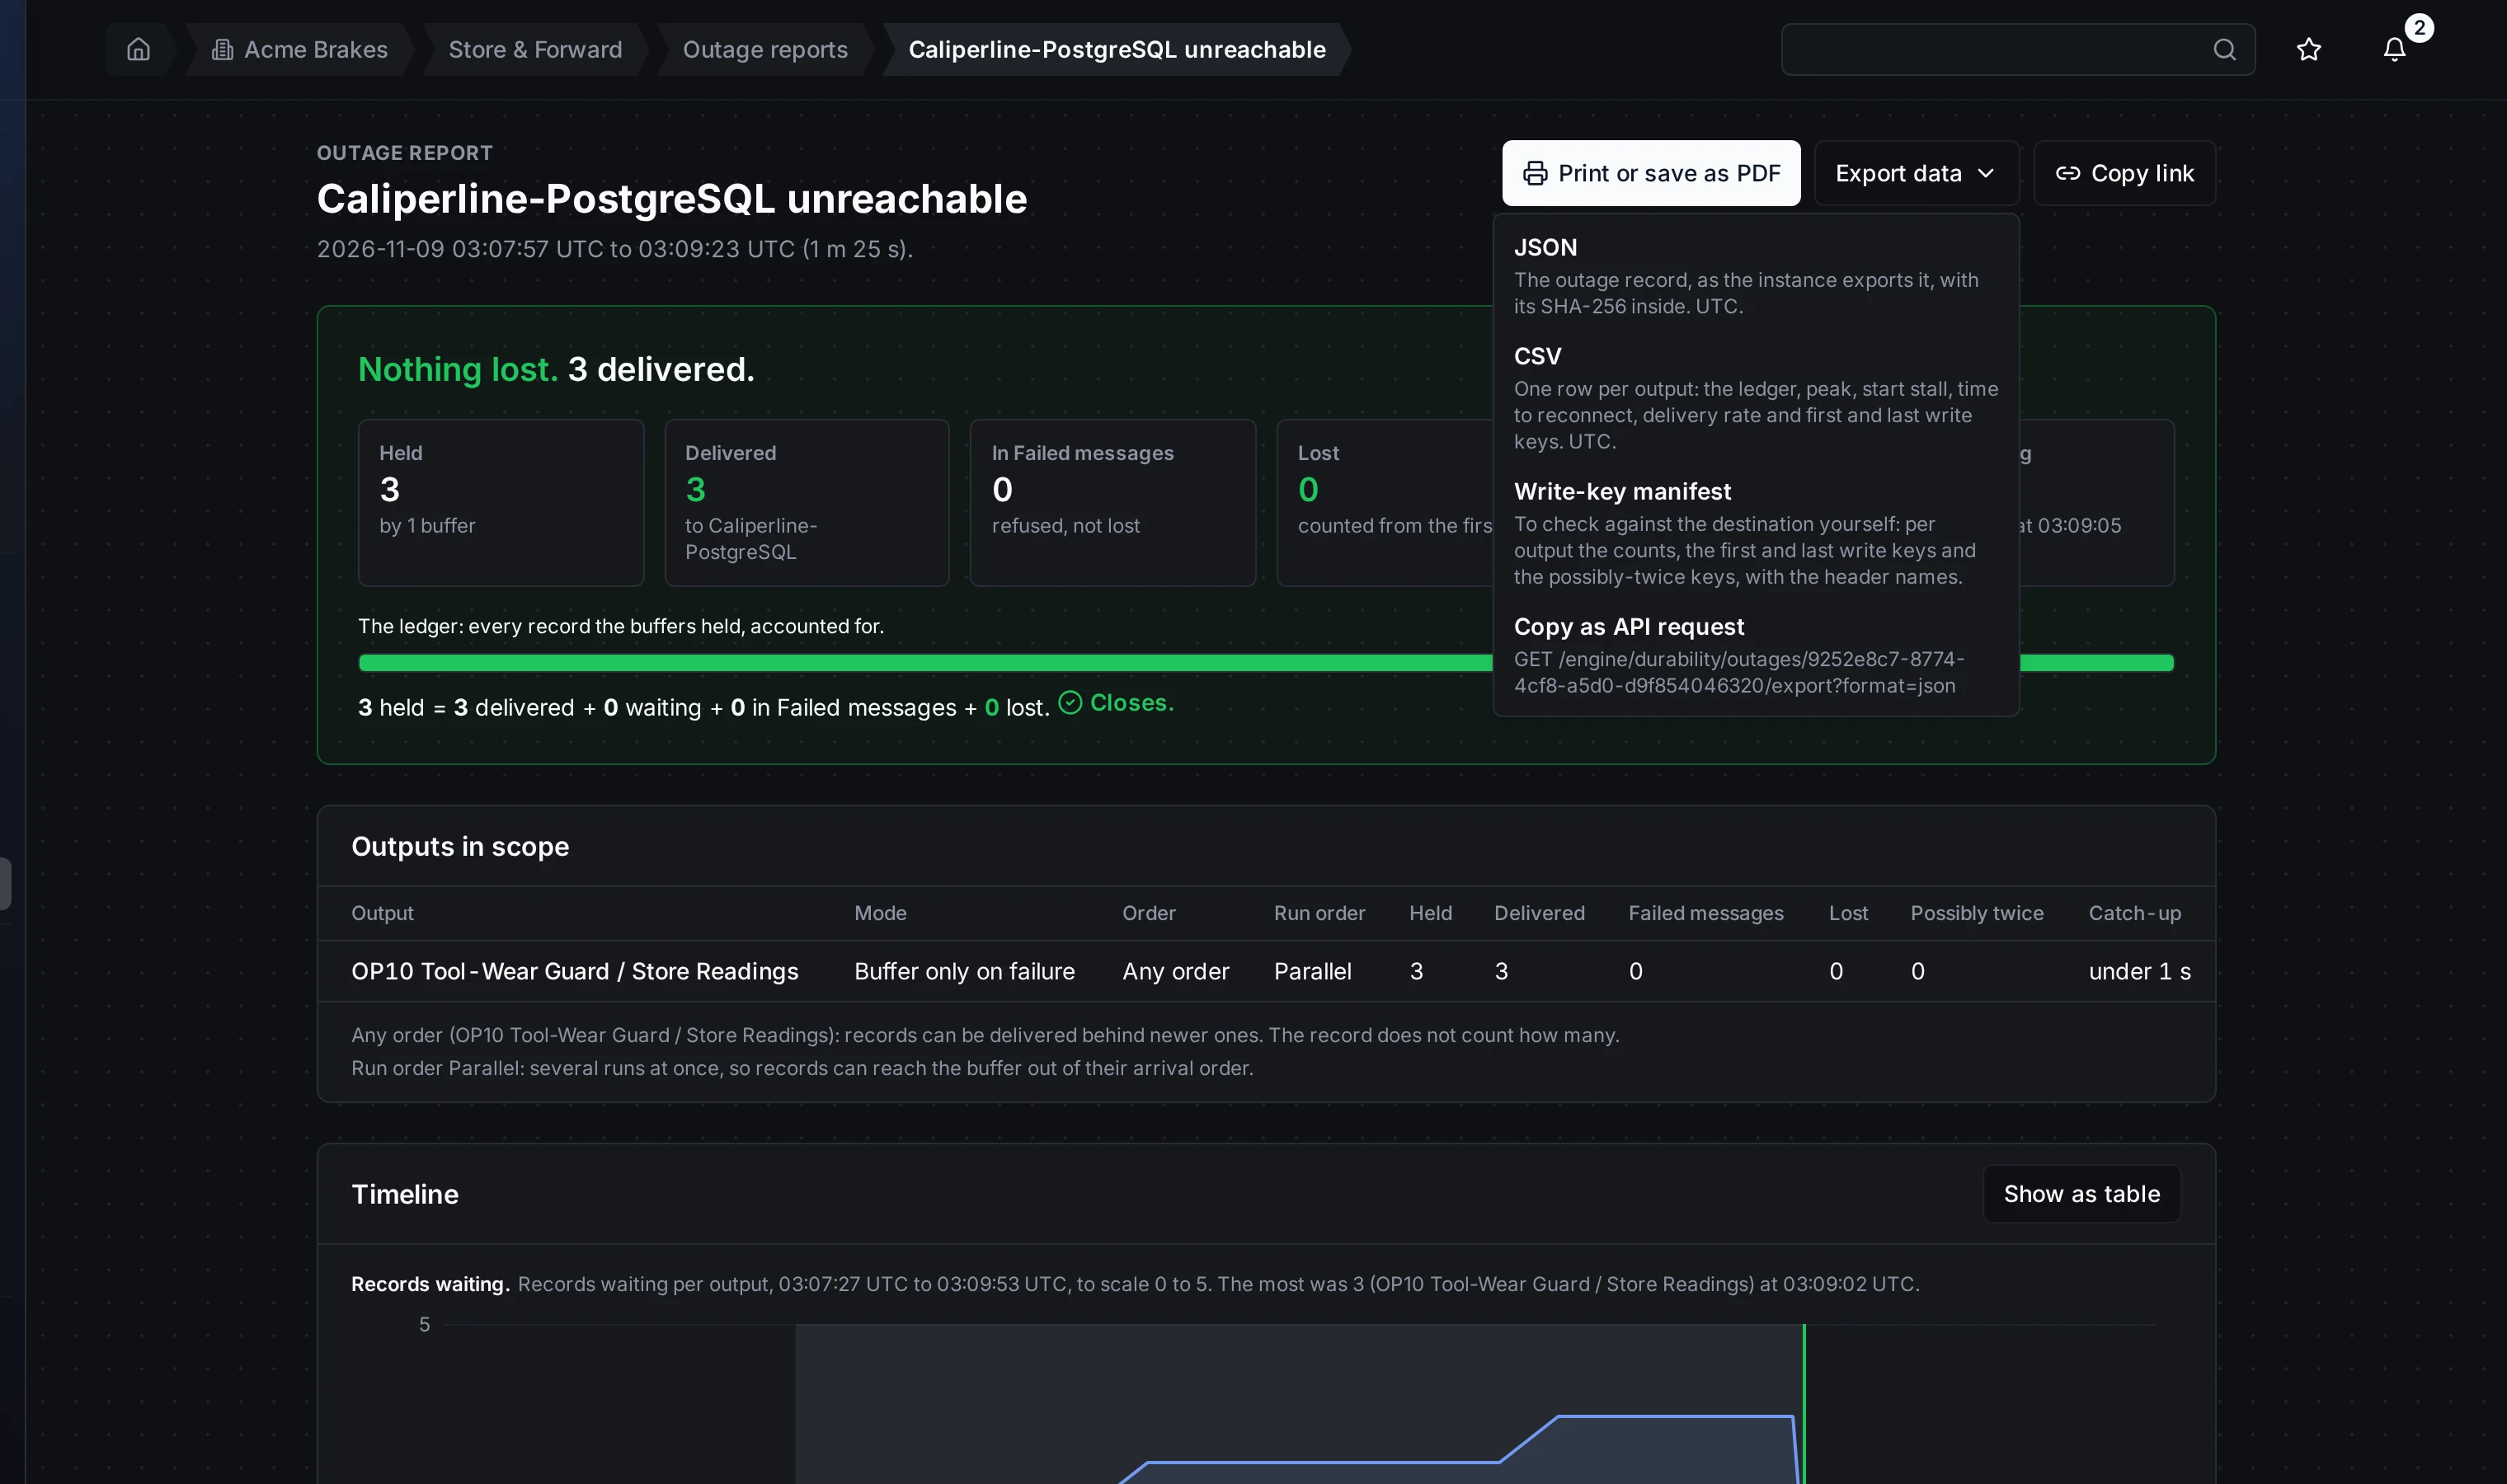
Export data: the instance's own files, and the API request.
Check a copy
Check a copy of this report shows what the instance computes for its JSON export now:
- SHA-256 of the JSON export: the digest of the whole file. It is also in the download's
Content-DigestandX-MaestroHub-Report-SHA256headers. - SHA-256 of the report inside it: the digest the file carries in its
integrityfield. - Signature, with the instance key and algorithm, when the instance signs its reports. Without one, the report says Not signed: the digest proves a copy matches this instance, not who made it.
An outage that has ended is the same file every time, so a copy downloaded later has the same digest. While it is open, the file and its digest change.
On a phone
The report is one column on a phone. The tables scroll sideways inside their card; the page itself does not.

The same report at phone width.
API
| Request | Returns |
|---|---|
GET /api/v1/engine/durability/outages | The outages, newest first. days (1 to 90) or from and to (at most 90 days apart), state, drill, lost (true: outages that lost a record), connectorId, limit (1 to 100), cursor |
GET /api/v1/engine/durability/outages/{id} | One outage with each output's record, its timeline, and the instance |
GET /api/v1/engine/durability/outages/{id}/export?format=json | The report file. format is json, csv or manifest |
GET /api/v1/engine/durability/outages/{id}/export/digest?format=json | The instance's digest of that file now |
Every request needs durability:read in the workspace. Another workspace's outage answers 404.