Live Monitor
Live Monitor is the operational canvas that turns UNS real-time streams into an at-a-glance story. Shop-floor signals, line performance indicators, and critical alarms converge in a single window so teams can intervene immediately.
Why Live Monitor? Real-time data only creates value when it is observed. This screen listens to UNS topics and keeps the pulse of your processes.
Real-Time Monitoring Experience
Live Monitor connects to the topics you care about and surfaces the feed within seconds. Start or mute subscriptions on the fly, filter messages by context, and—when needed—publish test payloads to validate the end-to-end flow without switching tools.
Anatomy of the Workspace
Topic Explorer
Presents the UNS hierarchy as a searchable tree so you can descend from plants to individual devices. A single click subscribes to the selected branch, making context switching effortless and offering a perfect anchor for navigation-focused screenshots.
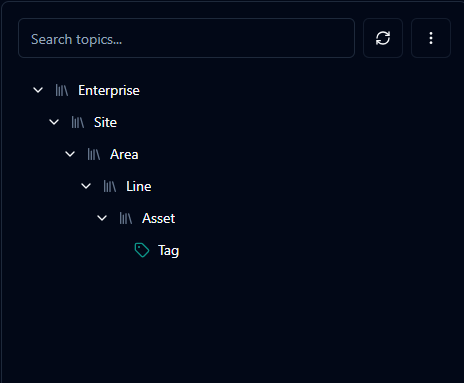
Searchable UNS hierarchy with plant, line, and asset levels.
Subscription Bar
Renders every active topic as a tag, including connection state and quick actions. Operators can pause noisy streams or confirm that critical feeds remain active—ideal for visuals emphasising colour-coded states and counters.
Message Stream
Displays incoming messages as context cards with JSON and raw views. Built-in filters and search surface anomalies or specific values, so accompanying images can highlight timestamps, payloads, and metadata callouts.
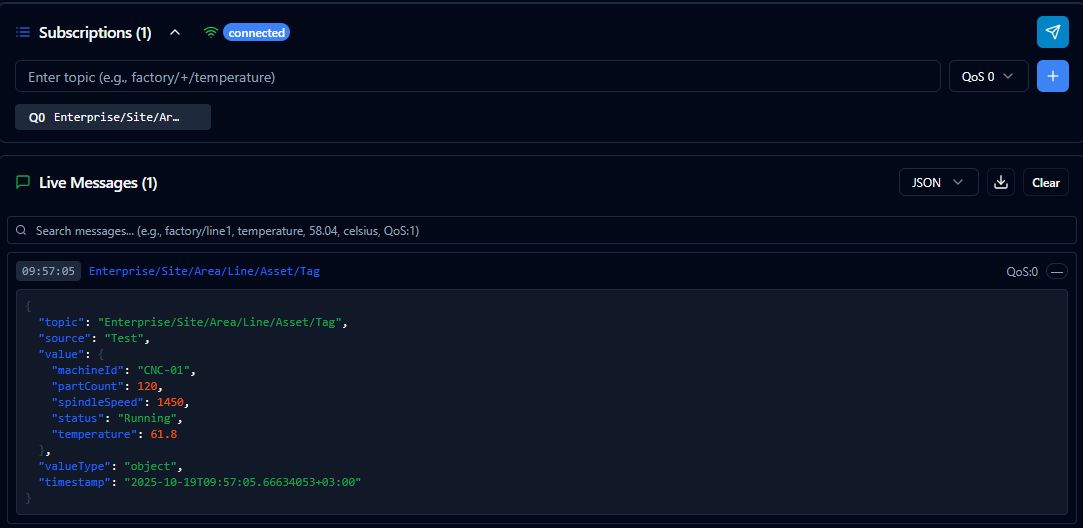
Filter, inspect, and export live UNS messages from the stream.
Publisher Window
Sends test payloads to the selected topic with optional encryption toggles. It enables end-to-end validation without leaving the monitor experience, making it well suited for imagery that showcases form fields, encryption switches, and publish feedback.
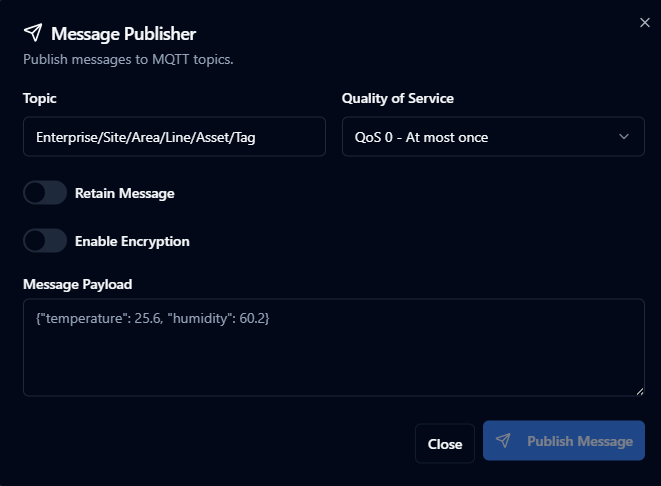
Send plain or encrypted payloads through the Live Monitor publisher.
Sample Operational Flow
Step 1 – Choose the line you want to observe from the Topic Explorer; hierarchy filters drill down to individual devices.
Step 2 – A new tag appears in the Subscription Bar, confirming the connection and the first incoming messages.
Step 3 – Use the search box in the Message Stream to highlight critical keywords; clear the list when you want a fresh wave of events.
Step 4 – Publish a test message from the Publisher Window to confirm a suspected scenario and watch the response live.
This loop gives production teams and integration specialists a shared visual checkpoint for validating field behaviour.
Proactive Use Cases
Rapid Alarm Review
When an unexpected downtime alert appears, listen to the relevant topic live to confirm whether it repeats and capture evidence if needed.
Quality Deviation Tracking
Quality teams monitor tolerance thresholds. Live Monitor highlights the exact moment a deviation occurs, enabling immediate feedback to the line.
Maintenance Verification
After preventative maintenance, short-lived subscriptions confirm that sensors are producing accurate readings. Synthetic payloads validate the behaviour of downstream systems.
Advanced Tactics
Smart subscriptions: Focus on the branches that matter—narrow topics minimise noise and accelerate judgement calls.
Inline notes: Store physical location, owning team, or alarm thresholds directly in topic descriptions to simplify handovers.
Encrypted tests: Send either plain or encrypted payloads depending on policy; keys are never stored, prompting secure re-entry for every test.
Data traces: When you capture a critical event, export the JSON bundle and attach it to your root-cause documentation.
Live Monitor translates UNS data into an actionable narrative. Regardless of the line, device, or team, everyone engages with the same source of truth and operational decisions speed up.