Historical Data
Historical Data is the time tunnel for UNS, designed to explore previously stored messages. It validates live observations, highlights trends, and adds long-term context to decision making.
Why Historical Data? Real-time signals gain meaning when viewed alongside their history. This screen shows how events unfolded over days, hours, and even minutes.
The Role of Historical Records
Reading Trends
How have production speed, quality metrics, or energy consumption evolved? Historical Data stacks timelines to reveal persistent deviations.
Root-Cause Discovery
Diagnosing an alarm often starts by looking back. By revisiting earlier records of the same topic you can pinpoint when the trend diverged and accelerate troubleshooting.
Verifying Change
When a process improvement is deployed, this view compares before-and-after data sets to confirm whether the intervention delivered measurable impact.
Anatomy of the Analysis Studio
Time Selector
Limits the data set with preset windows or a custom range. Start narrow for focus and widen only if additional context is required—perfect for visuals that emphasise the date/time picker.
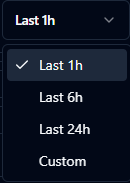
Choose preset windows such as last 1 hour, 6 hours, or 24 hours.
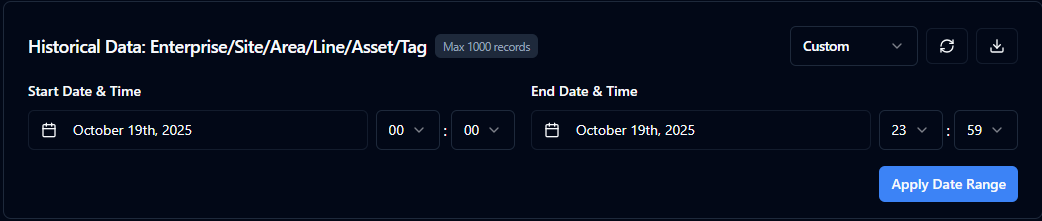
Switch to a custom range to fine-tune start and end timestamps.
Filter Area
Applies keyword searches and advanced conditions. Pair quick checks with advanced expressions to isolate the exact slice of data you need, then save the most effective filters for repeated use across investigations.
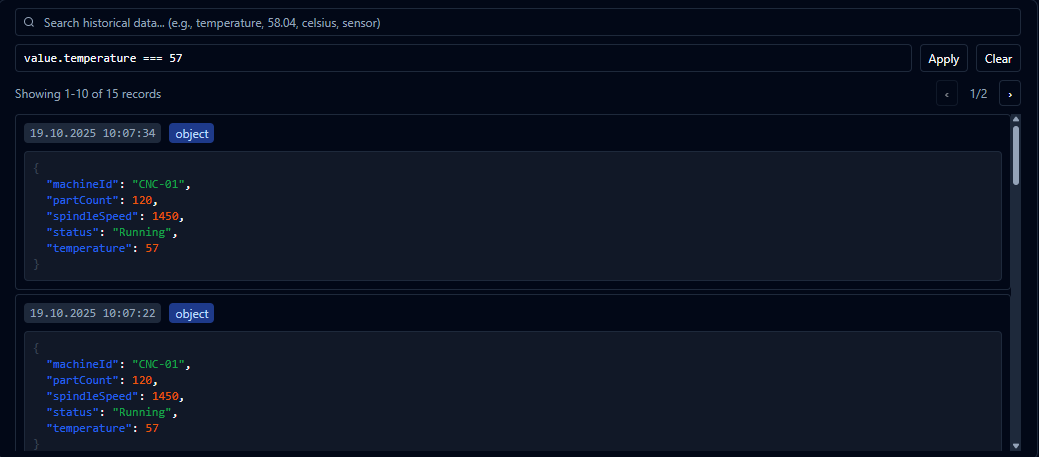
Combine search terms and expressions to surface the exact records you need.
Usage Examples
These grouped tables highlight the most common filter patterns—from numeric checks to text queries and time-based validation. Copy any expression straight into the filter editor to move faster.
Basic and Logical Checks
| # | Use Case | Filter Expression | Description |
|---|---|---|---|
| 1 | Simple Comparison | value > 50 | Records with values greater than 50 |
| 2 | Equality Check | value === 100 | Records with value exactly 100 |
| 4 | AND Condition | value.temp > 20 && value.temp < 30 | Temperature between 20 and 30 |
| 11 | Compound Condition | value.line === "LineA" && value.count > 100 | Line A with production over 100 |
| 12 | Type Check | typeof value === "number" && value > 0 | Positive numeric entries |
| 21 | Math Operations | value.total / value.count > 25 | Average greater than 25 |
| 24 | Not Equal | value.status !== "idle" | Records not in idle state |
| 25 | In Range | value >= 20 && value <= 80 | Values within the 20-80 interval |
Object and Property Checks
| # | Use Case | Filter Expression | Description |
|---|---|---|---|
| 3 | Object Property | value.temperature > 25 | Temperature greater than 25 |
| 9 | Nested Object | value.device.location.floor === 2 | Devices located on floor 2 |
| 10 | Optional Chaining | value.sensor?.temperature > 30 | Sensor exists and temperature above 30 |
| 13 | Null Check | value.error !== null && value.error !== undefined | Records that contain an error value |
| 19 | ValueType Check | valueType === "object" | Entries where the value type is object |
| 20 | Complex Logic | value.shift === "morning" && value.production > 50 && value.defect < 5 | Morning shift with high output and low defects |
Text and Array Operations
| # | Use Case | Filter Expression | Description |
|---|---|---|---|
| 5 | OR Condition | value.status === "error" || value.status === "warning" | Records in error or warning state |
| 6 | String Contains | includes(value.name, "sensor") | Names that include "sensor" |
| 7 | String Starts With | startsWith(value.deviceId, "CNC") | Device IDs starting with "CNC" |
| 8 | String Ends With | endsWith(value.location, "01") | Locations ending with "01" |
| 14 | Array Check | Array.isArray(value.tags) && value.tags.length > 0 | Records with at least one tag |
| 15 | Array Contains | value.tags?.includes("critical") | Tags that include "critical" |
| 22 | String Regex | /^TEMP/.test(value.sensorType) | Sensor types that start with "TEMP" |
Operators
Use this cheat sheet to quickly recall the core operators behind your filter expressions.
| Category | Operator | Description | Example |
|---|---|---|---|
| Comparison | > | Greater than | value > 50 |
| Comparison | < | Less than | value < 100 |
| Comparison | >= | Greater than or equal | value >= 50 |
| Comparison | <= | Less than or equal | value <= 100 |
| Equality | === | Strict equality | value === 50 |
| Equality | !== | Strict inequality | value !== null |
| Equality | == | Equality with coercion | value == "50" |
| Equality | != | Inequality with coercion | value != null |
| Logical | && | AND | value > 20 && value < 80 |
| Logical | || | OR | value < 20 || value > 80 |
| Logical | ! | NOT | !value.isDisabled |
| Optional | ?. | Optional chaining | value.sensor?.temp |
| Nullish | ?? | Nullish coalescing | value.name ?? "Unknown" |
Result Panel
Displays records as cards with timestamp and payload positioned side by side. Use imagery that zooms in on JSON payloads, value types, and navigation controls for long lists.
Export Control
Downloads visible records with a single click. Showcase the JSON export button or confirmation toast to illustrate how analysts capture evidence for reports.
Review Path
Step 1 – Choose the topic you want to analyse; the header summary confirms the data set in focus.
Step 2 – Apply a preset window such as Last 6h or Last 24h; if nothing appears, define an exact range with Custom.
Step 3 – Add keywords or build advanced filters to surface the relevant records and run threshold checks on specific fields.
Step 4 – Export the findings with Download; topic and time references in the filename keep handovers consistent.
Analytical Scenarios
Production Performance
Compare records before and after an incident to isolate the moment downtime was triggered. Note trend breaks to feed future improvement plans.
Quality Monitoring
When sample results go out of limits, drill into previous production batches to confirm whether the behaviour is repeating.
Energy Optimisation
Track consumption across weeks, shifts, or lines to expose inefficiencies and hand actionable insights to the relevant teams.
Good Practices
Focused queries: Test your hypothesis with a narrow window first, then widen the scope if required.
Data stewardship: Align retention policies with your stakeholders; confirm that data still exists before escalating missing records.
Dual-screen workflow: Keep Live Monitor open next to Historical Data to compare live anomalies with their historical pattern in real time.
Sharing discipline: Preserve exported filenames to maintain traceability of analysed scenarios.
Filter templates: Document your frequently used advanced filters so recurring analyses become a matter of seconds.
Historical Data unlocks the digital memory of UNS. By combining live findings with historical evidence you can clearly see where your processes are resilient and where additional optimisation is needed.