Walkthrough: Claude Code
Four prompts in Claude Code built, tested and enabled three pipelines and a sixteen-panel dashboard on the Caliperline demo factory, through MaestroHub MCP alone.
- Prerequisites
- Digital Factory Simulator easy setup
- Client
- Claude Code · Claude Opus 5.5
- Protocols
- Modbus · OPC UA · REST · UNS
- Result
- 3 pipelines · 1 dashboard with 16 panels
This walkthrough records one real session: Claude Code with Claude Opus 5.5, connected to a MaestroHub 3.0 instance running the Digital Factory Simulator. Everything below is what the session did, quoted from its own reports; nothing was built or fixed by hand.
The Caliperline connections come from the Digital Factory Simulator easy setup. Run it first if you want to follow along; the session works from those connections and the topics their collectors publish.
Setup
The session used the .mcp.json from the Claude Code page, with a Personal Access Token scoped to the workspace. These are the scopes it needed, and no more:
| Scope | Why |
|---|---|
connectors:read, functions:read | Find the Caliperline connections and the functions on them |
uns:read | Sample the topics the collectors publish, and read back its own results |
pipelines:read, pipelines:write | Create the pipelines and fix them |
pipelines:execute | Dry-run the pipelines before enabling them, and enable them |
dashboards:read, dashboards:write, library_panels:read | Build the dashboard |
workspaces:read | Resolve the workspace the token belongs to |
Without pipelines:execute, the assistant can save pipelines but cannot test or enable them: it saves them disabled and says so.
Claude Code also has local tools: a shell, file editing, background commands. For a session that should only work in MaestroHub, start it with the built-in tools turned off, so the MaestroHub MCP tools are all it has:
claude --tools "" --mcp-config .mcp.json
In this session the assistant used local tools twice: a timer while it waited for scheduled runs, and, while building the dashboard, an attempt to install a charting library to test its panels; that attempt was stopped and the session resumed with built-in tools off (see Part 3).
Part 1: Building the Pipelines
Prompt:
Can you design and implement some pipelines using the Caliperline connections?
What the assistant did (54 MCP calls, about 5 minutes):
- Read
pipeline_builder_guidefor the node types and the output shape of each. - Listed the Caliperline connections and the functions on each, then sampled the topics the existing collectors publish with
query_topic_data, to see real values and ranges. - Listed the pipelines already on the plant and aimed at gaps: collection, OP10 tool wear, OP20 tool life and part tracing were covered already.
- Validated each design with
manage_pipelinesvalidate_draft, created it, and dry-ran it withdry_run, on a real event and on invented failure cases (a 0.72 cc/min leak, a test at 14.41 bar, a 6.8 °C drop in wash temperature). - Saved all three disabled: they had only been dry-run, so it had not yet seen them talk to the real Modbus, OPC UA and REST endpoints.
It also named the limits it had chosen itself (the OP30 pressure band) as a decision for the reader, and said it could not create new functions with this token, so it used the existing ones.
Pipeline 1: OP40 Leak Test Quality Gate
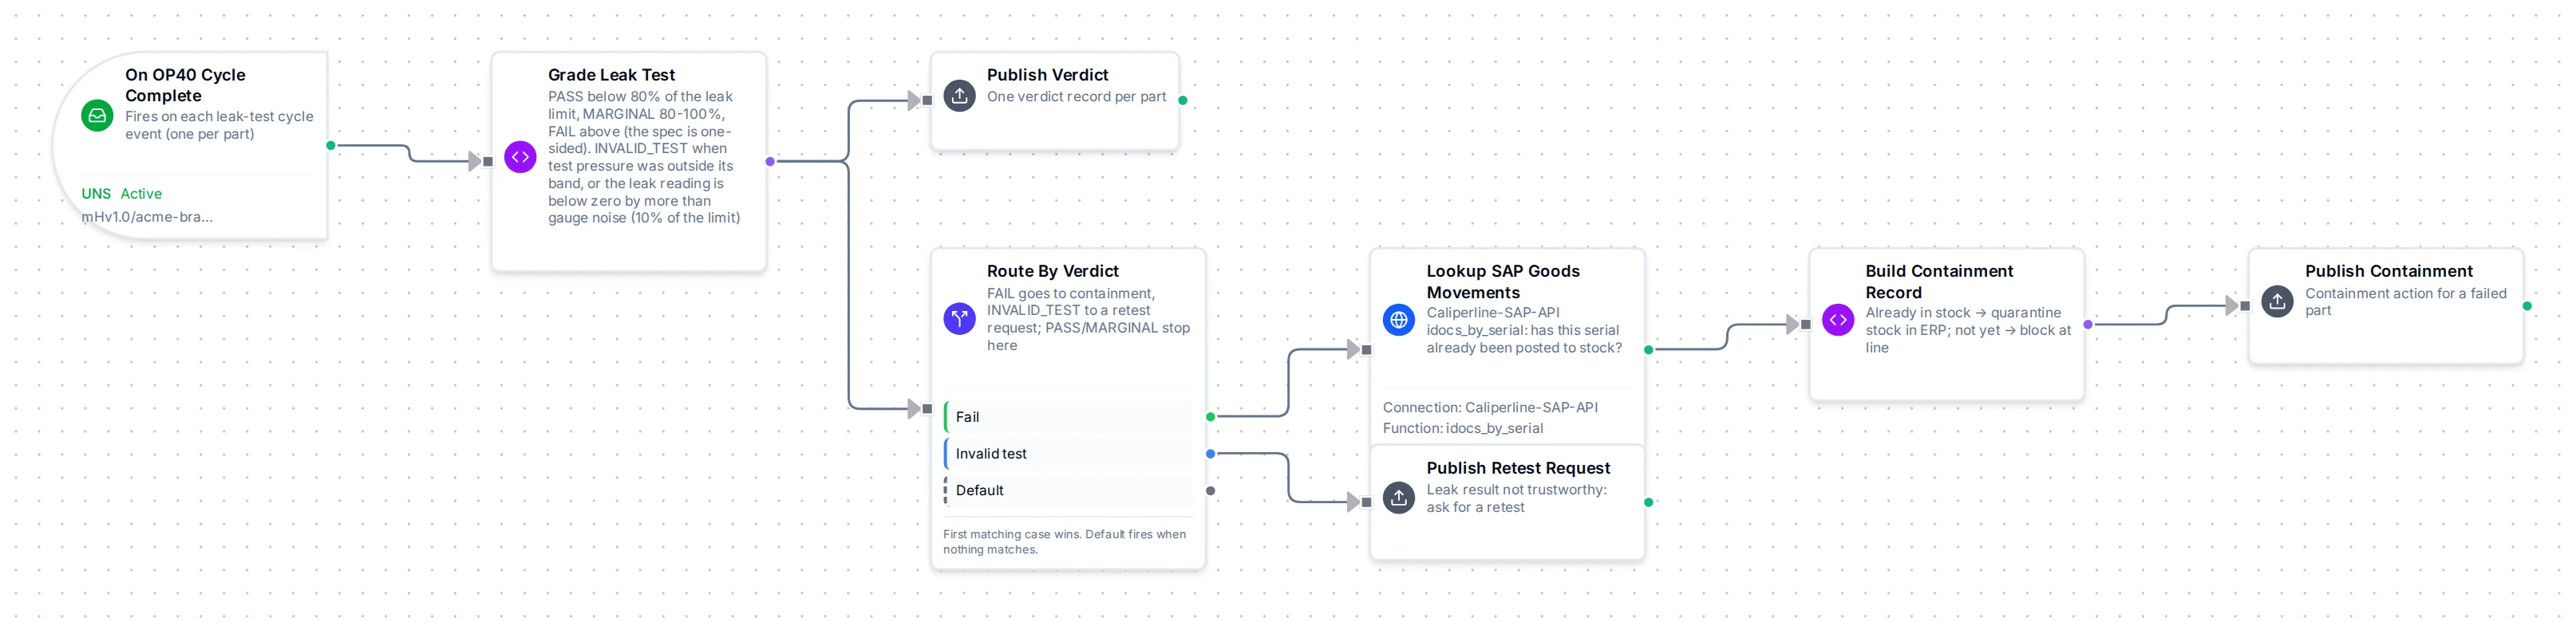
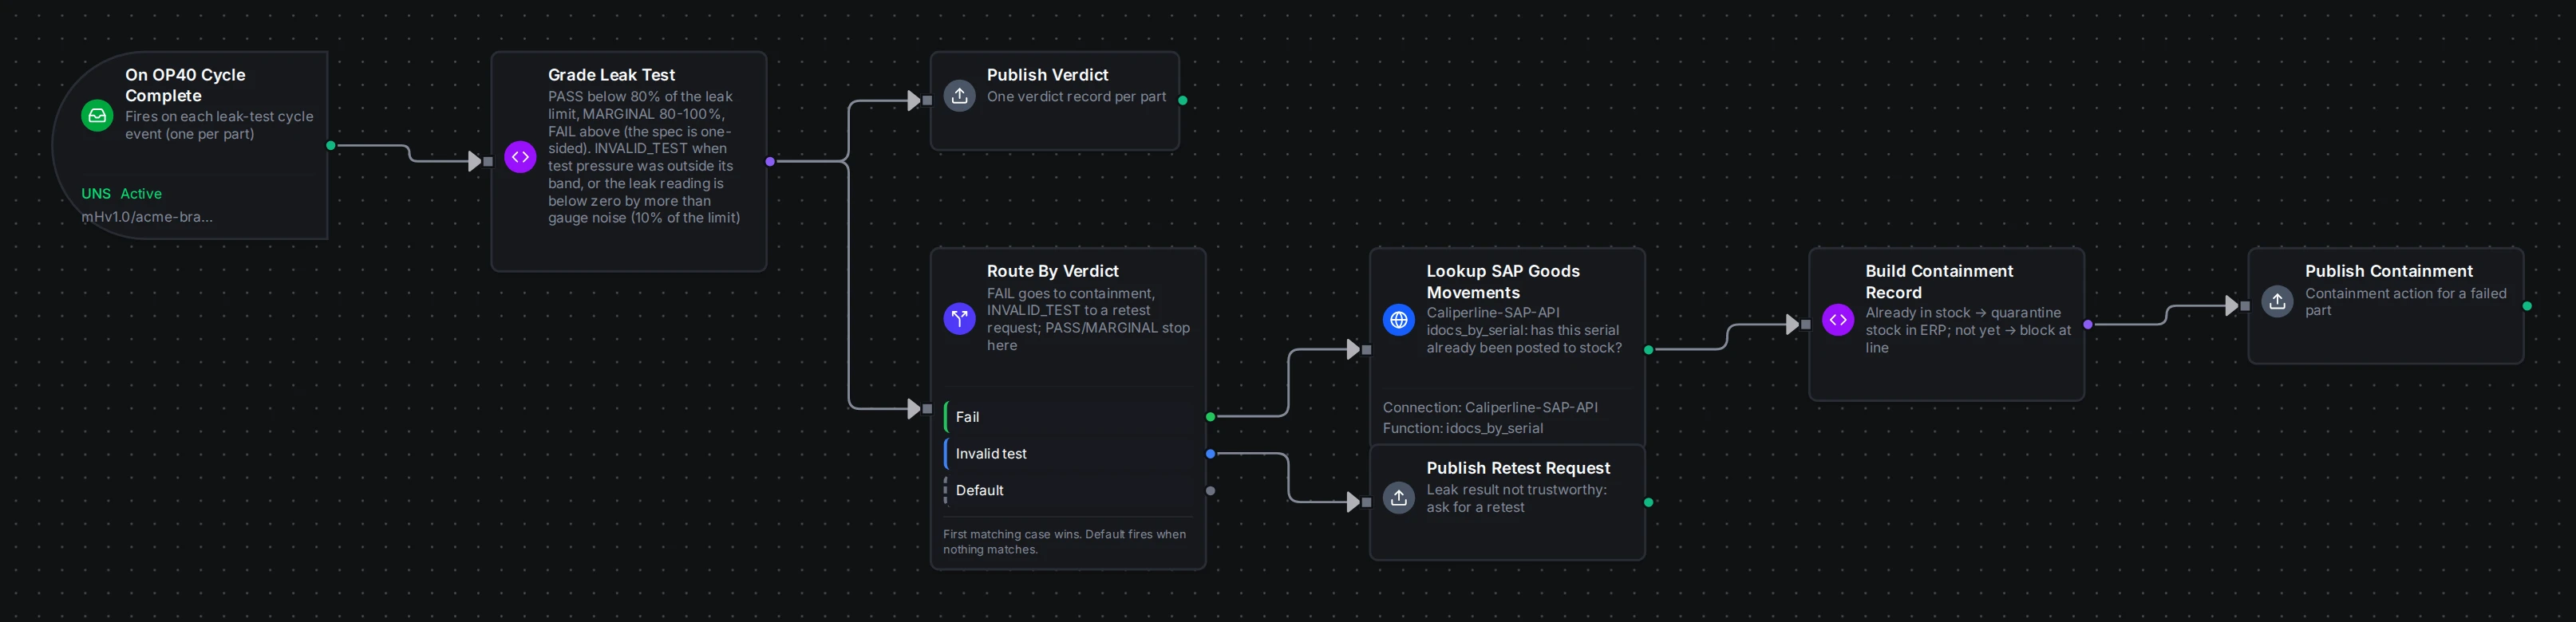
Every OP40 cycle: grade the leak test, publish the verdict, and on a FAIL ask SAP whether the part is already in stock
| Node | Type | Purpose |
|---|---|---|
| On OP40 Cycle Complete | trigger.uns.subscribe | One run per part: the test station's cycle-complete event, with its measurements and serial |
| Grade Leak Test | logic.javascript | PASS, MARGINAL (80 to 100% of the limit), FAIL, or INVALID_TEST when the test pressure was out of tolerance |
| Publish Verdict | system.uns.publish | dfs/LINE-BC-01/quality/leak_test/verdict |
| Route By Verdict | logic.switch | FAIL to containment, INVALID_TEST to a retest request |
| Lookup SAP Goods Movements | connected.rest.request | Asks SAP (idocs_by_serial) whether the part was already received into stock |
| Build Containment Record | logic.javascript | QUARANTINE_STOCK when it was, BLOCK_AT_LINE when not |
| Publish Containment / Publish Retest Request | system.uns.publish | …/leak_test/containment, …/leak_test/retest_request |
The grading reads the event the trigger delivers, $trigger.result, and each part's own tolerance from its measurements. This is the code as it ran after the fix in Part 2:
const e = $trigger.result || {};
const ms = Array.isArray(e.measurements) ? e.measurements : [];
const leak = ms.find(m => m.Feature === 'Leak Rate');
const pres = ms.find(m => m.Feature === 'Test Pressure');
const MARGINAL_FRACTION = 0.8;
// A leak spec is one-sided: only a reading above the limit is a leak. A small negative
// reading is gauge noise around zero; one far below zero means the gauge needs re-zeroing.
const NOISE_FRACTION = 0.1;
// ...
if (!presOk) {
  verdict = 'INVALID_TEST';
} else if (leak.Value < noiseFloor) {
  verdict = 'INVALID_TEST';
} else if (leak.Value > leak.ToleranceMax) {
  verdict = 'FAIL';
} else if (leak.Value >= leak.ToleranceMax * MARGINAL_FRACTION) {
  verdict = 'MARGINAL';
} else {
  verdict = 'PASS';
}
Pipeline 2: OP30 Wash Process Health
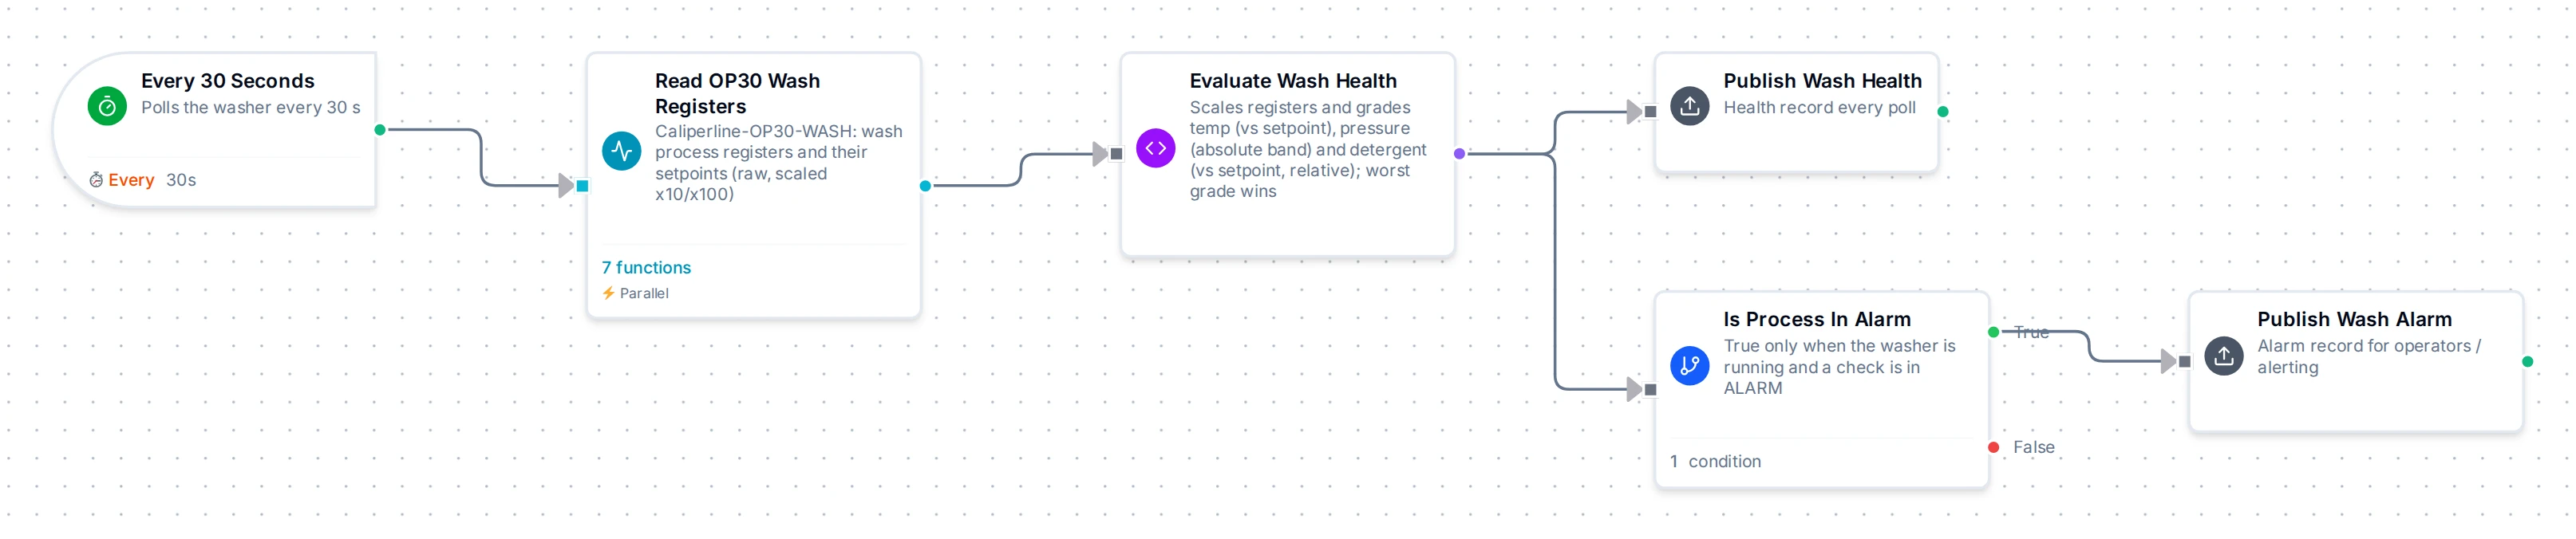
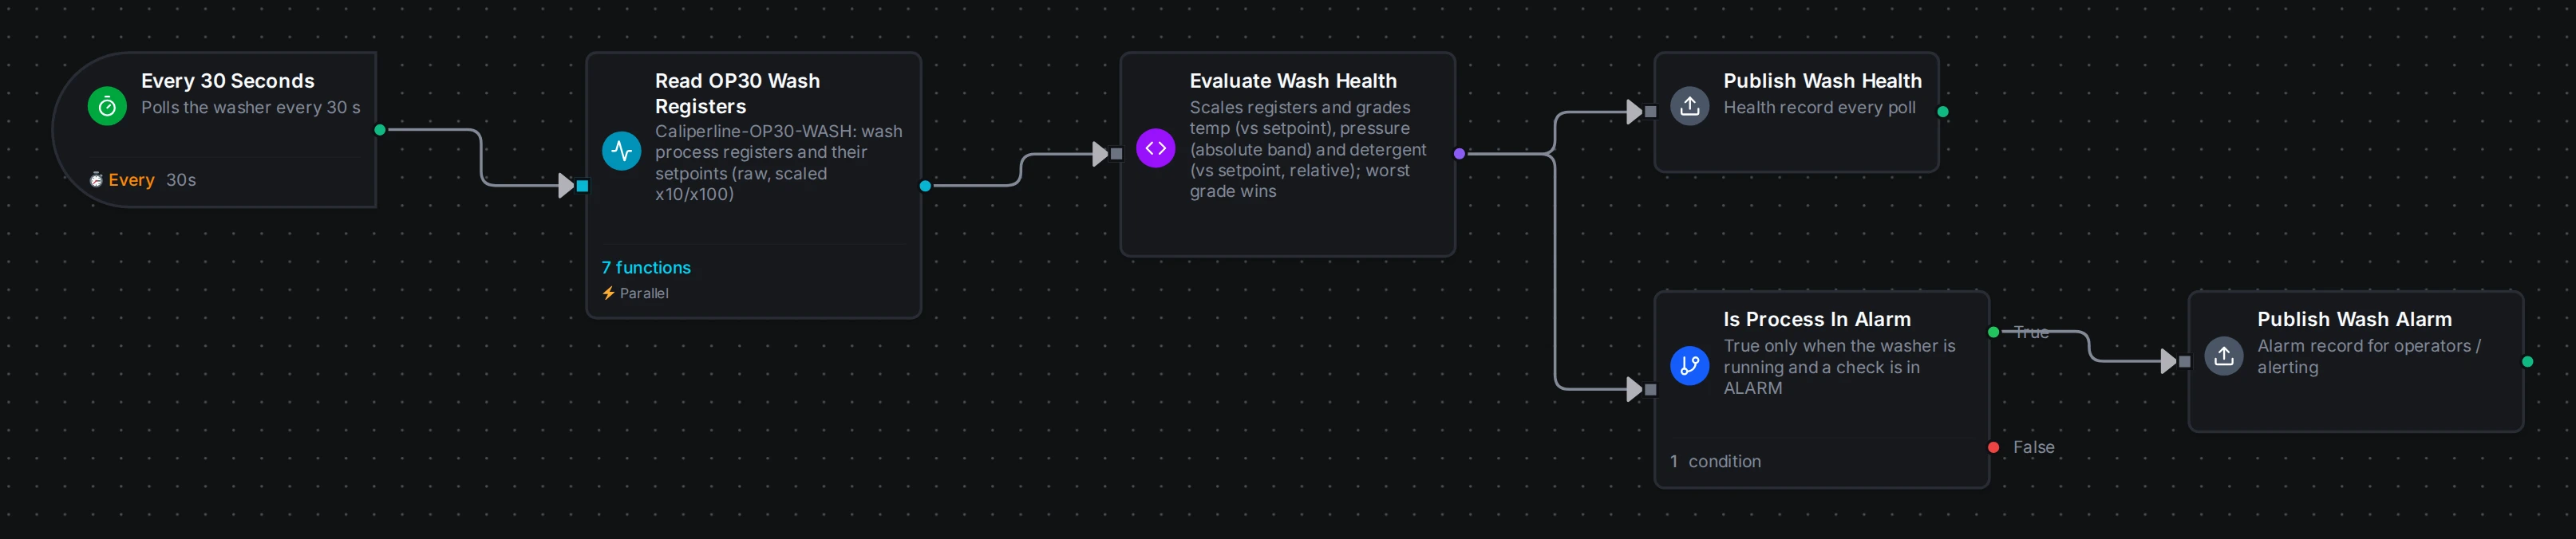
Every 30 seconds: read the washer over Modbus, grade it against its setpoints, and raise an alarm topic only when something is in ALARM
| Node | Type | Purpose |
|---|---|---|
| Every 30 Seconds | trigger.schedule | Polls every 30 s |
| Read OP30 Wash Registers | connected.modbus.readgroup | Seven registers: temperature, pressure, detergent, their setpoints, state and fault |
| Evaluate Wash Health | logic.javascript | Scales the raw registers and grades each value; only grades while the station is RUNNING |
| Publish Wash Health | system.uns.publish | dfs/LINE-BC-01/equipment/OP30-WASH/health, every cycle |
| Is Process In Alarm | logic.condition | Continues only when the status is ALARM |
| Publish Wash Alarm | system.uns.publish | …/OP30-WASH/alarms/process |
The bands sit at the top of the JavaScript node, where the assistant pointed the reader to set them from the washer's spec:
const r = $node['Read OP30 Wash Registers'].result || {};
// Bands; tune to the washer's spec.
const TEMP_WARN_C = 2.0, TEMP_ALARM_C = 5.0;
const PRES_WARN = [3.0, 4.2], PRES_ALARM = [2.5, 4.5];
const DET_WARN_REL = 0.10, DET_ALARM_REL = 0.20;
Pipeline 3: Line KPI Rollup
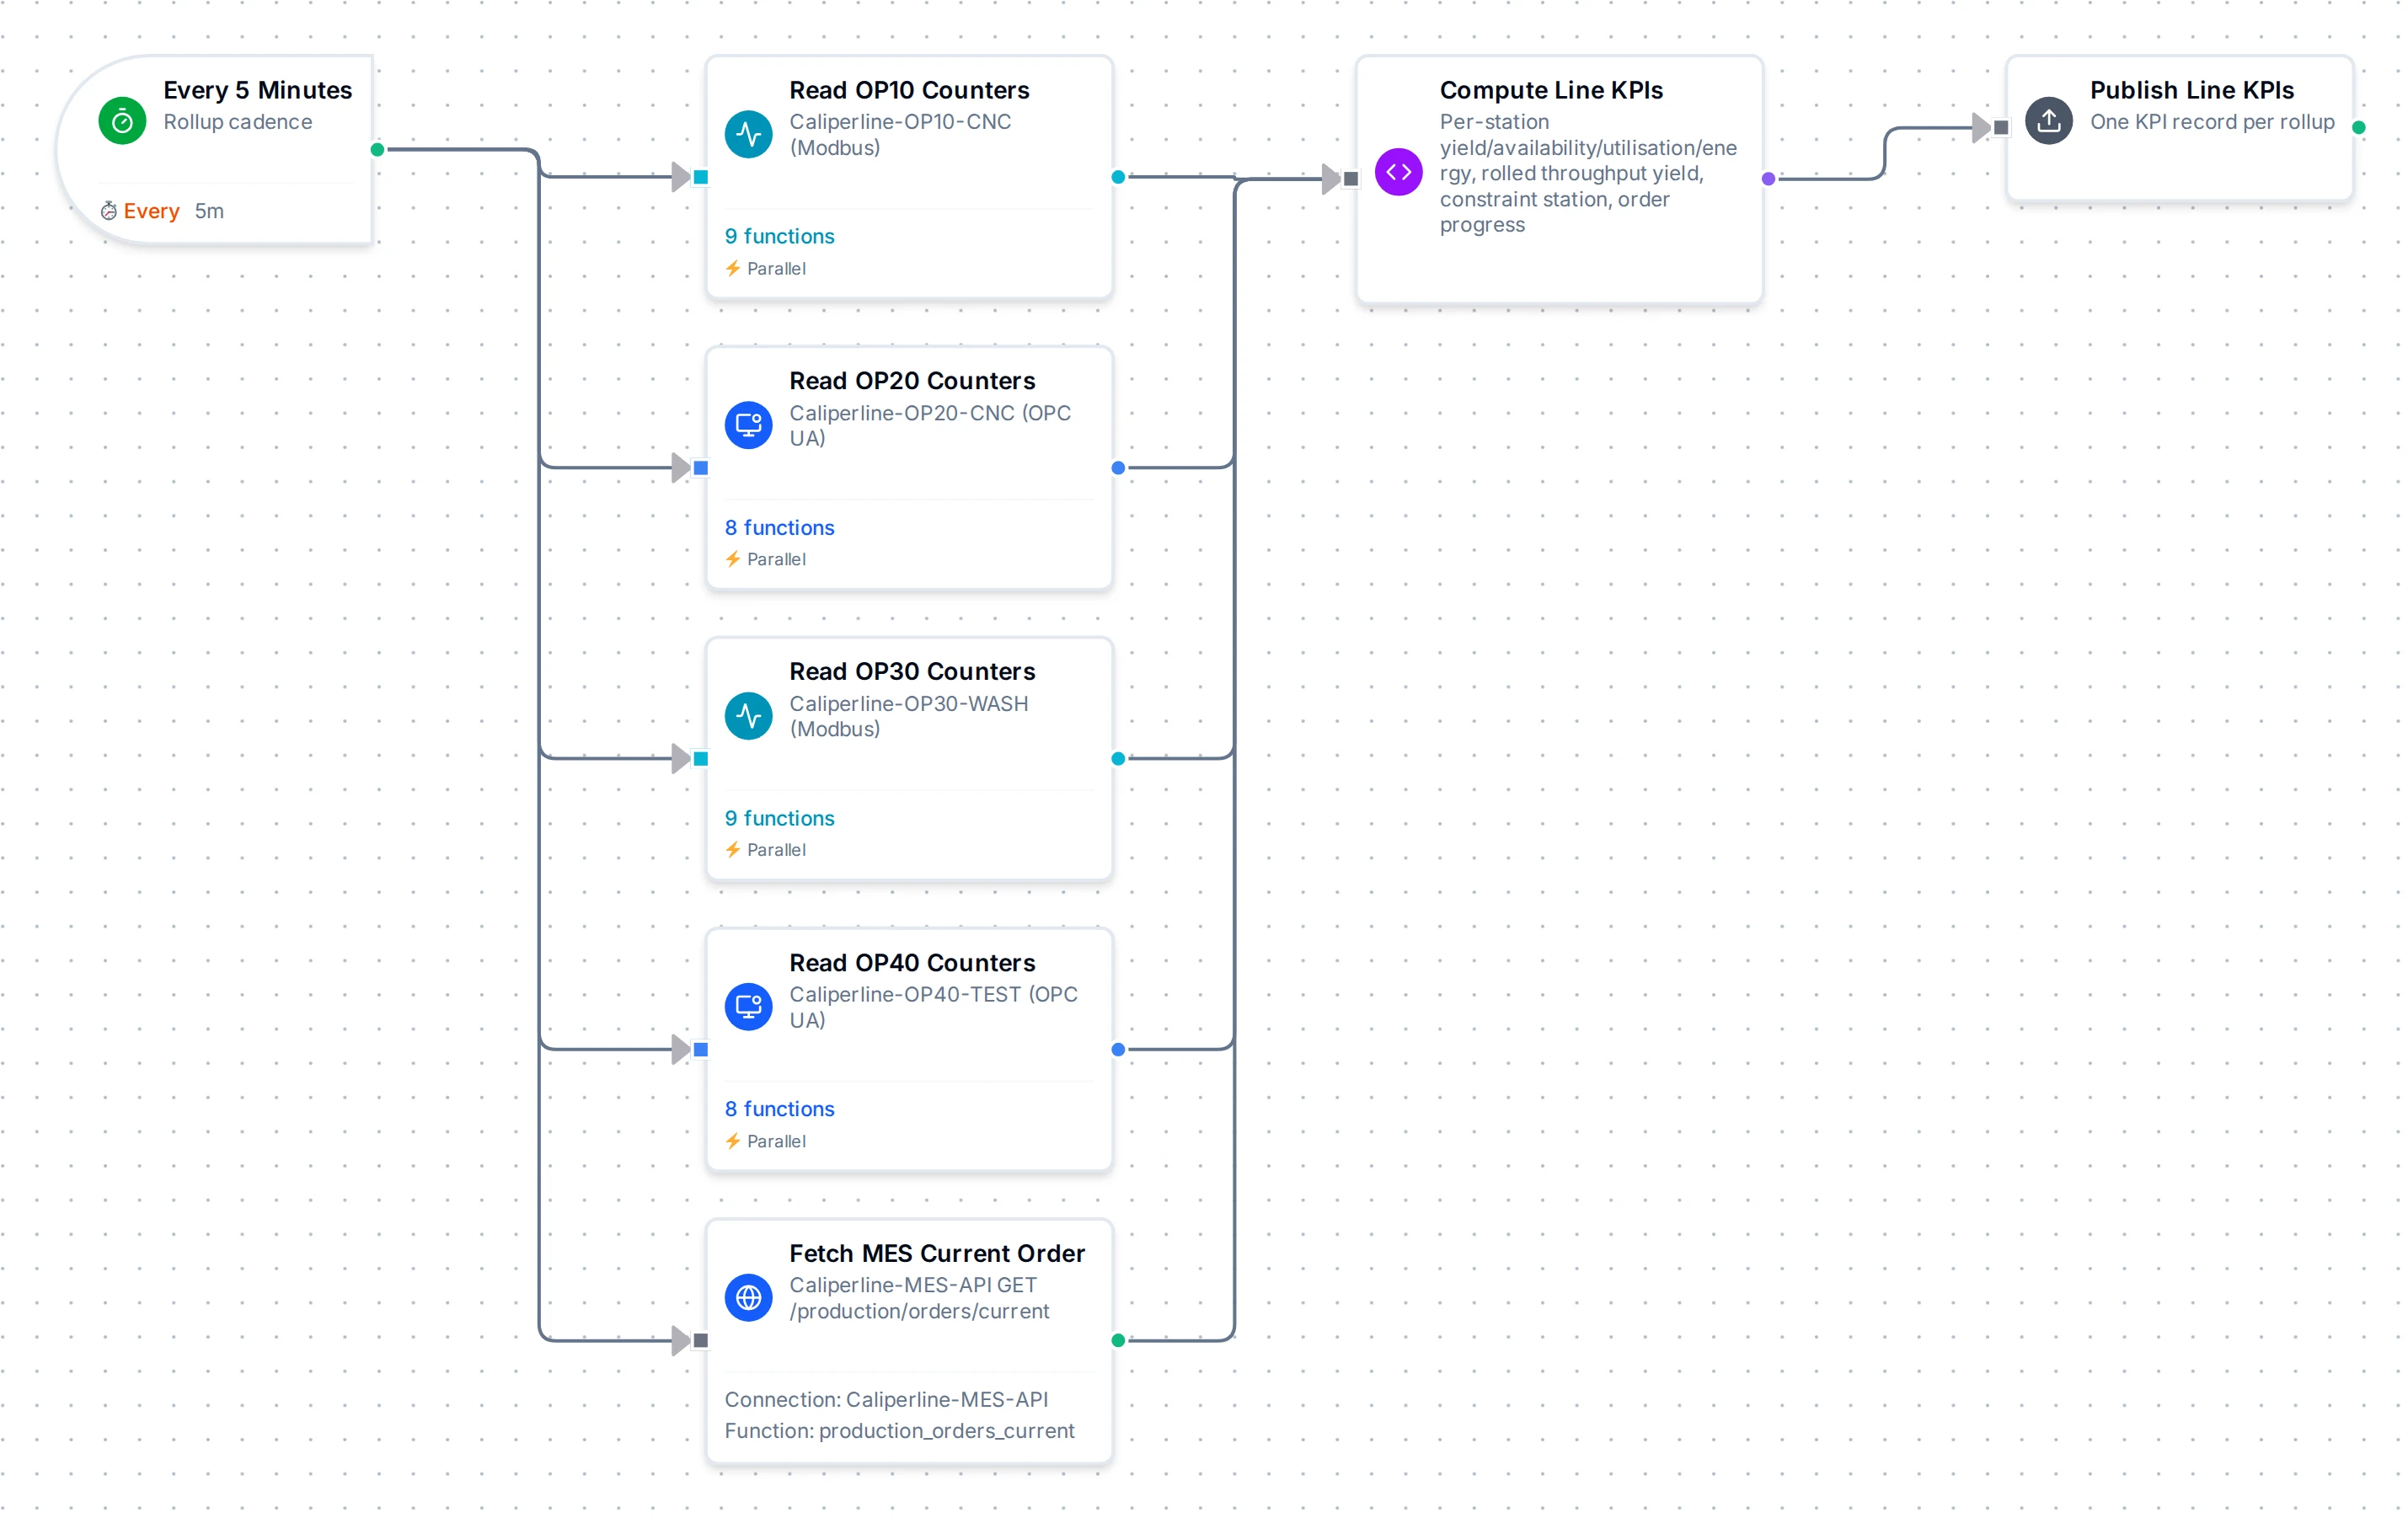
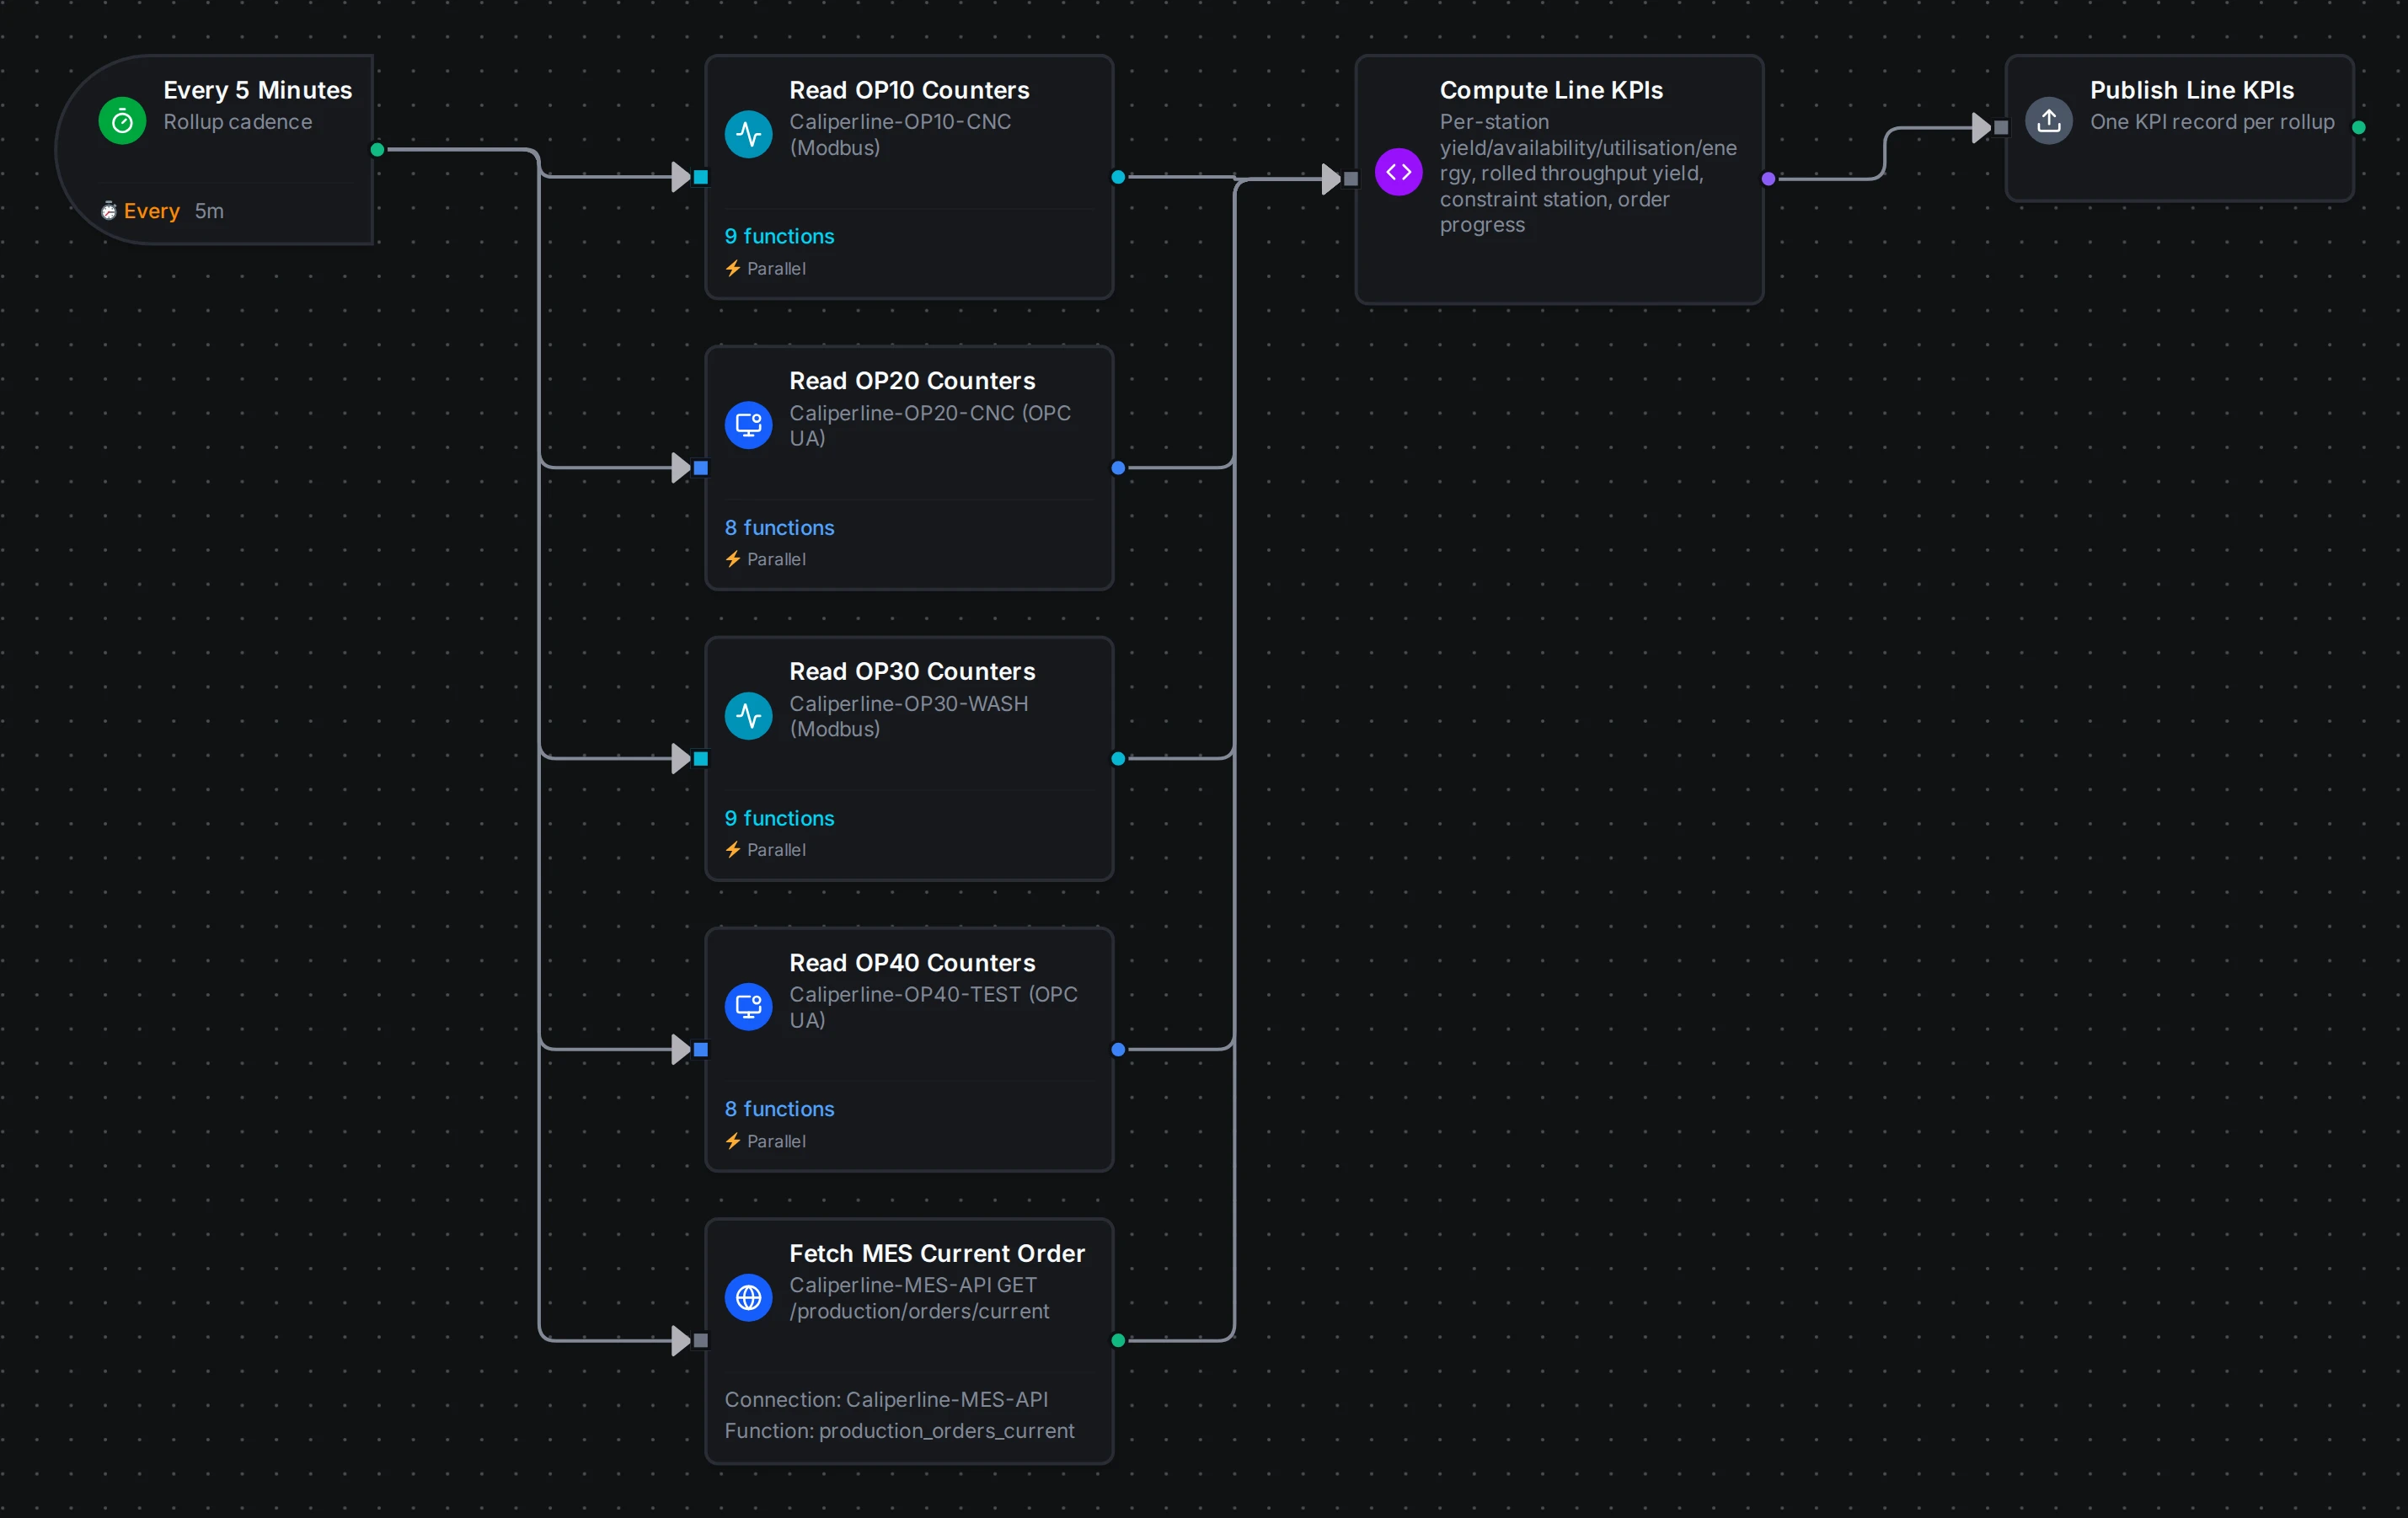
Every 5 minutes: read all four stations and the MES order, compute the line KPIs, publish one summary
| Node | Type | Purpose |
|---|---|---|
| Every 5 Minutes | trigger.schedule | Rolls up every 5 minutes |
| Read OP10 / OP30 Counters | connected.modbus.readgroup | Production, time, energy and state counters |
| Read OP20 / OP40 Counters | connected.opcua.readgroup | The same counters over OPC UA |
| Fetch MES Current Order | connected.rest.request | The work order in progress |
| Compute Line KPIs | logic.javascript | Per station: yield, availability, utilisation, kWh per good part. For the line: first-pass yield across all four stations, the bottleneck, the least available station, faulted stations, order progress |
| Publish Line KPIs | system.uns.publish | dfs/LINE-BC-01/kpi/line_summary |
The counters are running totals, so the KPIs cover the period since they were last reset, not a shift; the assistant said so in its report.
Part 2: Enabling Them
It ended Part 1 with a question: "Should I enable all three, or just some, and then check their first real runs?"
Prompt:
Yes, enable all three and check their first real runs.
It enabled the pipelines and watched their first runs with query_executions and query_topic_data, waiting for each scheduled run with a short timer (Claude Code's own sleep, the only thing it ran outside MaestroHub in this part). The real runs found two bugs in what it had built, and it fixed both:
- A gauge reading of −0.01 cc/min graded FAIL. That is noise around zero, and the station had called the part GOOD, but the pipeline had already published a wrong
QUARANTINE_STOCKrecord for it. The fix is in the code above: only a reading above the limit is a leak; a slightly negative one passes as noise, and one far below zero becomes INVALID_TEST with a "check gauge zero" note. It dry-ran the same event again (now PASS) before moving on. - A mistyped function ID in the KPI rollup's OP40 read group left OP40's availability empty. The pipeline saved and ran anyway: the read group records a function it cannot find as a failed read and carries on, so nothing failed. It corrected the ID and checked every other station's values against the live output. (Validation now warns about this:
validate_draftreports a read group function that does not exist, or that belongs to another connection.)
After the fixes all three ran clean: the first FAIL after the fix (a 0.557 cc/min leak) matched the station's SCRAP result and produced a BLOCK_AT_LINE record, and the 15:45 rollup put first-pass yield at 92.1%, with OP10 as the bottleneck.
It also flagged that the wrong quarantine record stays in the topic's history and offered to publish a retraction; on a demo plant that was not needed.
Part 3: Building the Dashboard
Prompt:
No retraction needed, this is a demo plant. Now, I want you to create a comprehensive dashboard using those pipelines you just created.
It listed the panel types, checked how the plant's own dashboards read fields inside object payloads, sampled every topic its pipelines publish, and created the dashboard Caliperline Quality & Process Intelligence with 16 panels.
To test the panels' code it then reached for the local machine: through Claude Code's own tools it started installing a charting library to render the panels outside MaestroHub. That is outside what an MCP session should do, so it was stopped and resumed with the built-in tools turned off:
Please don't run anything on this machine; stick to the MaestroHub MCP tools. Finish the dashboard you created and check every panel against the live data through MaestroHub.
With only MCP tools it checked each panel's logic by hand against the live data (every KPI record, 63 leak verdicts and 41 wash-health records in the hour), made every panel accept fields that arrive flattened or as text, and listed what each panel should show, asking for the dashboard to be opened to confirm it renders. Opened in a browser, all 16 panels drew with the values it predicted.
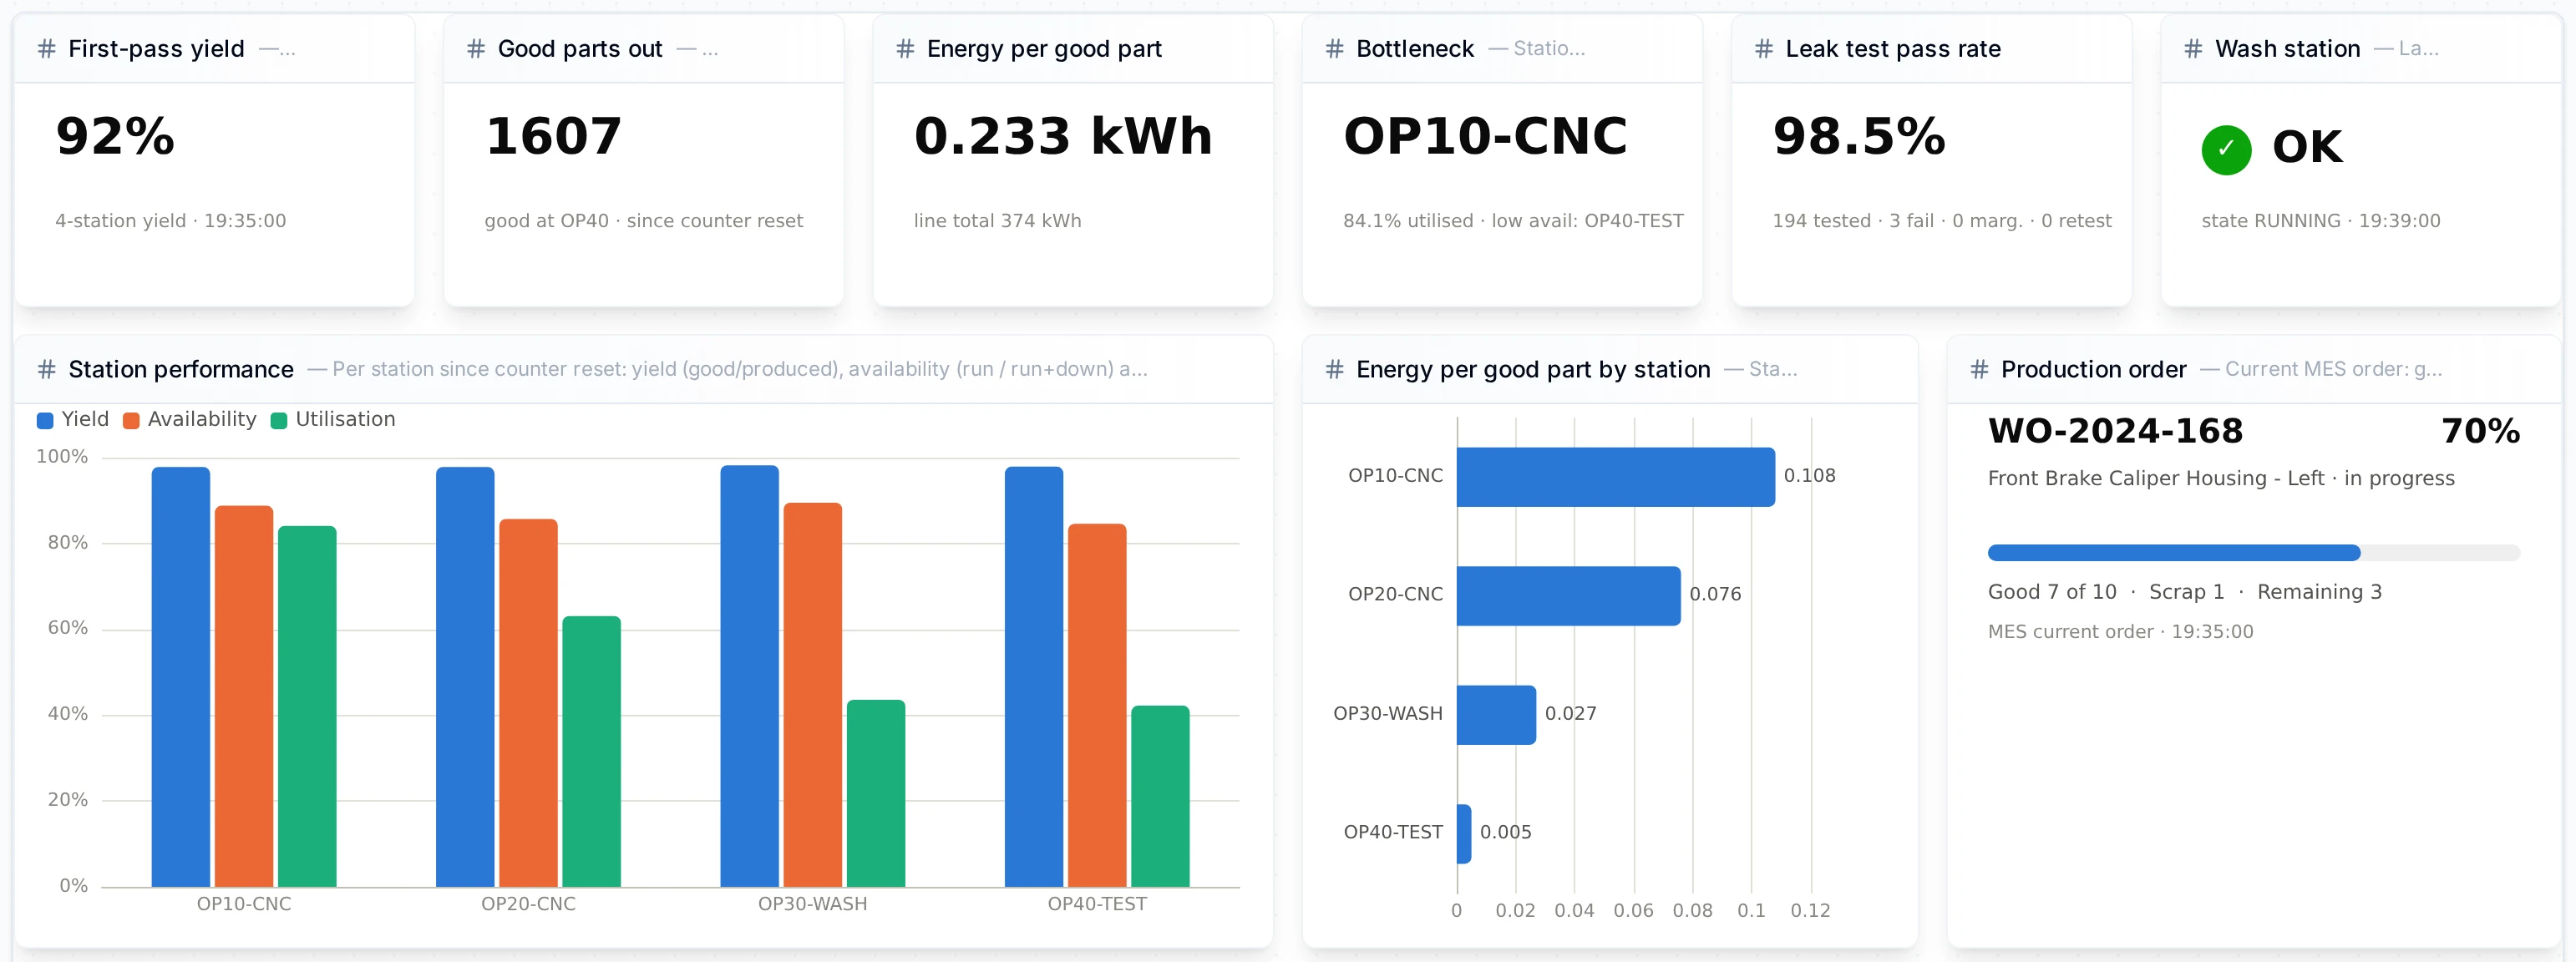
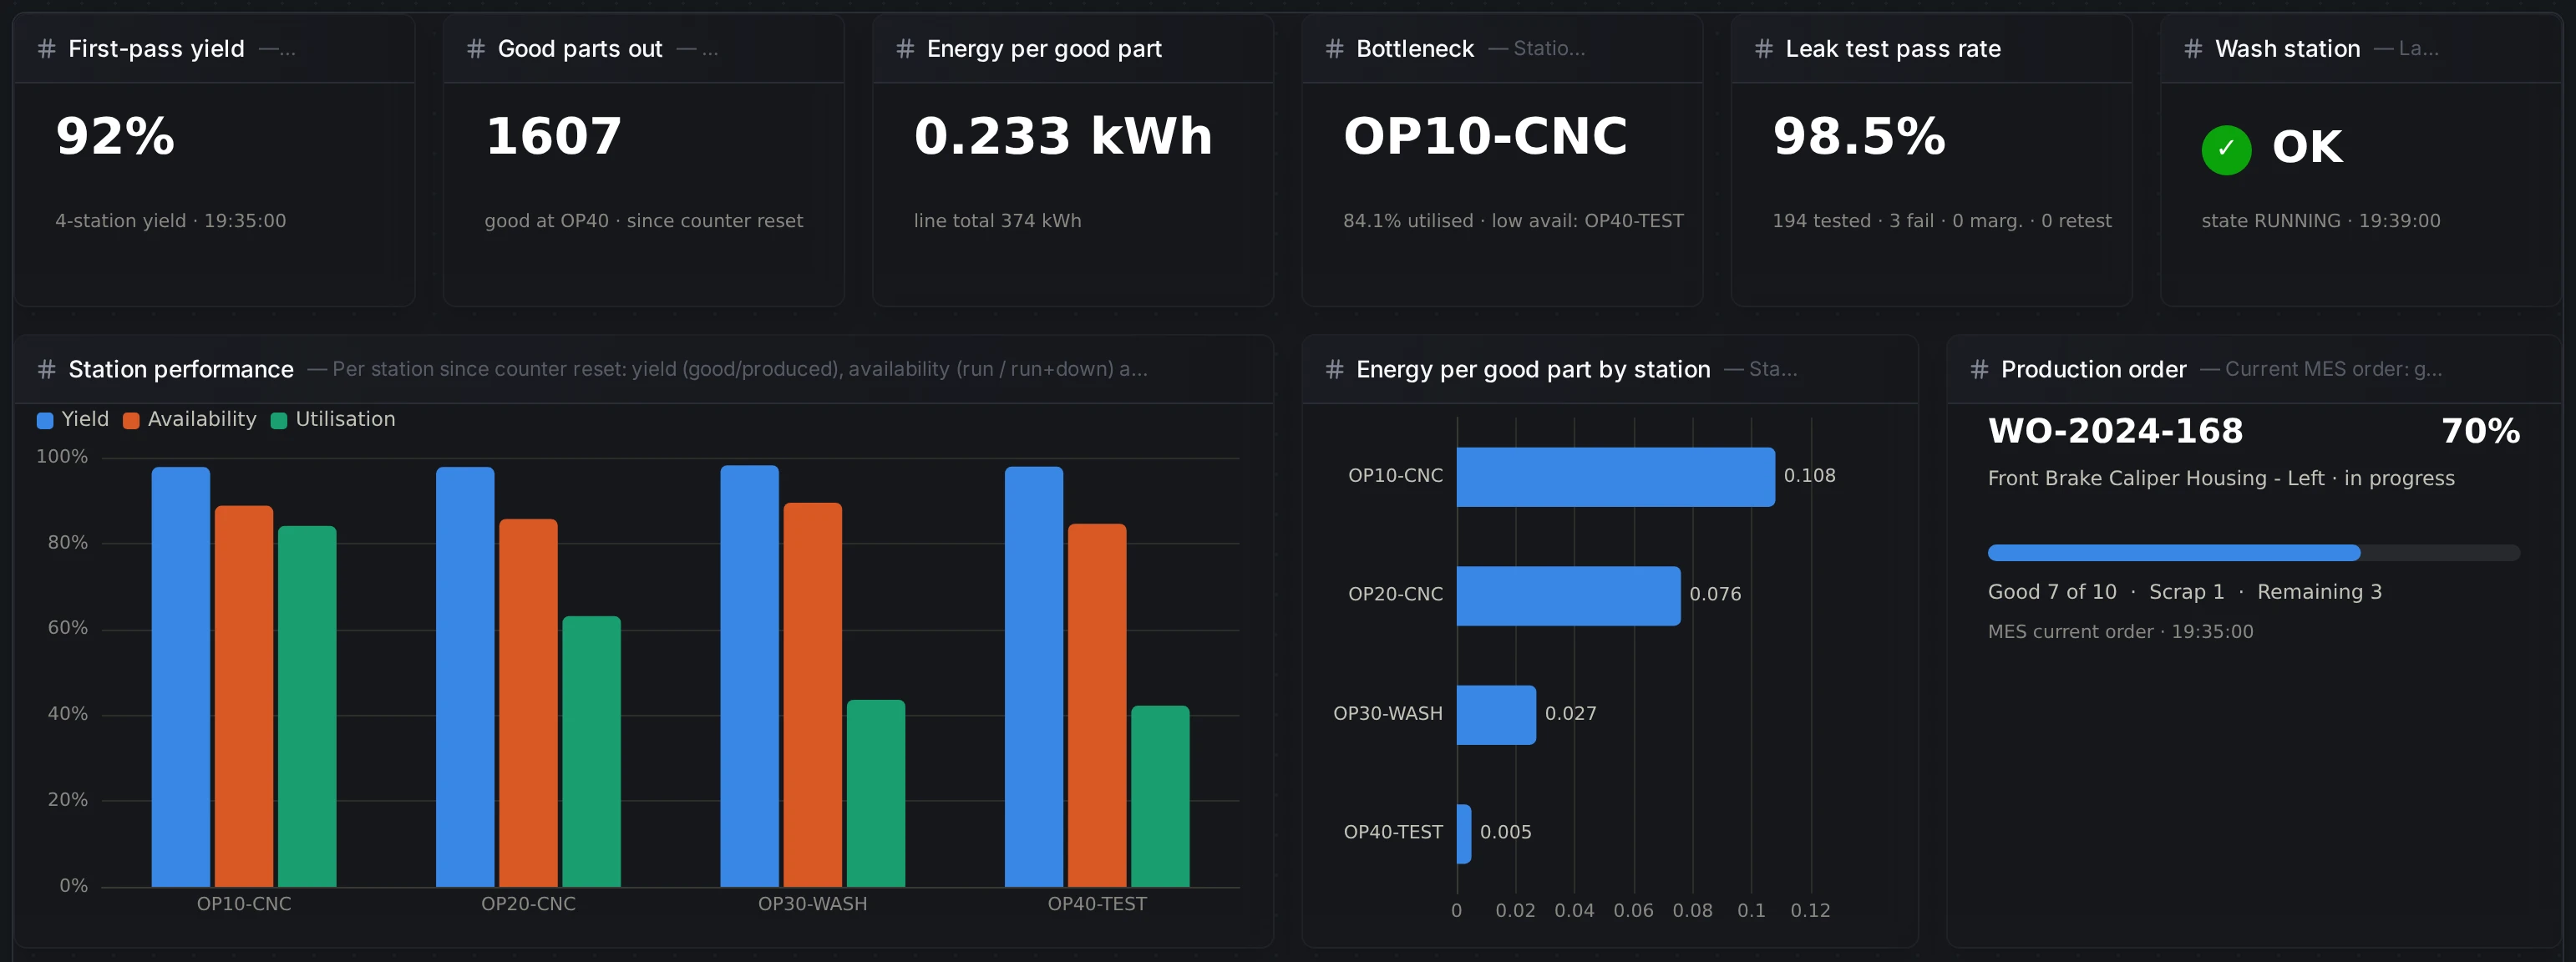
Top: first-pass yield, good parts, energy per good part, the bottleneck, leak pass rate and wash status; station performance and energy; the current MES order
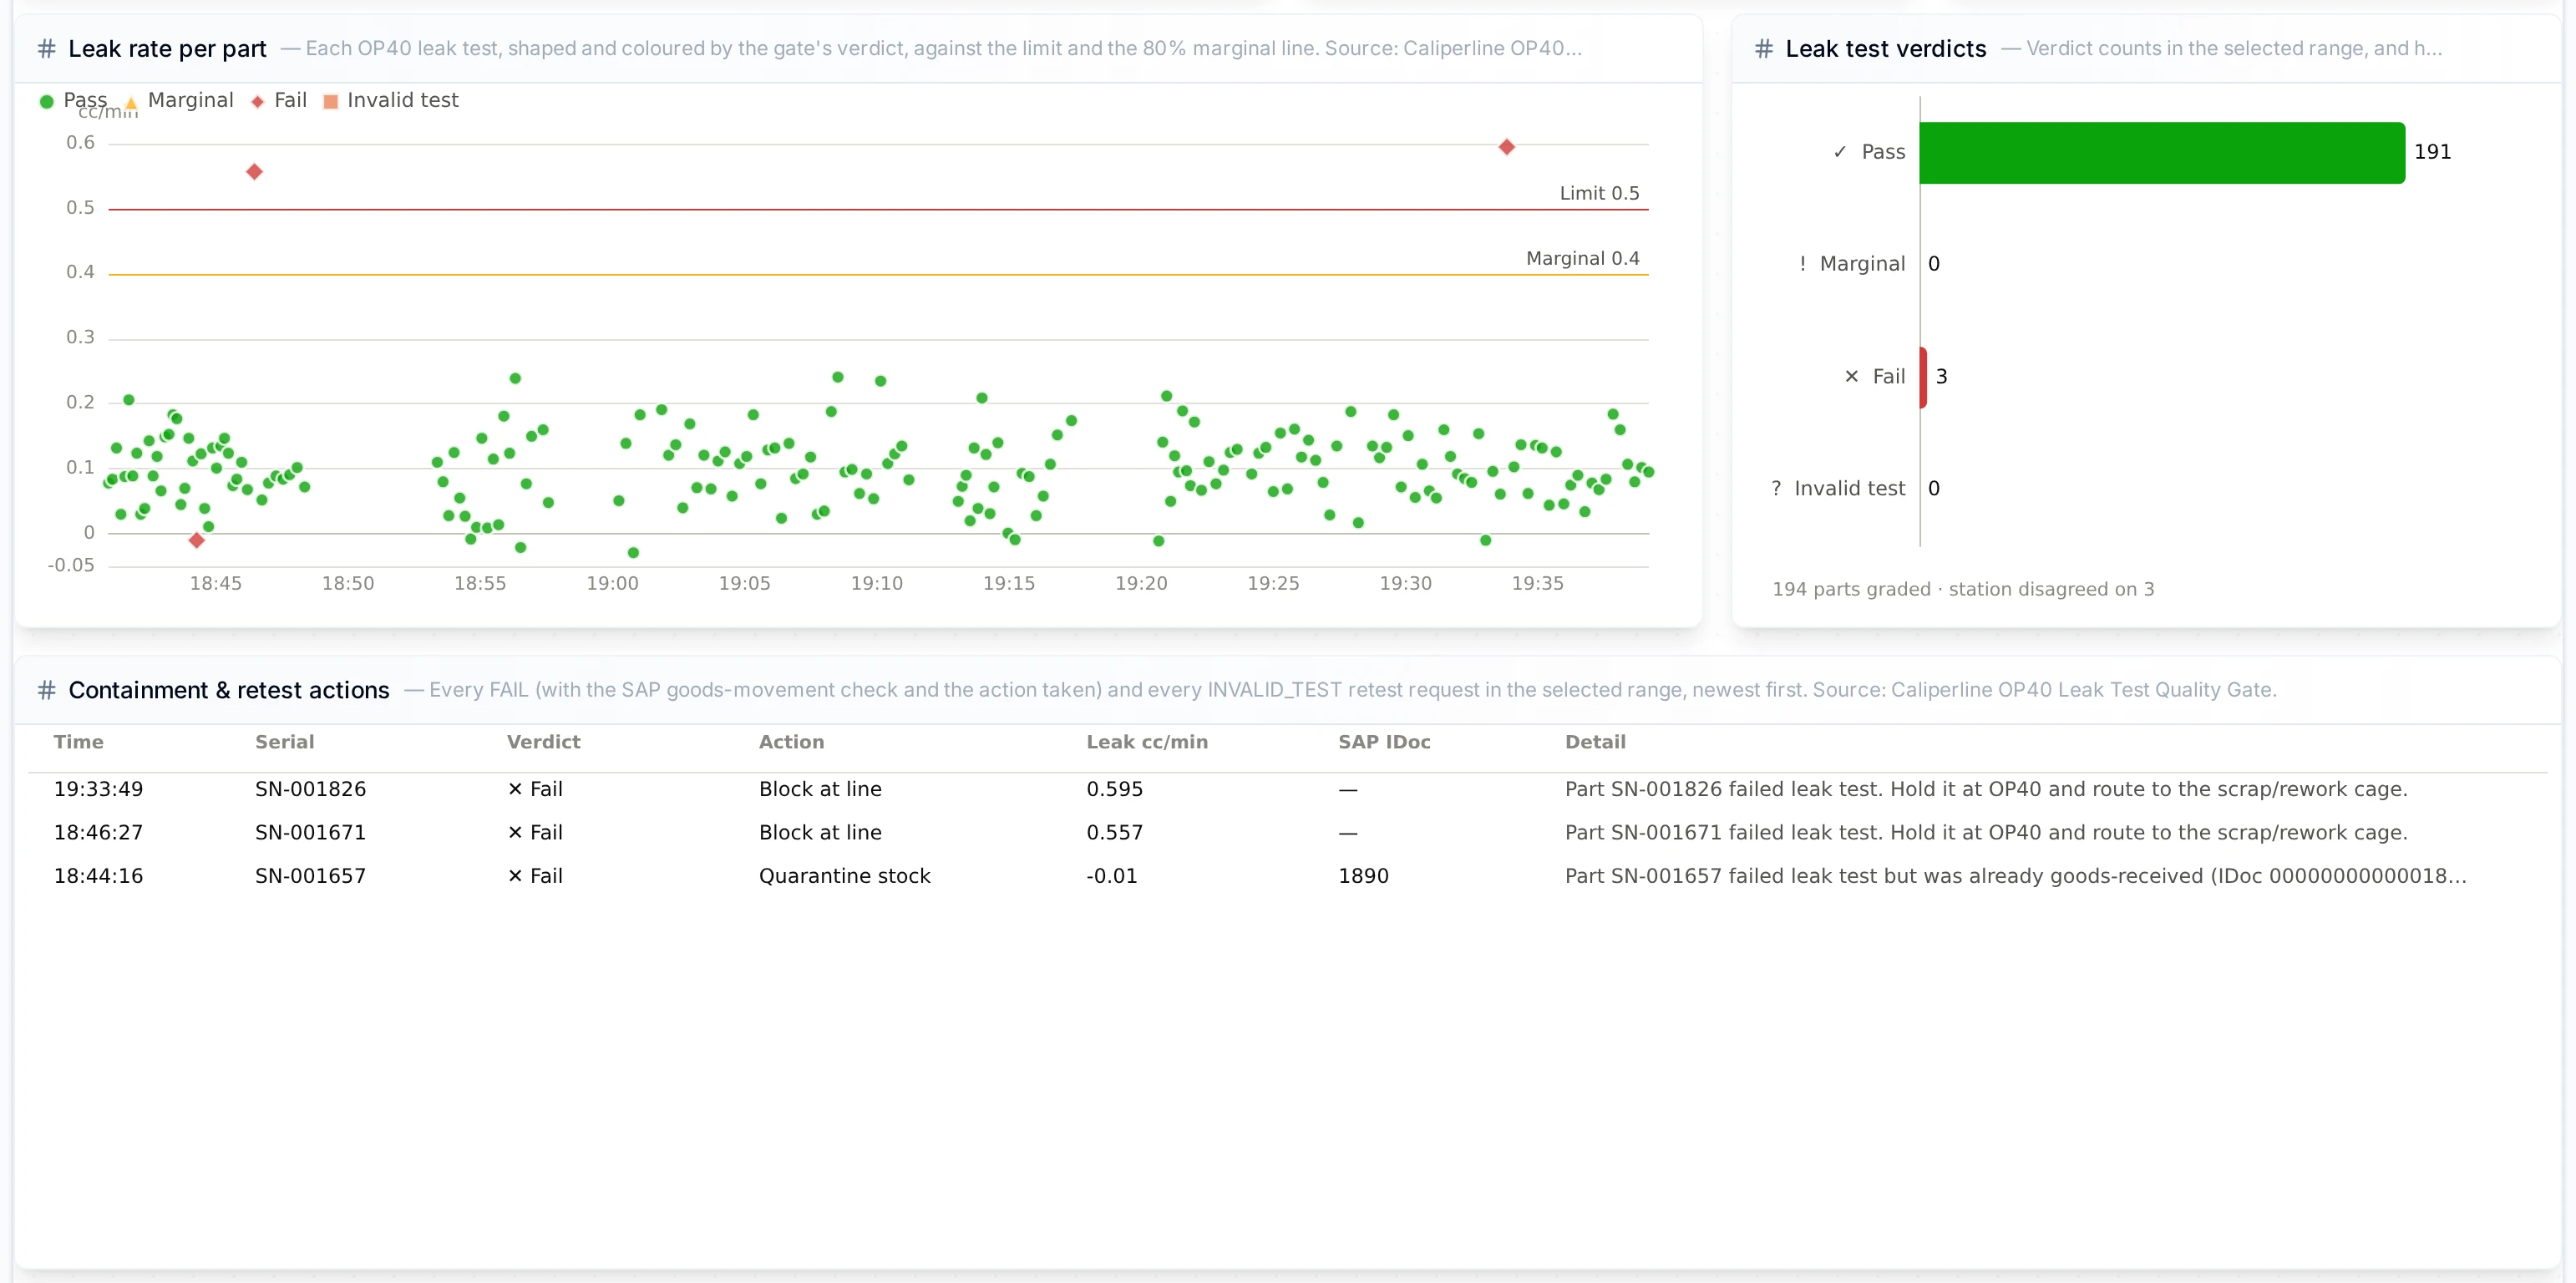
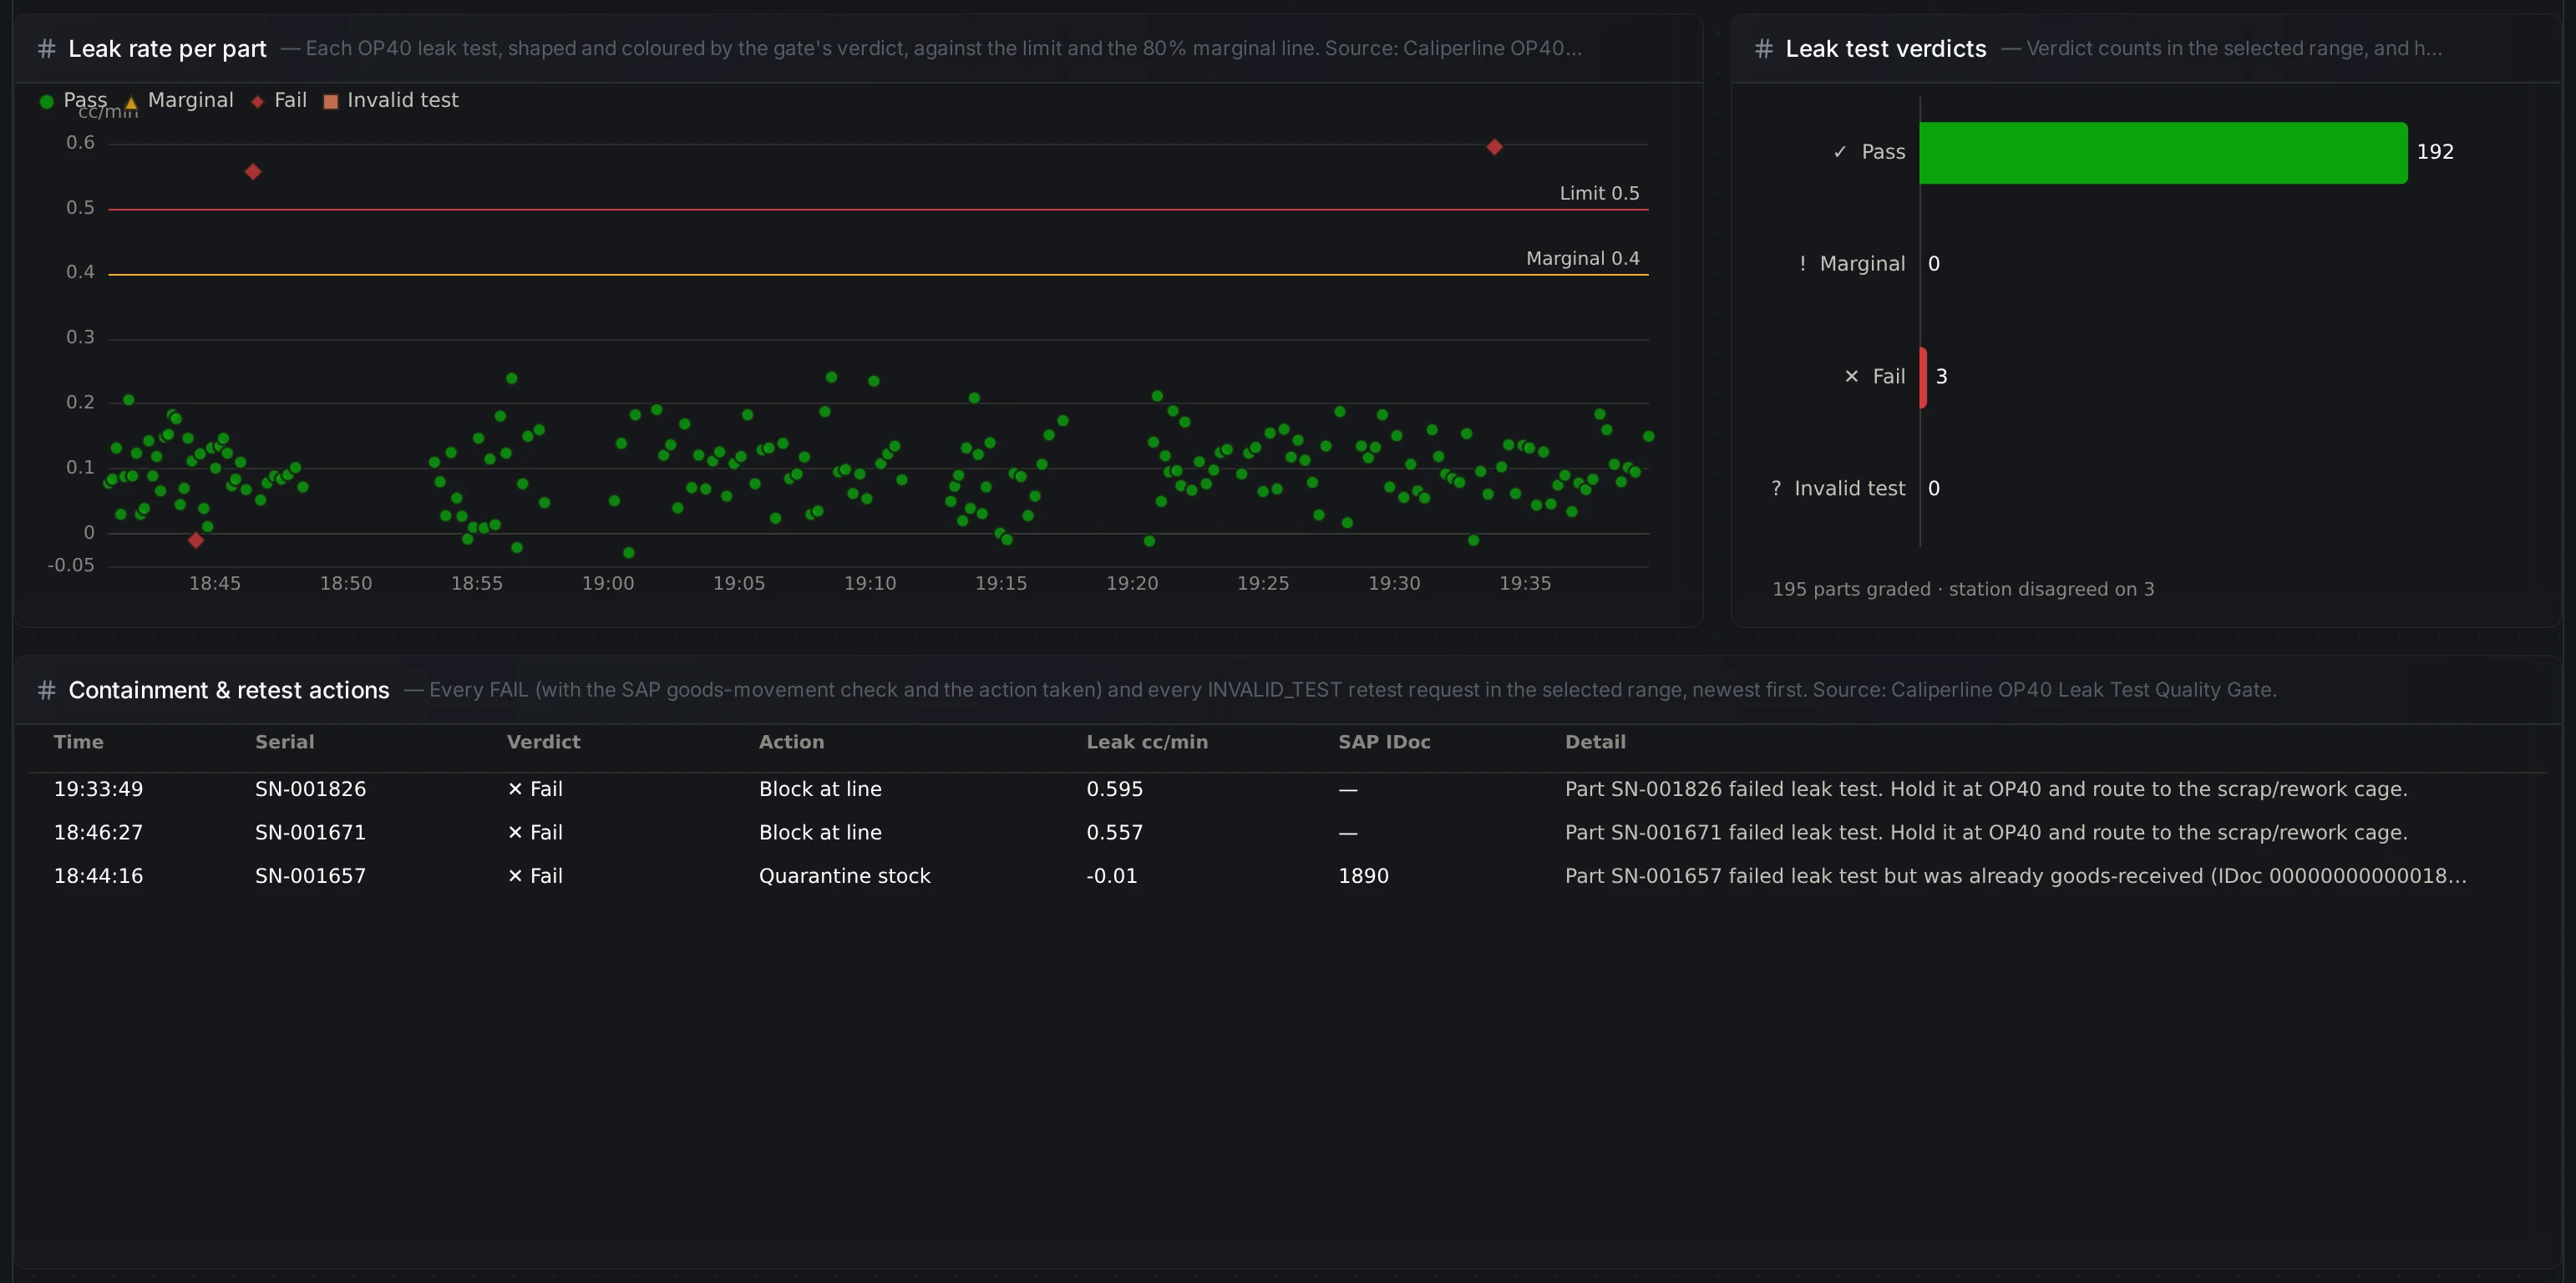
Middle: every leak test against the limit and the marginal line, verdict counts, and the containment and retest actions
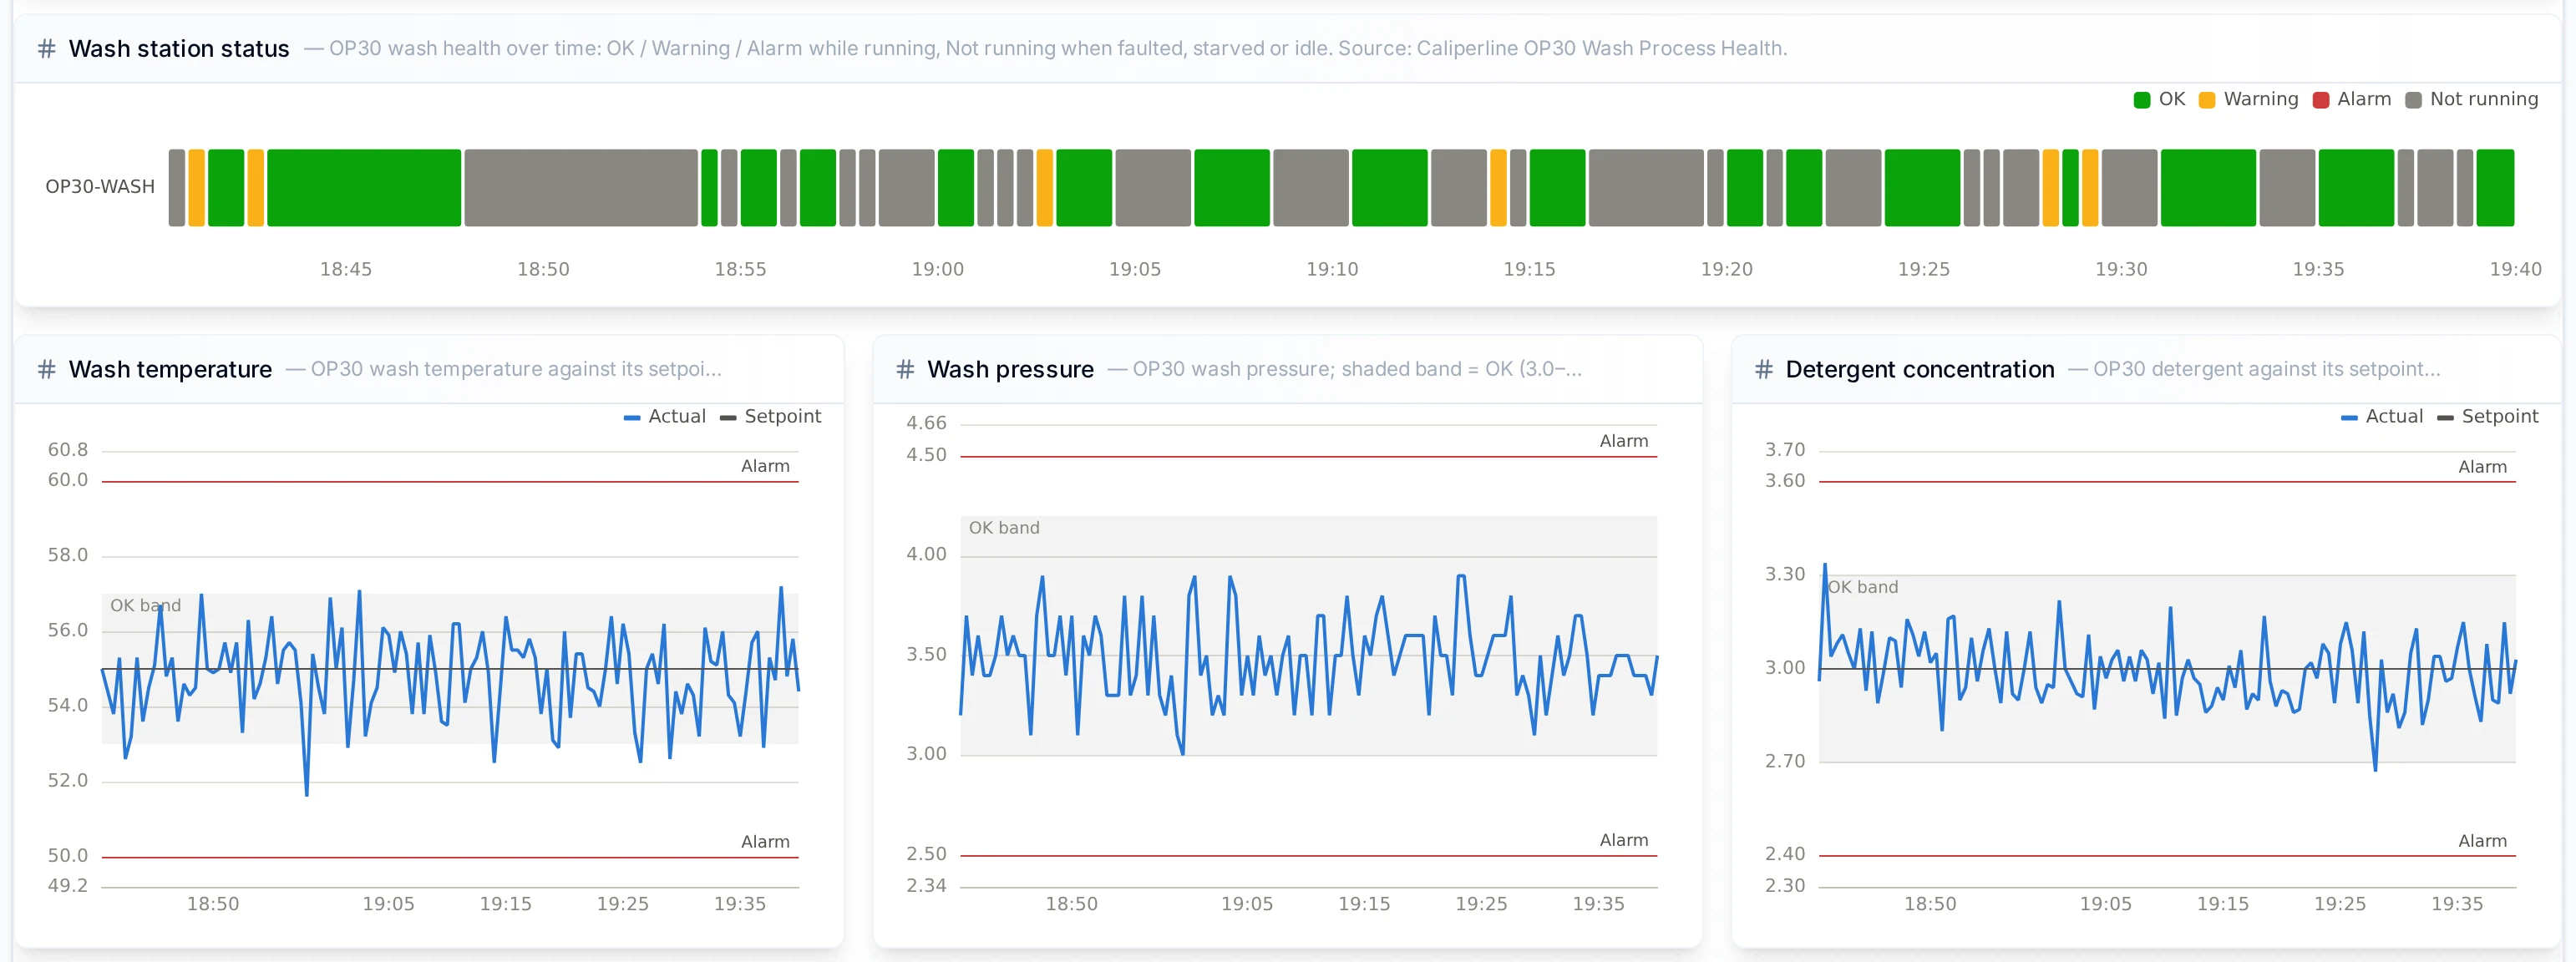
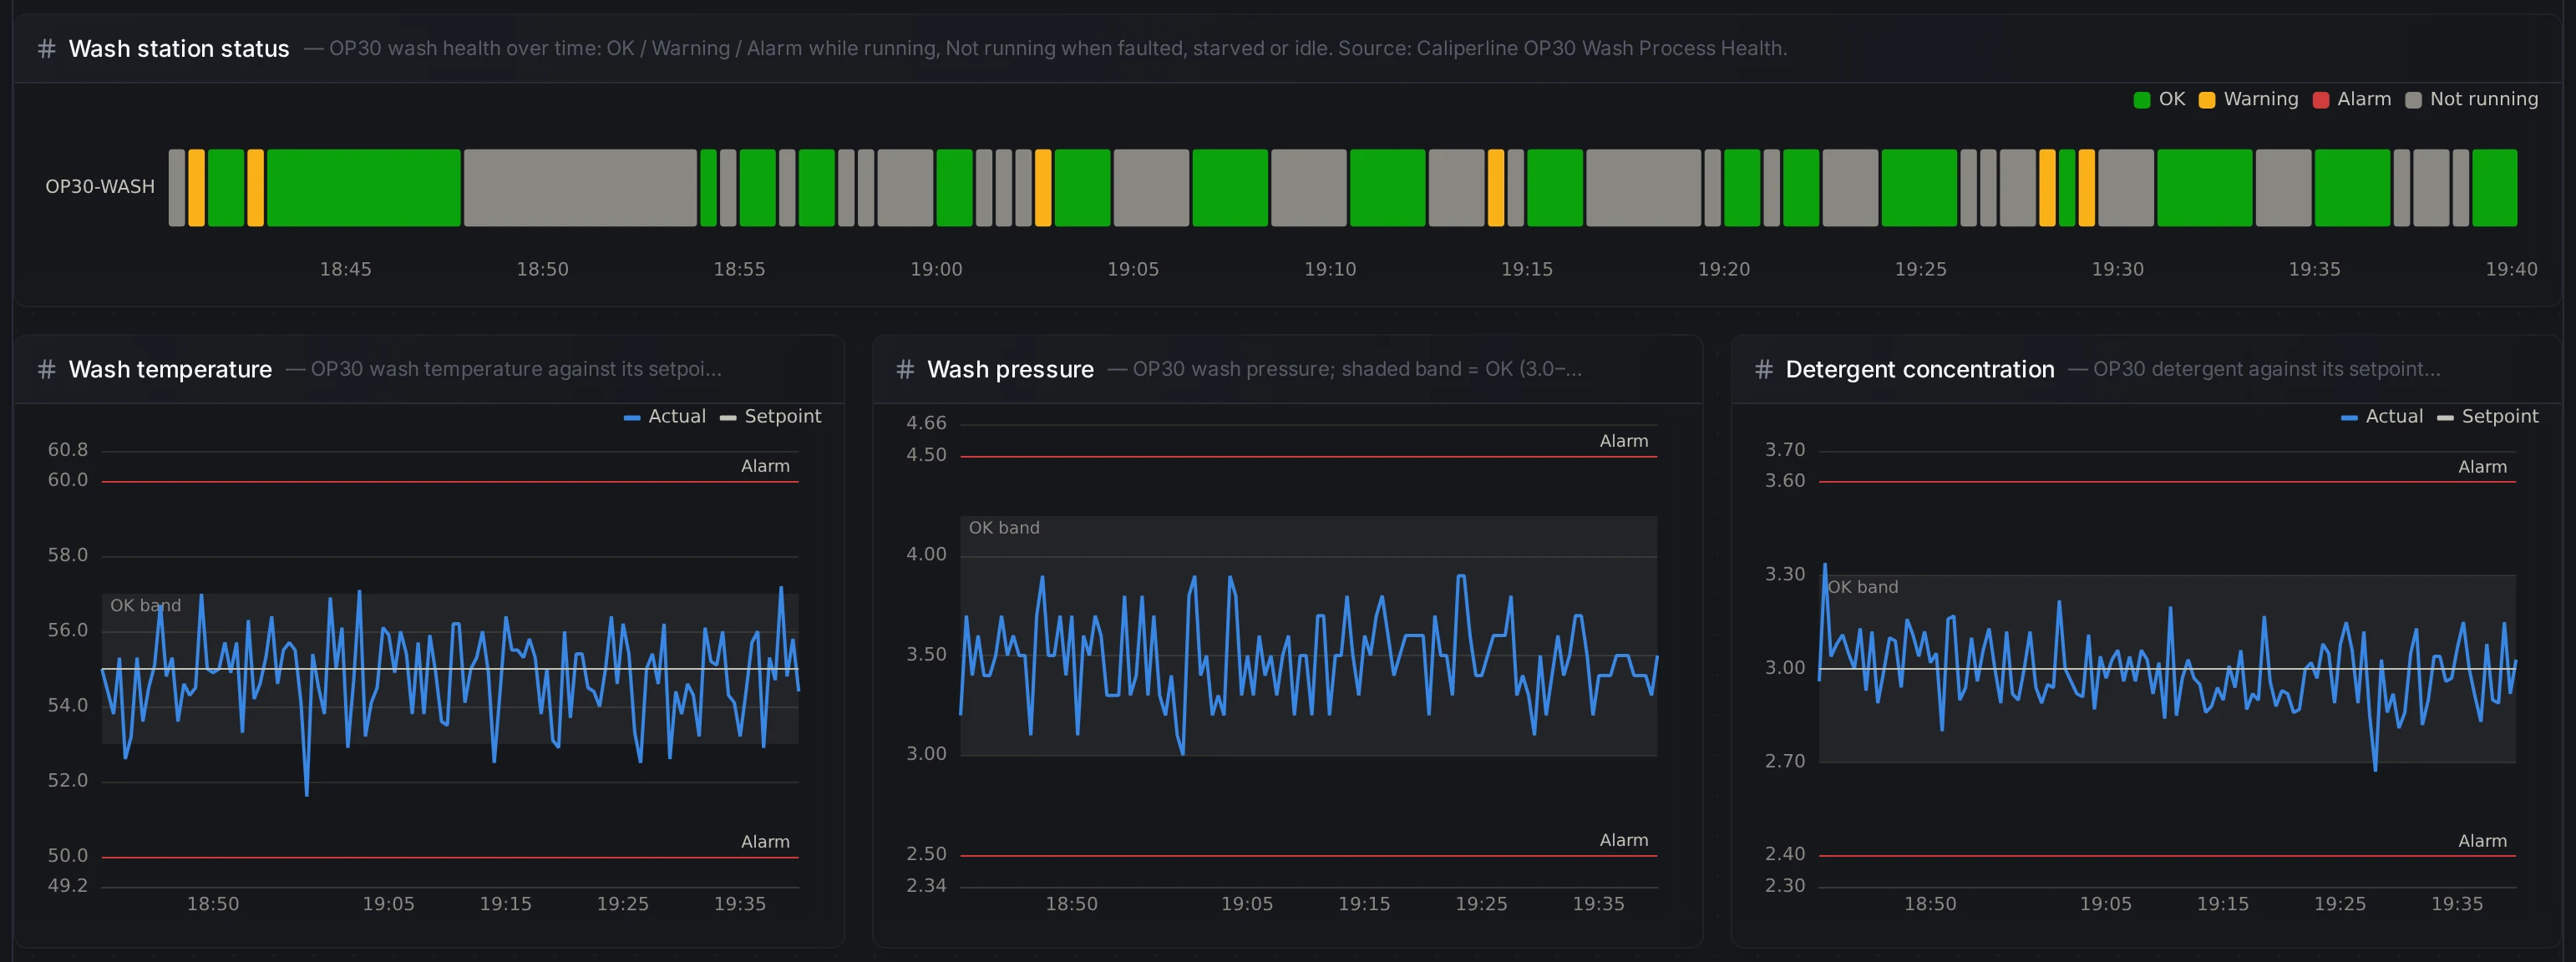
Bottom: the wash station's status over time, and its temperature, pressure and detergent against their bands
| Panels | What they show |
|---|---|
| Six tiles | First-pass yield, good parts out, energy per good part, the bottleneck station, leak test pass rate, wash station status |
| Station performance, Energy by station | Yield, availability and utilisation per station; kWh per good part per station |
| Production order | The current MES order and its progress |
| Leak rate per part, Leak test verdicts | Each test against the 0.5 cc/min limit and the 0.4 marginal line; counts by verdict and how often the station disagreed |
| Containment & retest | Every FAIL with its SAP check and action, and every retest request |
| Wash station status, Wash temperature / pressure / detergent | The washer's status over time, and each value against its band and setpoint |
Observations
- It checked before it acted. Pipelines were validated and dry-run, on invented failures as well as real data, then saved disabled until it was asked to enable them.
- It found its own bugs in real runs, not in dry runs: the noise reading and the mistyped ID only showed once real parts came through. Watching the first runs is part of the job, and it did it without being asked twice.
- It named its own assumptions: the OP30 pressure band, counters that cover the time since reset, the wrong record left in history.
- Validation did not catch the mistyped function ID at the time. A read group naming a function that does not exist saved cleanly and, at run time, recorded a failed read without failing the node.
validate_draftnow warns about it, and about a function of another connection; it is still worth reading a new read group's output once after saving. - It cannot see a dashboard render. It checked the panels' logic against the data, and asked for the dashboard to be opened; that check matters.
- Scope the session. The token scopes above and
--tools ""keep it inside MaestroHub.
Prompts Summary
- "Can you design and implement some pipelines using the Caliperline connections?"
- "Yes, enable all three and check their first real runs."
- "No retraction needed, this is a demo plant. Now, I want you to create a comprehensive dashboard using those pipelines you just created."
- "Please don't run anything on this machine; stick to the MaestroHub MCP tools. Finish the dashboard you created and check every panel against the live data through MaestroHub."