DFS OEE Monitoring Dashboard
The DFS OEE Monitoring dashboard provides real-time OEE (Overall Equipment Effectiveness) monitoring for the Brake Caliper Line BC-01. It is included in the .mhub.json export and is automatically available after import.
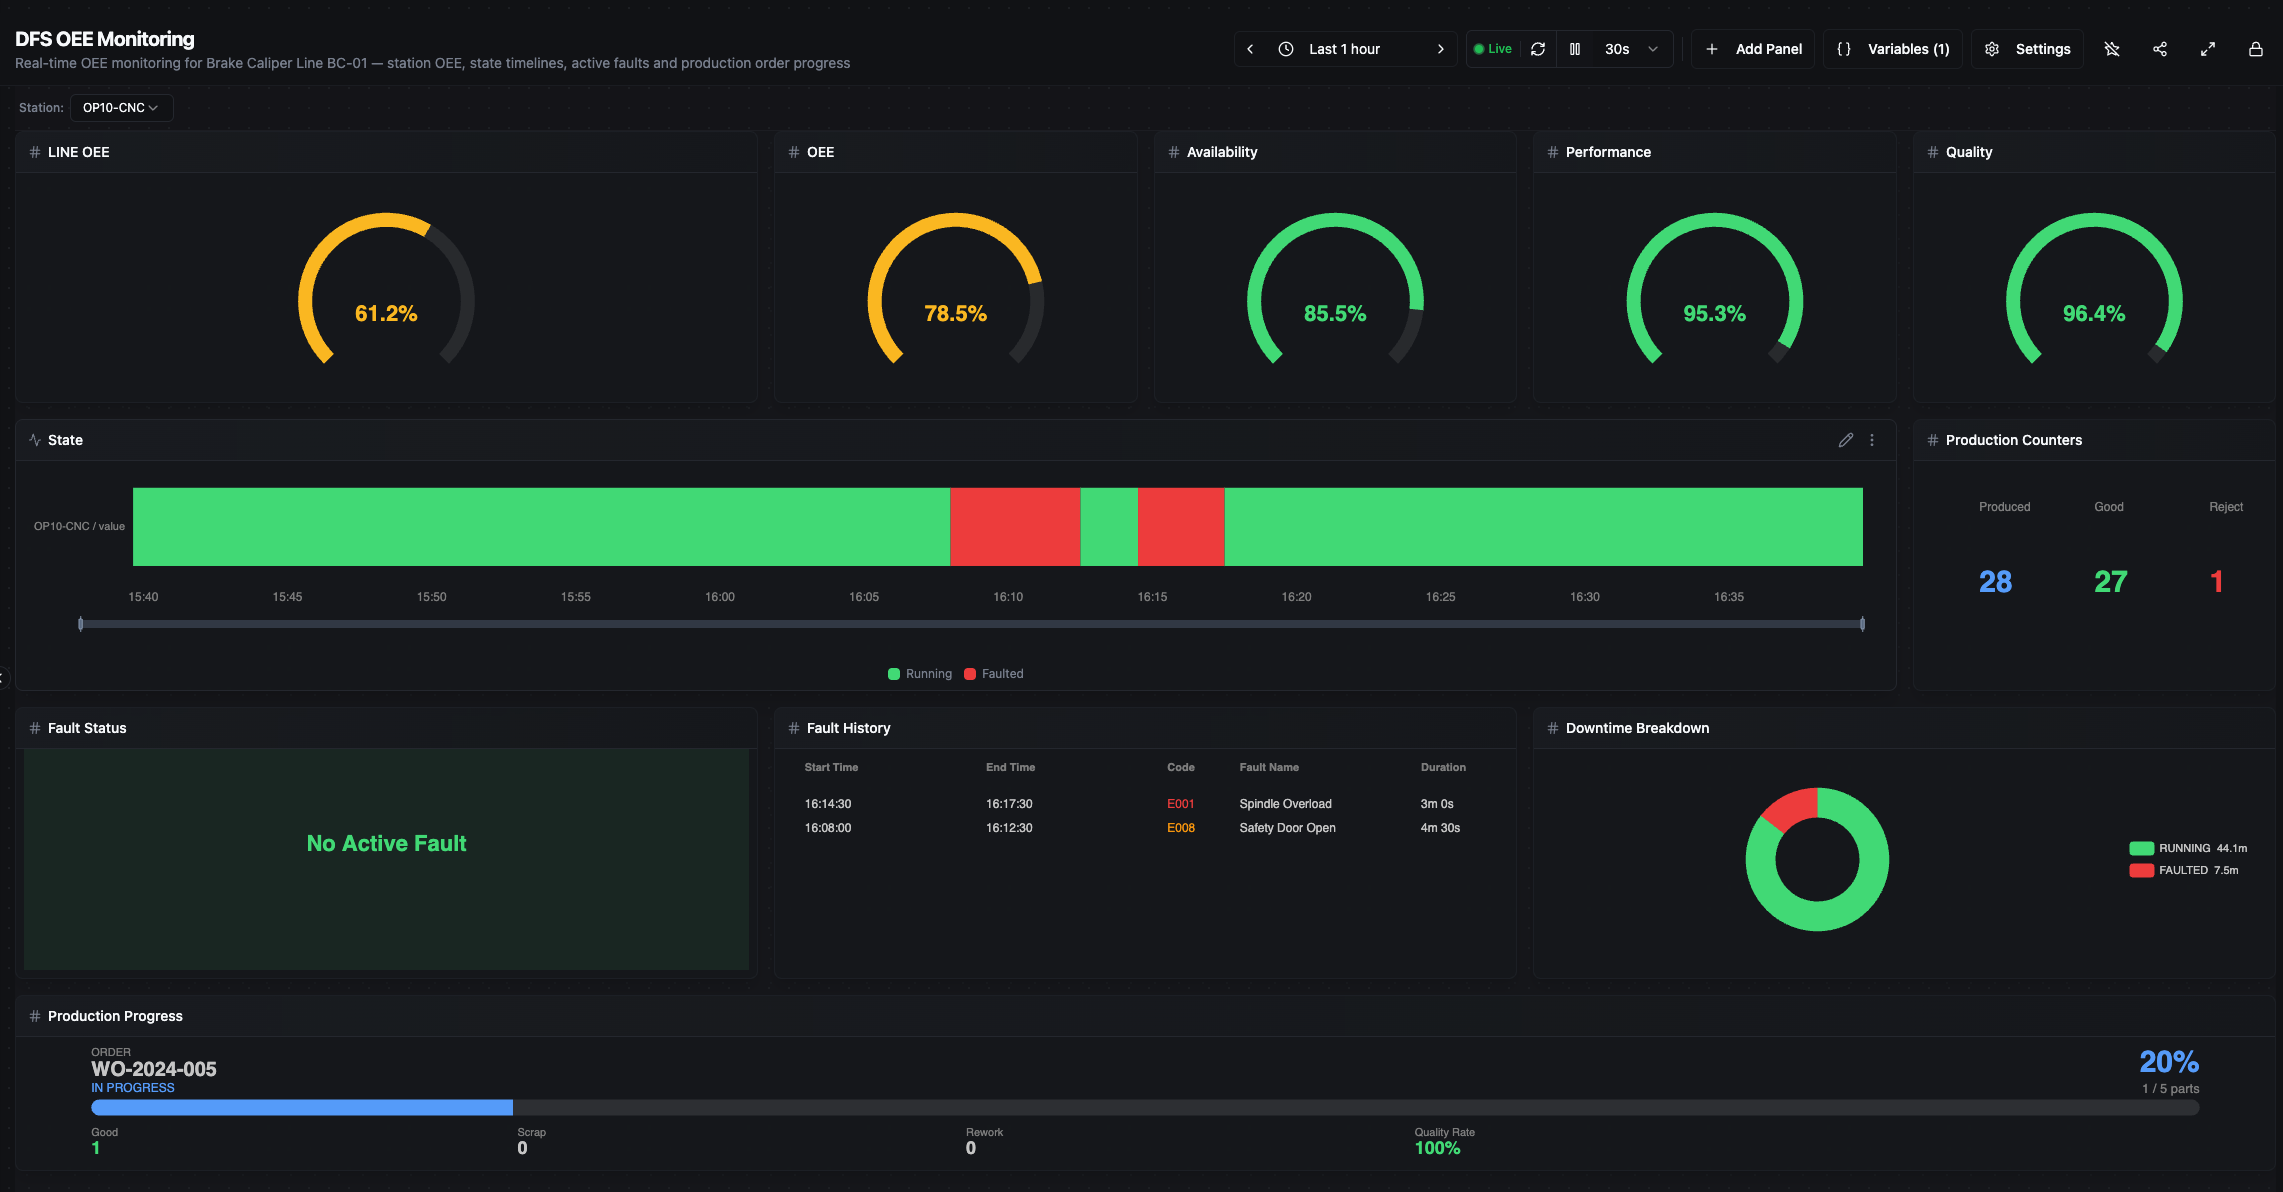
DFS OEE Monitoring — full dashboard view
Station Selector
The dashboard uses a ${station} variable at the top-left corner. Selecting a station (OP10-CNC, OP20-CNC, OP30-WASH, or OP40-TEST) updates all station-specific panels simultaneously. The LINE OEE and Production Progress panels always show line-level data regardless of the selected station.
Time Range
All panels respect the time range selector in the top toolbar. When you select "Last 5 minutes", every panel calculates from data within that exact window.
The planned time for OEE calculations is derived from the actual data available in the selected window, not from the window size itself. If you select "Last 15 minutes" but DFS has only been running for 5 minutes, the planned time is 5 minutes — the 10 minutes with no data are not counted as downtime.
Panels
LINE OEE
Measures the effectiveness of the entire production line using the industry-standard A × P × Q formula. The calculation happens inside the dashboard panel — no separate OEE pipeline is needed.
- Availability is calculated from OP10-CNC (the bottleneck, longest ideal cycle = 90s) state transitions. In a serial line, the line can only produce at the bottleneck's pace — when OP10 stops, the line stops.
- Performance compares OP40 output (last station = line throughput) against OP10's theoretical capacity:
ideal_cycle_sec(OP10) × parts_produced(OP40) / run_time(OP10). - Quality is the ratio of good parts to total parts at OP40 — only parts that pass all four stations count.
Data sources: equipment/OP10-CNC/status/state, master/equipment/OP10-CNC/ideal_cycle_sec, equipment/OP40-TEST/counters/parts_produced, equipment/OP40-TEST/counters/parts_good.
Station OEE
Same A × P × Q formula but for the selected station only. All three components use data from the same station rather than the bottleneck/last-station split used in LINE OEE.
Data sources: equipment/${station}/status/state, equipment/${station}/counters/parts_produced, equipment/${station}/counters/parts_good, master/equipment/${station}/ideal_cycle_sec.
Availability
Percentage of time the selected station was RUNNING within the selected time range. Calculated from status/state topic by walking through state transitions and summing durations. The last state extends to Date.now() so the total matches the Downtime Breakdown panel exactly.
If the station was RUNNING the entire window, Availability is 100%. If it was FAULTED for half the window, Availability is 50%.
Data source: equipment/${station}/status/state.
Performance
Whether the station is producing at its theoretical maximum speed. Uses the same state-transition-based run time as Availability (not counter deltas) to ensure consistency:
Performance = (ideal_cycle_sec × parts_produced_delta) / run_time_from_state_transitions
ideal_cycle_sec comes from the Reference Data Collector pipeline (master/equipment/${station}/ideal_cycle_sec). On cold start, Performance shows 0% until this value is published (up to 5 minutes).
Data sources: equipment/${station}/status/state, equipment/${station}/counters/parts_produced, master/equipment/${station}/ideal_cycle_sec.
Quality
Ratio of good parts to total parts produced within the selected time range. Both values are counter deltas — the change between the first and last data point in the window.
Quality = parts_good_delta / parts_produced_delta
Data sources: equipment/${station}/counters/parts_produced, equipment/${station}/counters/parts_good.
State Timeline
A horizontal bar showing machine state transitions over time for the selected station. Each state is color-coded (Running = green, Faulted = red, Idle = amber, Starved = orange, Blocked = dark amber, Changeover = indigo, Maintenance = purple, Off = gray).
Data source: equipment/${station}/status/state.
Production Counters
Three numbers showing Produced, Good, and Reject counts within the selected time range. These are delta values (change within the window), not cumulative totals. Calculated from counter topic deltas.
Data sources: equipment/${station}/counters/parts_produced, parts_good, parts_bad.
Fault Status
Shows the current fault state of the selected station — green background when clear, red background with fault code and name when active. This is real-time status, not historical.
Data sources: equipment/${station}/faults/fault_active, fault_code.
Fault History
A table listing all fault events for the selected station within the selected time range. Shows start time, end time (or "Active now"), fault code, fault name, and duration. Fault periods are detected by tracking fault_active transitions in the data.
Data sources: equipment/${station}/faults/fault_active, fault_code.
Downtime Breakdown
A donut chart showing how much time the selected station spent in each state. Uses the same state-transition calculation as Availability — the last state extends to Date.now(), so the total matches the selected window exactly.
Data source: equipment/${station}/status/state.
Production Progress
Shows the active work order: order ID, status, progress bar (produced vs. target), good/scrap/rework counts, and quality rate. This panel is line-level (not station-specific) and shows the latest values, not deltas.
Data sources: production/orders/order_id, target_qty, produced_qty, good_qty, scrap_qty, rework_qty, status.
How Time Calculations Work
All time-based panels (Availability, Downtime Breakdown, LINE OEE) use the same method: state transition analysis with Date.now() extension.
The panel reads status/state records from UNS, sorts them chronologically, and for each record calculates:
- Duration = next record's timestamp − this record's timestamp
- For the last record: duration =
Date.now()− this record's timestamp
This means:
- The total time always covers from the first data point to the current moment
- Downtime Breakdown and Availability always agree on total time
- If you select "Last 5 minutes" and the station was RUNNING the entire time, Availability is exactly 100% and Downtime Breakdown shows RUNNING = 5.0m
An earlier version used run_time_sec / down_time_sec / idle_time_sec counter deltas instead. This caused a ~5-second discrepancy per polling interval because counter samples don't align exactly with window boundaries.
Edge Cases
Cold start: When DFS starts fresh, OEE gauges show 0% until enough data accumulates (~30 seconds). Performance stays at 0% until the Reference Data Collector publishes ideal_cycle_sec (up to 5 minutes after startup).
Time range longer than uptime: If you select "Last 15 minutes" but DFS has been running for 5 minutes, all calculations use the 5 minutes of available data. The remaining 10 minutes have no records and are not counted — Availability reflects the actual operating period only.
No active work order: Production Progress shows NO_ACTIVE_ORDER with zero values. OEE panels are unaffected — they calculate from machine data regardless of work order status.
No production in window: If no parts were produced in the selected time range, Performance and Quality show 0%. Availability still shows a value based on state transitions.
All topic paths referenced above are under mHv1.0/dfs/LINE-BC-01/.