Walkthrough: Antigravity + Gemini
This walkthrough shows how we used Antigravity with Gemini Pro 3.1 to build three production pipelines and a comprehensive monitoring dashboard for the Caliperline demo environment — entirely through natural language prompts.
The connections used in this walkthrough (Modbus, OPC UA, REST, etc.) were set up automatically via the Digital Factory Simulator easy setup. If you want to follow along, run the DFS setup first — it will create all the Caliperline connections and simulated devices for you.
What We Built
By the end of this session, the AI had created:
- 3 pipelines covering Modbus, OPC UA, and REST protocols
- 1 dashboard with 9 panels across 6 visualization types (state-timeline, gauge, line chart, pie chart, and tables)
- All wired together: pipelines publish to UNS topics, dashboard reads from those topics
Part 1: Building the Pipelines
Prompt:
Can you design and implement some pipelines using the Caliperline connections?
That's it — one open-ended prompt. Gemini explored the available connections, discovered their protocols and functions, and autonomously designed three pipelines covering different patterns. Here's what it built.
Pipeline 1: OP10 Modbus Telemetry
What the AI did:
- Called
manage_connectionswith actionlistand search"Caliperline"to discover all 8 connections and their types - Called
manage_functionswith actionliston the Modbus, OPC UA, and REST connections to understand what data was available - Called
explore_node_typeswith actionlistto understand available pipeline nodes - Decided to create three pipelines based on the connection types and available functions
- Called
manage_pipelineswith actioncreatefor the first pipeline with this flow:
Resulting pipeline:
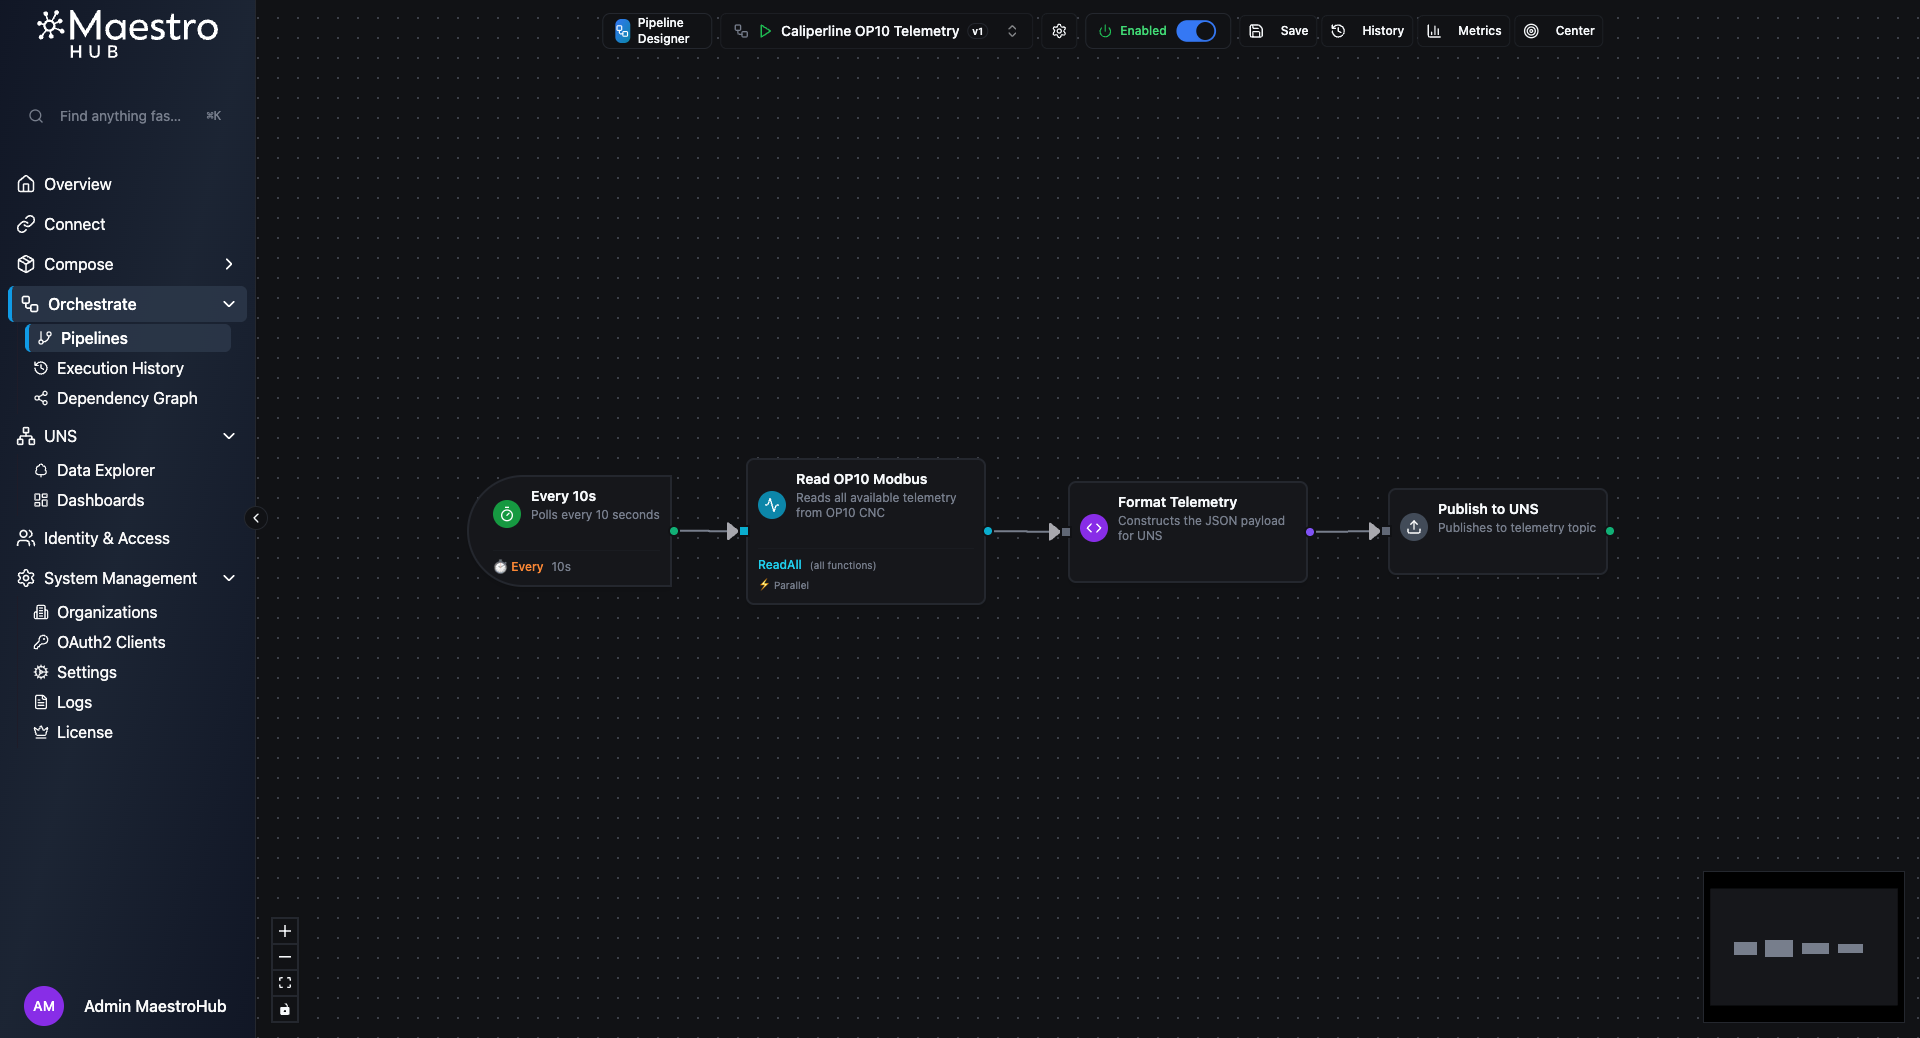
The OP10 Telemetry pipeline — 4 nodes polling Modbus every 10 seconds
| Node | Type | Purpose |
|---|---|---|
| Every 10s | trigger.schedule | Polls every 10 seconds |
| Read OP10 Modbus | connected.modbus.readgroup | Reads all registers with readAll: true and continueOnError: true |
| Format Telemetry | logic.javascript | Iterates over results, extracts successful values, adds machine field |
| Publish to UNS | system.uns.publish | Publishes to caliperline/machines/op10/telemetry |
The JavaScript node that Gemini generated handles the Modbus read group output format correctly — it filters out the _meta key and only includes registers that read successfully:
const data = $node['Read OP10 Modbus'];
const payload = {};
for (const [key, result] of Object.entries(data)) {
  if (key !== '_meta' && result.success) {
    payload[key] = result.value;
  }
}
payload.machine = 'OP10-CNC';
return { payload };
Live output (from query_topic_data with action fetch_recent):
{
  "machine": "OP10-CNC",
  "State": 3,
  "SpindleSpeed": 500,
  "SpindleLoad": 62,
  "Temperature": 262,
  "Vibration": 129,
  "PowerKW": 358,
  "PartsProduced": 32,
  "PartsGood": 31,
  "PartsBad": 1,
  "FaultActive": 1,
  "FaultCode": 4,
  "RunTime": 67436544,
  "DownTime": 0
}
Pipeline 2: OP20 OPC UA Fault Alerts
Still working from the same prompt, Gemini created the second pipeline — this time with conditional branching:
Resulting pipeline:
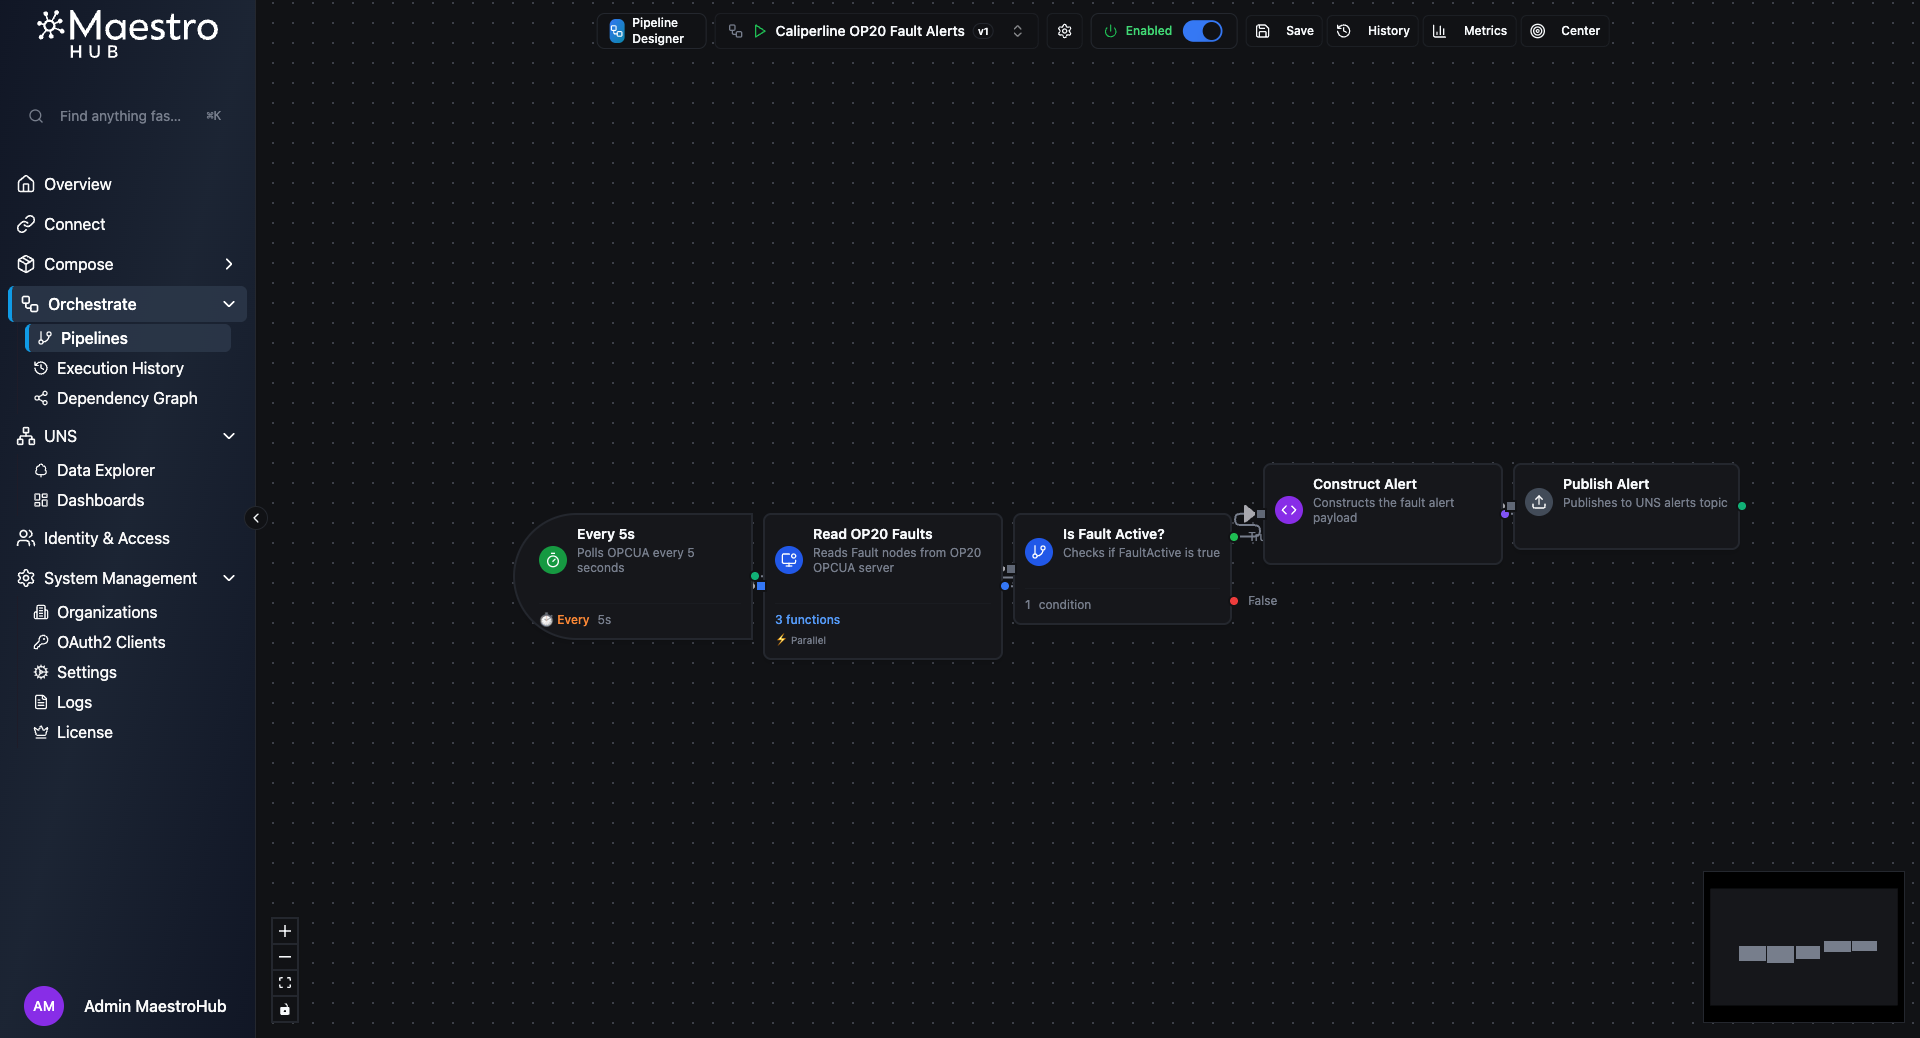
The OP20 Fault Alerts pipeline — conditional branching only publishes when a fault is active
| Node | Type | Purpose |
|---|---|---|
| Every 5s | trigger.schedule | Polls every 5 seconds |
| Read OP20 Faults | connected.opcua.readgroup | Reads 3 specific functions by alias: FaultActive, FaultCode, FaultName |
| Is Fault Active? | logic.condition | Checks FaultActive.value === true |
| Construct Alert | logic.javascript | Builds the alert payload (only runs when fault is active) |
| Publish Alert | system.uns.publish | Publishes to caliperline/alerts/op20/fault |
Key detail: the edge from the condition node to the JavaScript node uses sourcePort: "true", so the alert is only constructed and published when a fault is actually active. The AI got this branching pattern right on the first try.
The JavaScript node includes defensive checks for each OPC UA read result:
const data = $node['Read OP20 Faults'];
return {
  payload: {
    machine: 'OP20-CNC',
    faultCode: data.FaultCode && data.FaultCode.success ? data.FaultCode.value : 'UNKNOWN',
    faultName: data.FaultName && data.FaultName.success ? data.FaultName.value : 'Unknown Fault',
    severity: 'critical',
    timestamp: new Date().toISOString()
  }
};
Pipeline 3: MES Orders Sync
The third and final pipeline from the same prompt — a REST API integration:
Resulting pipeline:
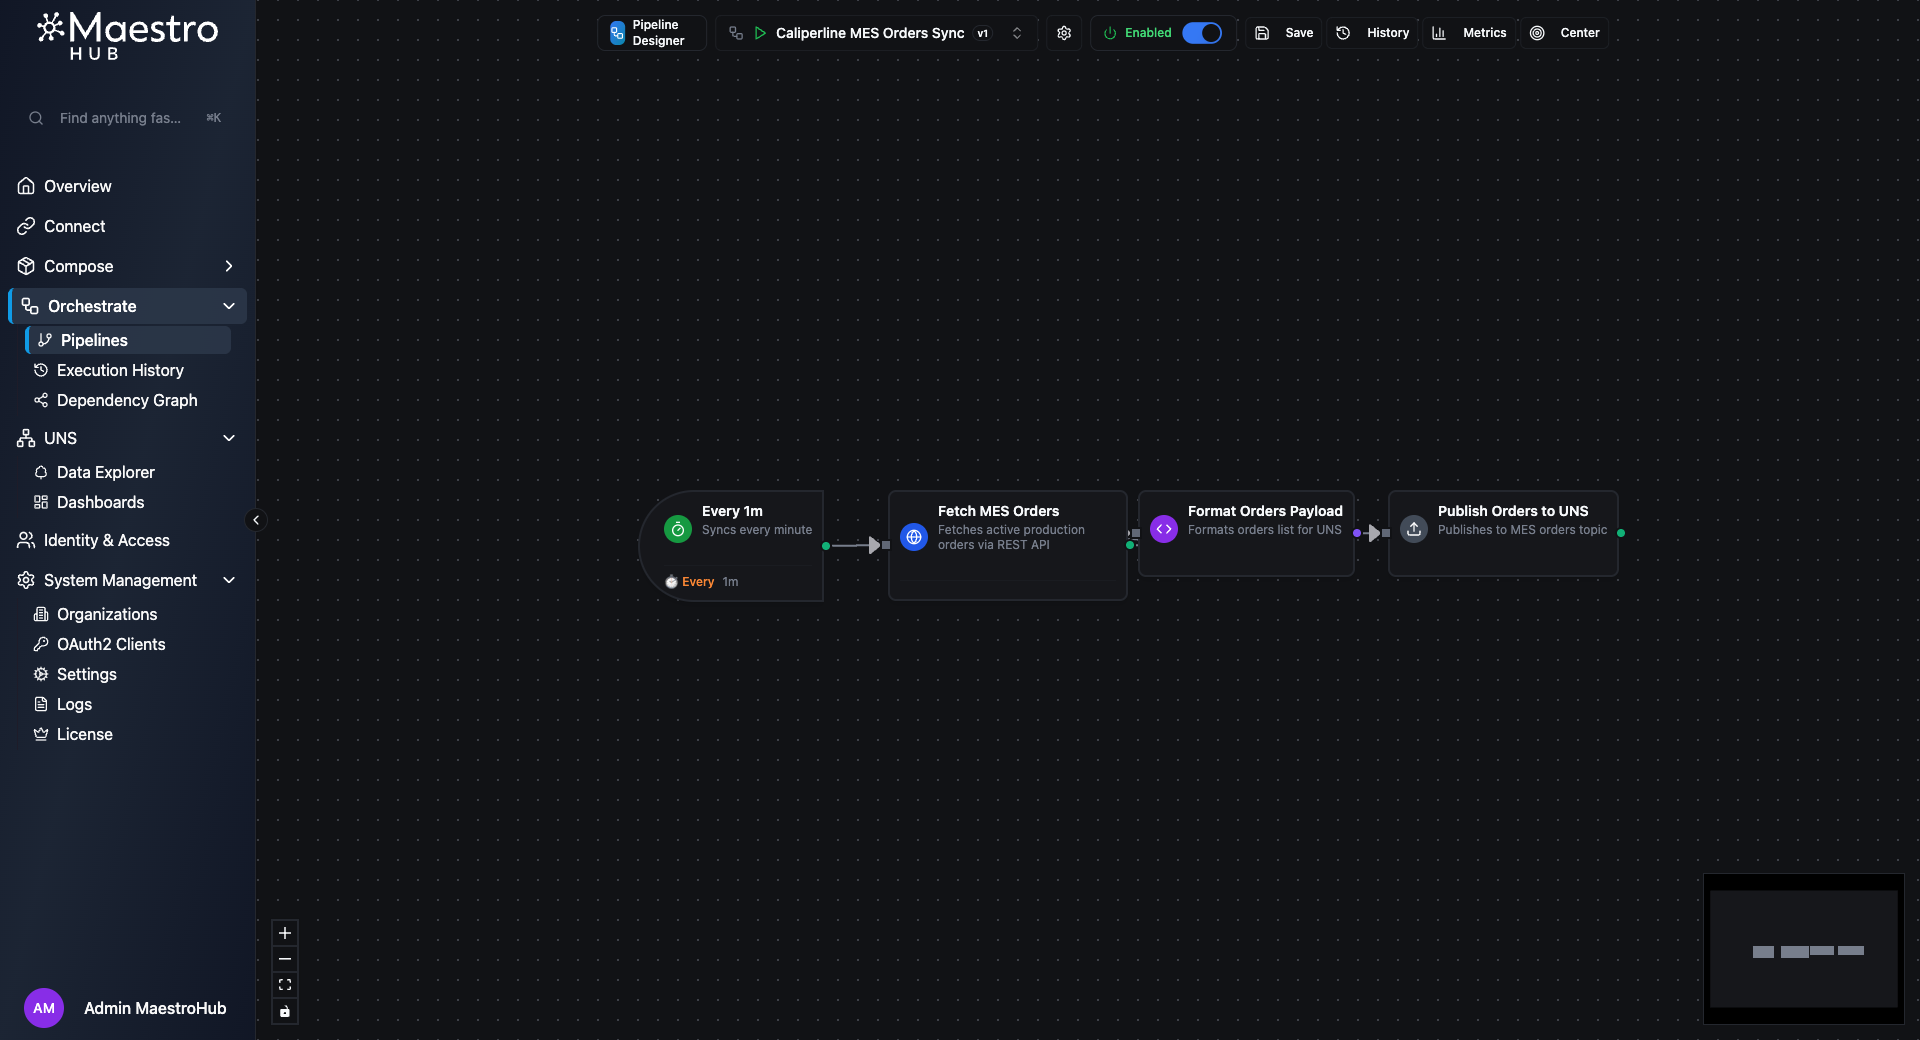
The MES Orders Sync pipeline — REST API polling every minute
| Node | Type | Purpose |
|---|---|---|
| Every 1m | trigger.schedule | Syncs every minute |
| Fetch MES Orders | connected.rest.request | Calls the MES API to get active orders |
| Format Orders Payload | logic.javascript | Wraps the response with metadata |
| Publish Orders to UNS | system.uns.publish | Publishes to caliperline/mes/orders/active |
The JavaScript enriches the raw REST response:
const reqResult = $node['Fetch MES Orders'];
return {
  payload: {
    source: 'MES',
    totalActive: Array.isArray(reqResult.data) ? reqResult.data.length : 0,
    orders: reqResult.data || []
  }
};
Part 2: Building the Dashboard
With all three pipelines running and publishing data, we asked the AI to create a monitoring dashboard.
Prompt:
Now, I want you to create a comprehensive dashboard using those pipelines you just created.
What the AI did:
- Called
query_topic_datawith actionfetch_recenton each topic to check the data schema and actual value ranges - Called
manage_panelswith actionlist_typesto understand panel configuration options - Called
manage_dashboardswith actioncreatewith 9 panels arranged in a grid layout
Resulting dashboard:
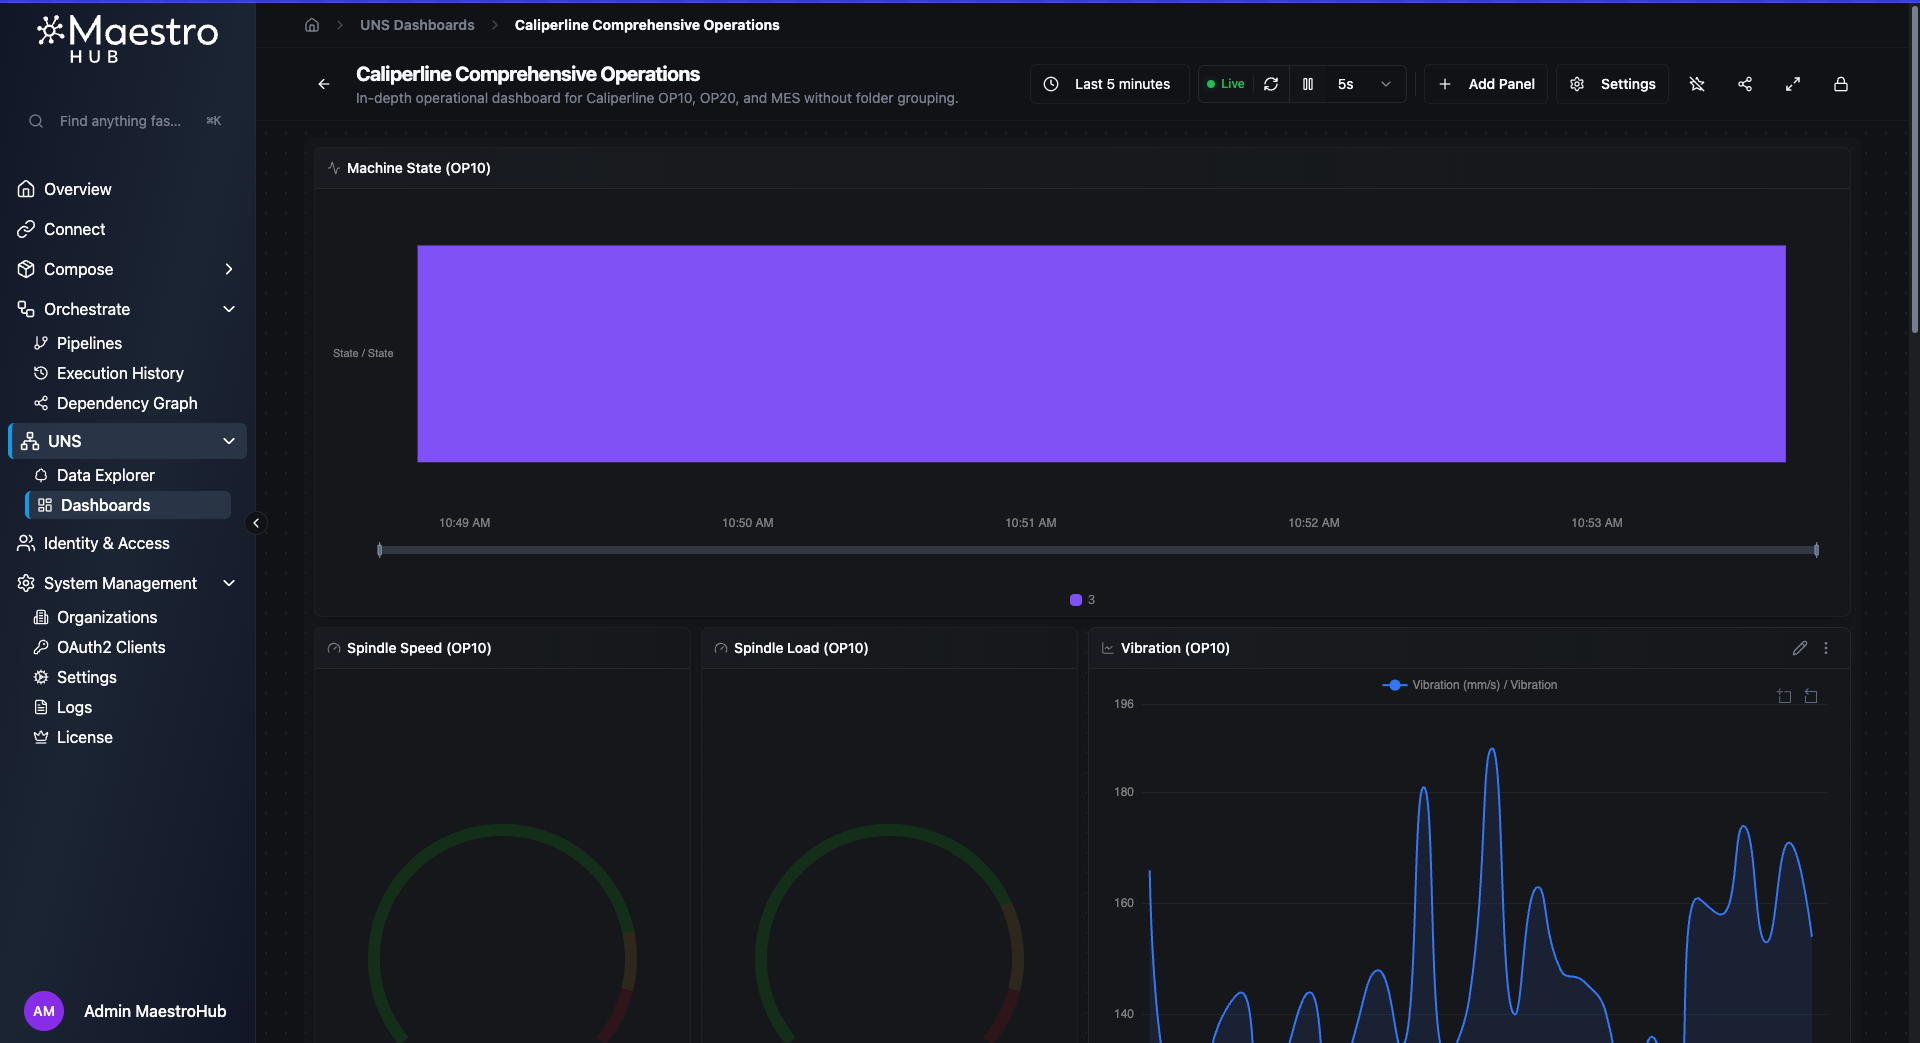
Top: Machine State timeline with color-coded states, gauges for Spindle Speed and Load, and a Vibration trend line
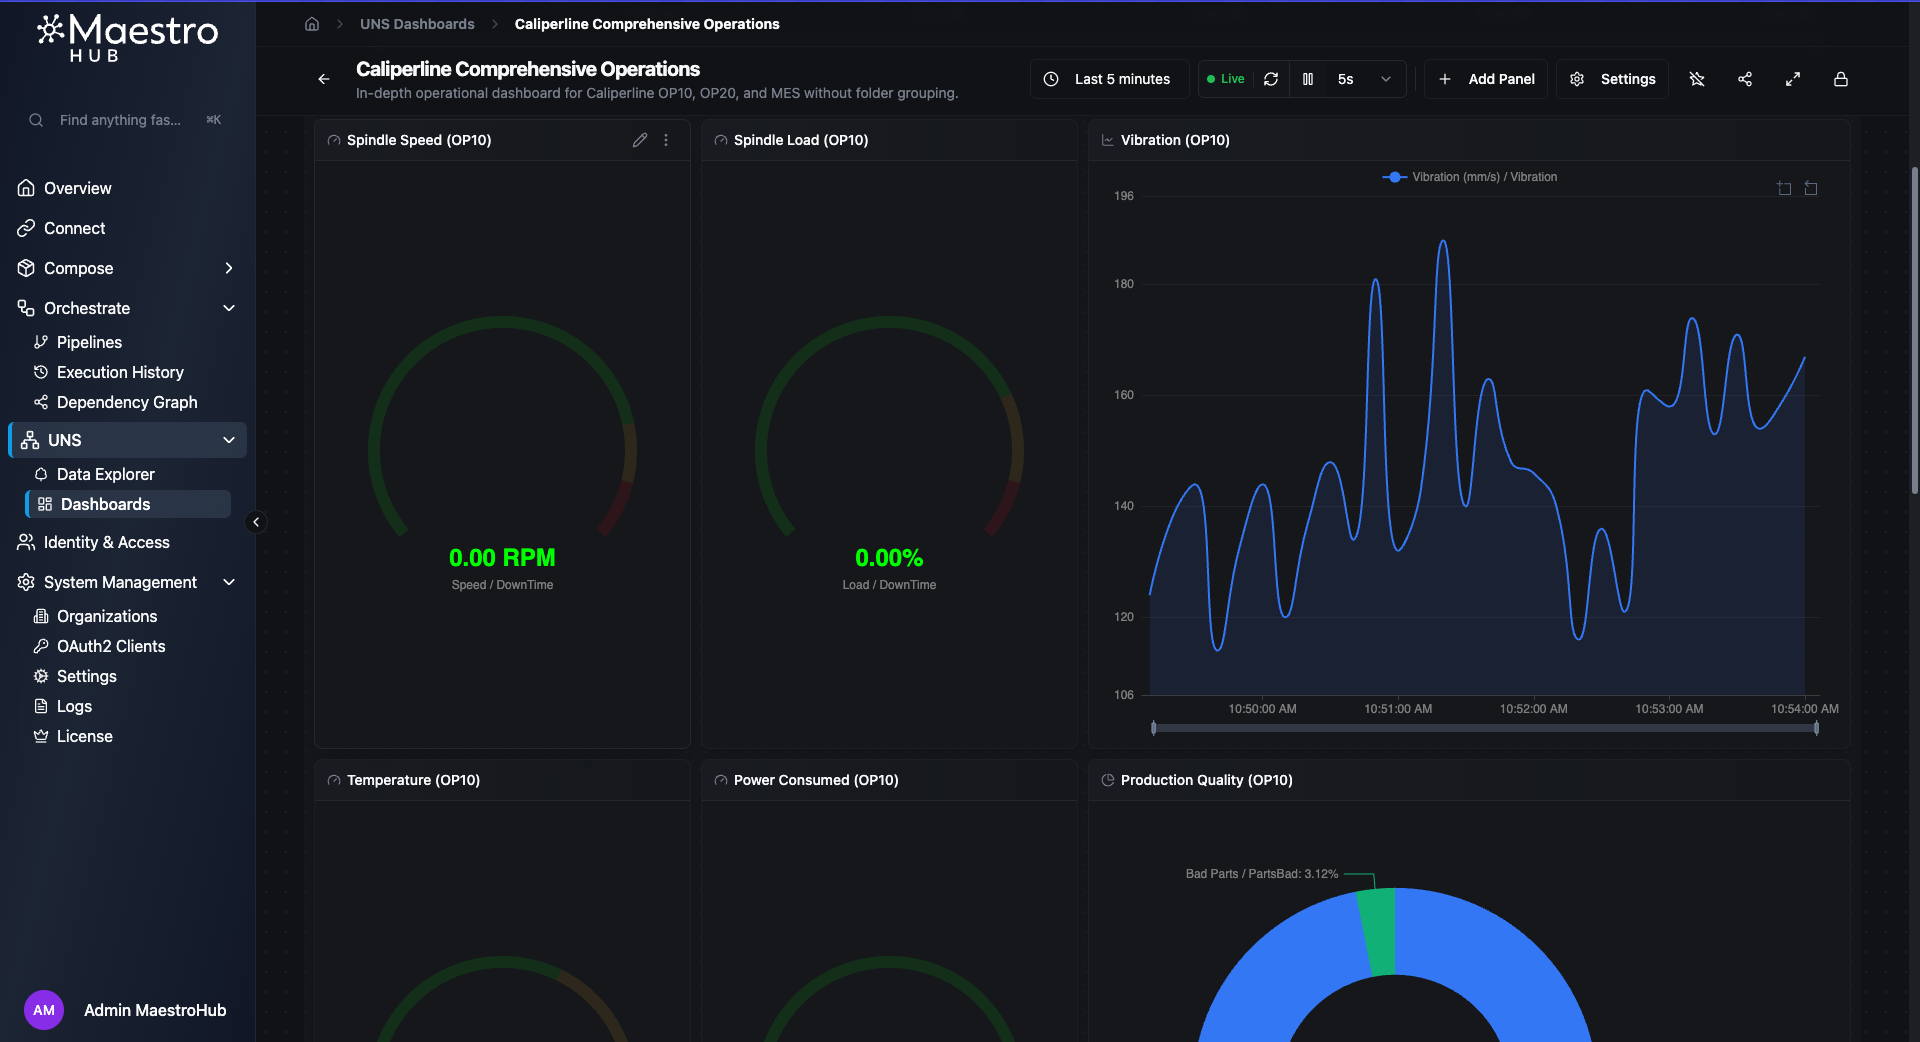
Middle: Spindle gauges with threshold bands, Vibration chart showing real-time fluctuations
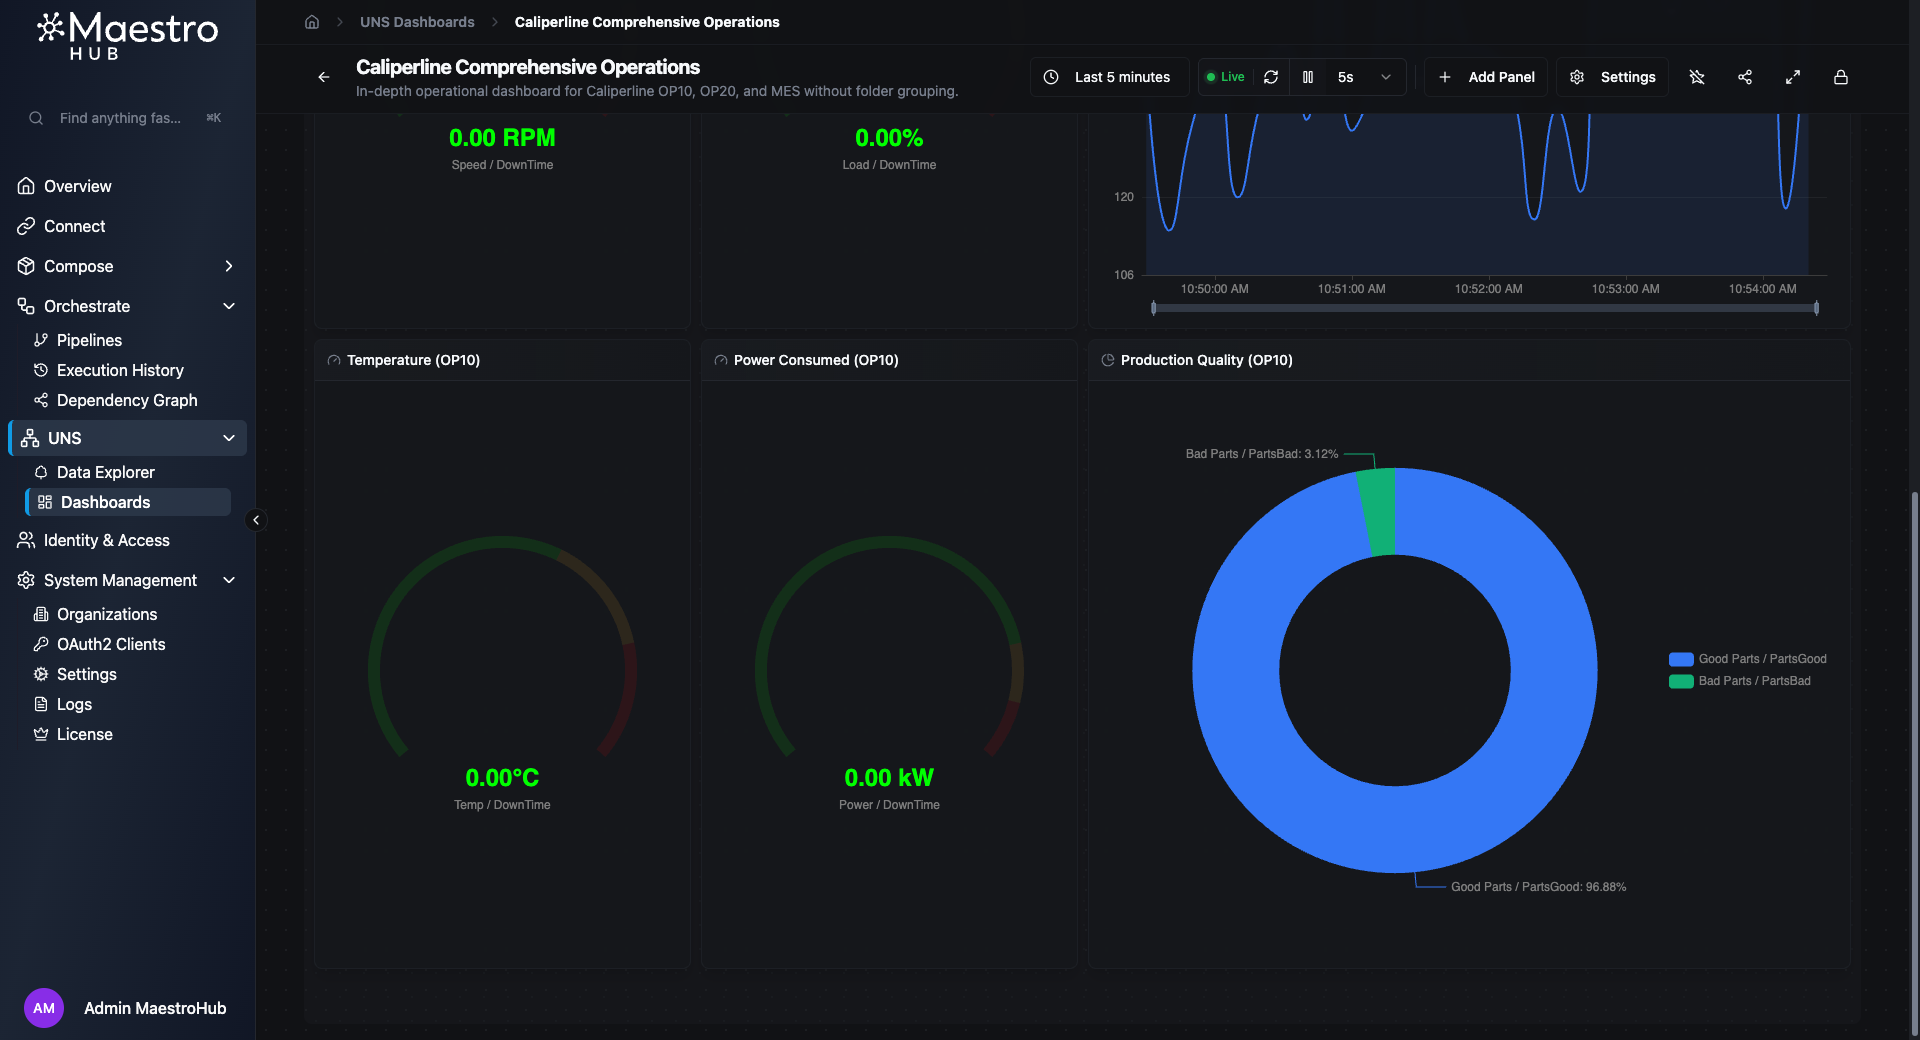
Bottom: Temperature and Power gauges, Production Quality donut chart (96.88% good parts)
Panel details
Gauges — All four gauges use three-tier threshold bands:
| Gauge | Normal (green) | Warning (yellow) | Critical (red) |
|---|---|---|---|
| Spindle Speed | 0–8,000 RPM | 8,000–9,000 | 9,000–10,000 |
| Spindle Load | 0–75% | 75–90% | 90–100% |
| Temperature | 0–300°C | 300–400°C | 400–500°C |
| Power | 0–800 kW | 800–900 kW | 900–1,000 kW |
Vibration line chart — Uses threshold bands as background overlays (opacity 15%) to visually highlight when vibration enters warning or critical zones.
State timeline — Maps numeric state values to human-readable labels with color coding: 5 → Running (green), 4 → Idle (yellow), 3 → Fault (red).
Tables — Both tables are sorted by time (descending) so the most recent entries appear first.
Dashboard configuration
Time range: last 1 hour (relative)
Refresh rate: 5 seconds
Labels: system=caliperline, view=comprehensive
Grid: 12 columns
Observations
A few things we noticed working with Antigravity + Gemini Pro 3.1 on MaestroHub MCP:
- Protocol awareness — Gemini correctly handled three different protocol patterns (Modbus
readAll, OPC UA with specific function aliases, REST request/response) without confusion. - Branching logic — The OP20 fault alert pipeline used
sourcePort: "true"on the condition edge correctly on the first attempt. - Defensive code — The generated JavaScript includes null checks and fallbacks (
data.FaultCode && data.FaultCode.success ? ...), which is important for real industrial connections that may intermittently fail. - Dashboard data awareness — Before creating panels, Gemini fetched recent data to understand the actual field names and value ranges rather than guessing thresholds.
- Complete on first try — The dashboard was created with all 9 panels in a single prompt, including the OP20 fault alerts table.
- Autonomy from a vague prompt — Given just "design and implement some pipelines using the Caliperline connections", Gemini explored 8 connections, chose 3 that had meaningful data, designed appropriate pipeline patterns for each protocol, and created all three — without being told what to build.
Prompts Summary
For quick reference, here are all the prompts used in order:
- "Can you design and implement some pipelines using the Caliperline connections?"
- "Now, I want you to create a comprehensive dashboard using those pipelines you just created."
Two prompts. Three pipelines. One dashboard. Zero lines of code written manually.