Dependency Graph
Overview
The Dependency Graph is an interactive map of every entity in your MaestroHub workspace — pipelines, connections, functions, UNS topics, and dashboards — and the dependencies between them. Use it to understand how your system is wired together, trace the impact of a change before you make it, and spot unused or fragile resources.
Rather than dumping every node onto one canvas, the graph is focus-centric: it always centers on a single entity and renders its surrounding neighborhood — everything connected to it within a few hops. You explore by re-centering on whichever entity you care about next, so even very large workspaces stay readable.
Navigation Path: Orchestrate > Dependency Graph
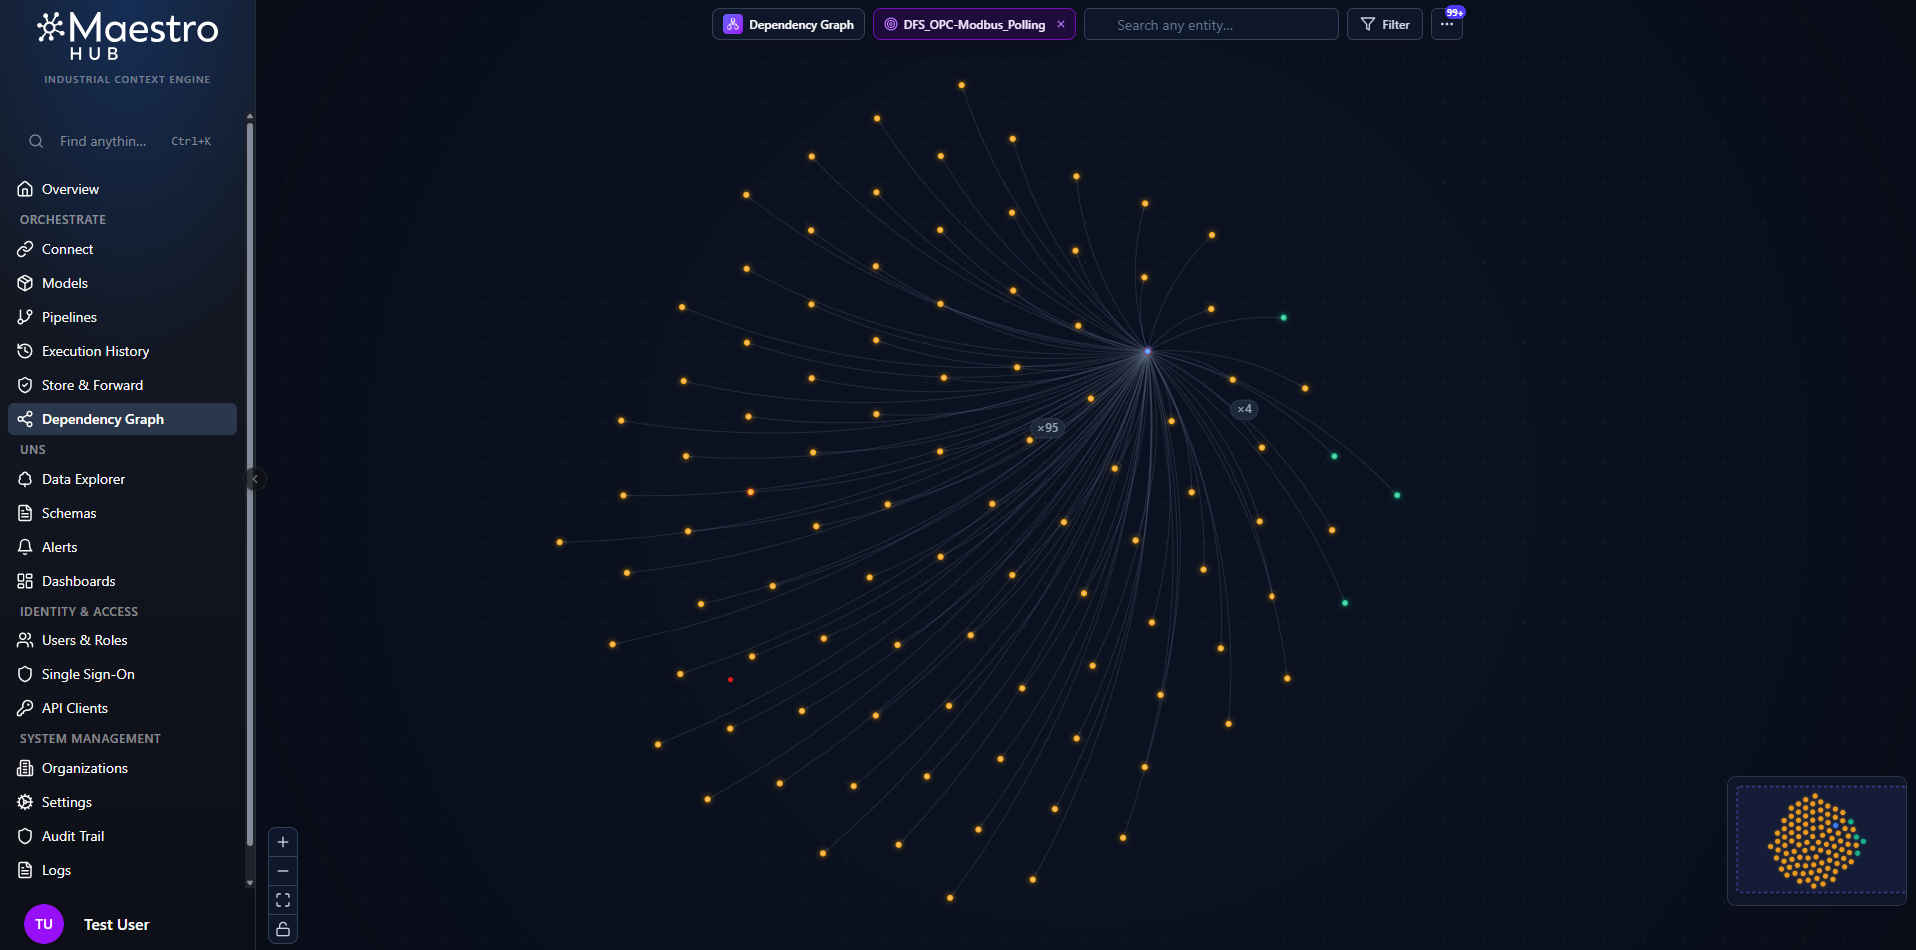
The Dependency Graph centered on a focal entity, showing the pipelines, connections, functions, topics, and dashboards connected to it.
Entity Types
Each node in the graph represents one of five entity types. Every type has a distinct color so you can identify it at a glance — on the canvas, in the detail panel, and in search results.
| Entity Type | Color | Description |
|---|---|---|
| Pipeline | Blue | A workflow in the Pipeline Designer. |
| Connection | Green | A configured connector profile (MQTT, OPC UA, Modbus, etc.). |
| Function | Amber | A reusable function defined within a connection. |
| Topic | Magenta | A UNS topic path. |
| Dashboard | Pink | A UNS dashboard. |
On the canvas, each node card shows a colored accent bar, a type initial, and the entity name. Edges (arrows) between nodes show a dependency relationship — the arrow points from the entity that depends on another toward the entity it depends on (for example, a pipeline node pointing to the connection it reads from).
Focus and the Neighborhood
The graph always has one focal entity. The canvas shows that entity at the center plus its connected neighborhood — direct neighbors and their neighbors, out to a few hops. This keeps the view meaningful no matter how large your workspace is.
You can change the focal entity from many places, and every one of them re-centers the canvas the same way:
- Click any node on the canvas to re-center on it.
- Pick a result from the toolbar search.
- Click a story card in Mission Control (see below).
- Click an entity in the Insights panel.
- Click a dependency or dependent row in the detail panel.
- Click an entry in the breadcrumb trail.
- Open the page with a
?focus=deep link (the "View dependencies" shortcut on entity pages produces one of these).
The current focal entity is shown as a chip in the toolbar with its name. Click the ✕ on the chip to clear focus and return to the landing experience.
Mission Control (Landing)
When you open the page without a specific entity in mind, the graph drops you into Mission Control — it auto-focuses the strongest hub in your workspace (the most-connected entity) so the canvas is never blank, and overlays a short stack of narrated story cards:
- Heart of your system — your most-connected entity. Changes here ripple the widest.
- Single point of failure / Silent breakage risk — the top structural-risk or silent-breakage entity surfaced by Insights. (If no insights have been computed yet, this card falls back to your second-most-connected hub.)
- Drifting alone — entities flagged as unused or stale and likely safe to clean up. (Falls back to your third-most-connected hub when there are no hygiene flags.)
Click any card to re-center the graph on that entity. Dismiss the stack with the ✕ in its header — the canvas keeps its current focus; only the cards get out of the way. Clearing focus brings Mission Control back so the landing experience is reproducible.
When nothing is focused (for example, right after you clear focus) the cards expand into a larger centered "Where do you want to look?" layout that also shows totals — your entity count, connection count, and a per-type breakdown.
The Toolbar
The toolbar floats at the top-center of the canvas and holds every primary control:
| Control | What it does |
|---|---|
| Focal entity chip | Shows the name of the entity currently in focus. Click ✕ to clear focus. |
| Search | Find and jump to any entity in the workspace (see Searching). |
| Filter | Open the search-scope and dynamic-edge options (see Filtering). |
| ⋯ (More) | Opens a menu with Insights, Refresh, and Rebuild graph. A badge on this button shows the current insight count. |
A breadcrumb trail appears just below the toolbar once you've navigated through more than one entity.
Searching
Use the Search box in the toolbar to find any entity by name across the entire workspace.
- Start typing to see live results. Each result row shows the entity name, its type (color dot), and how many edges it has.
- Use the ↑ / ↓ arrow keys to move through the result list and press Enter to pick the highlighted one, or click any row.
- Picking a result re-centers the canvas on that entity and opens its detail panel — search is how you navigate, not just highlight.
- Press Esc or click the ✕ to dismiss the results.
Search covers your whole workspace, not just the entities currently on screen. The result list is narrowed by the search scope set in the Filter panel.
Filtering
Click the Filter button in the toolbar to control two things: which entity types the search and starter suggestions consider, and whether runtime-discovered edges are shown.
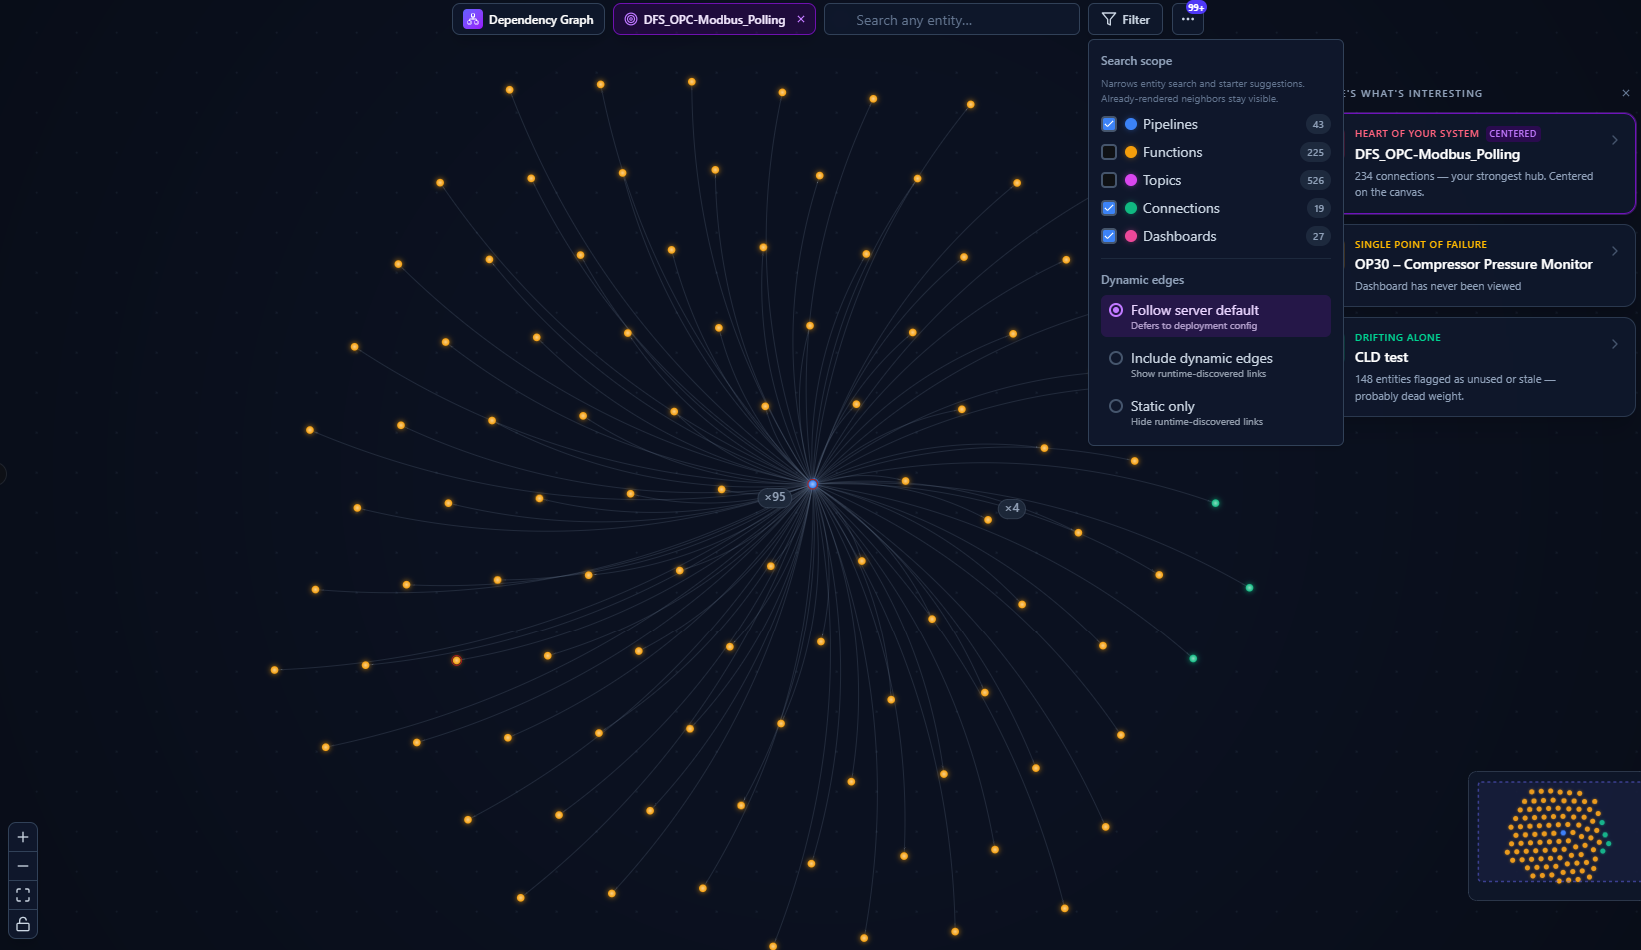
Filter panel: set the search scope per entity type, and choose how dynamic (runtime-discovered) edges are handled.
Search scope
Toggle individual entity types on or off. Each row shows a live count of that type in your workspace.
| Type | Default | Notes |
|---|---|---|
| Pipeline | On | |
| Connection | On | |
| Dashboard | On | |
| Function | Off | Often tens of thousands per workspace, so opt-in. |
| Topic | Off | Often tens of thousands per workspace, so opt-in. |
The search scope narrows entity search and the starter suggestions — it does not redact the neighbors already rendered around your focal entity. If you've focused on a pipeline, the functions and topics it touches still appear on the canvas even when those types are toggled off, because "show me everything connected to this" is what focusing asks for.
Dynamic edges
Some dependencies are discovered at runtime rather than declared in configuration. Choose how they're treated:
| Option | Behavior |
|---|---|
| Follow server default | Defer to your deployment's configured default. |
| Include dynamic edges | Show runtime-discovered links. |
| Static only | Hide runtime-discovered links. |
Your choice is reflected in the URL, so a filtered view can be shared or bookmarked.
Navigating the Canvas
Zoom and Pan
| Action | How |
|---|---|
| Pan | Scroll wheel (any direction), or middle-click drag |
| Zoom in / out | Ctrl / Cmd + scroll wheel, or the + / − buttons (bottom-left controls) |
| Fit all nodes to view | Click the Fit button in the bottom-left controls |
| Lock / unlock node dragging | Click the Lock toggle in the bottom-left controls to prevent or allow dragging nodes around |
You can drag any node to reposition it; dragged nodes stay pinned where you drop them.
The canvas uses Level of Detail (LOD) rendering: when zoomed out, nodes collapse to colored dots (with small badges summarizing how many edges cross between entity-type clusters) to keep things performant. As you zoom in, nodes expand into labeled cards showing the entity name, type, and a depth badge.
Minimap
A minimap in the bottom-right corner shows your current viewport relative to the whole neighborhood. Click anywhere on it to pan the main canvas to that spot. The minimap shifts left automatically when the detail panel is open so the two don't overlap.
Hover Highlighting
Hover over any node to highlight its dependency chain within the current neighborhood.
- The hovered node is shown at full brightness, and animated particles flow along its closest links.
- Its direct neighbors (1 hop) stay bright, with 2nd- and 3rd-degree connections progressively dimmed.
- All unrelated nodes and edges fade to near-invisible.
This makes it easy to trace which entities a given node depends on — or which would be affected if it changed — without clicking into anything.
Depth Badge
Each node card shows a small depth badge (e.g., d2, d4) in its lower-left corner. This number is the longest dependency chain extending out from that node within the current neighborhood — how many hops it is to its deepest downstream dependency.
A depth of d0 means the node has no further dependencies in view. A higher number (e.g., d5) means the node sits at the top of a long chain. When zoomed out to dot mode, the depth is shown as a partial arc around the dot instead of a badge.
Node Detail Panel
Re-centering on an entity (by clicking it, searching for it, or any other focus action) opens the Detail Panel on the right side of the screen.
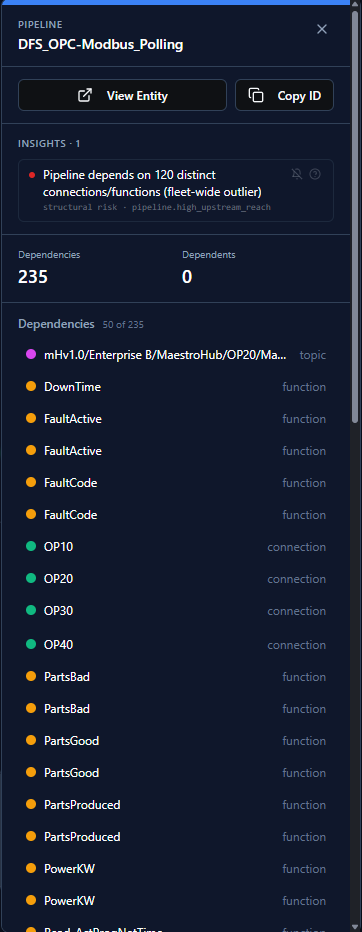
Detail panel: entity info, any insights for the entity, and paginated lists of what it depends on and what depends on it.
The Detail Panel shows:
- Entity name and type, with View Entity (open the entity's configuration page in a new tab) and Copy ID actions.
- Insights for this entity, if any — each with a help icon (opens the reference) and a snooze button.
- Dependencies and Dependents counts.
- Metadata captured for the entity.
- Dependencies — the entities this node directly depends on.
- Dependents — the entities that directly depend on this node.
The dependency and dependent lists are paginated: click Load more to fetch additional entries when an entity has many. Clicking any row re-centers the canvas on that entity, so the panel doubles as a navigation surface.
Context Menu
Right-click any node for quick actions without changing focus. The menu header shows the node's dependency and dependent counts.
| Action | Description |
|---|---|
| View | Opens the entity's configuration page in a new tab. |
| Focus | Re-centers the canvas on this node. |
| Copy ID | Copies the entity's ID to your clipboard. |
Breadcrumb Trail
As you re-center from one entity to the next, a breadcrumb trail appears below the toolbar recording your path (up to 8 entries). Click any entry to jump back to that entity. The trail appears once you've visited more than one entity.
Insights
The Dependency Graph continuously analyzes your architecture and flags entities worth attention. Insights are grouped into three kinds:
| Kind | Meaning |
|---|---|
| Silent breakage | Something is likely failing without raising an error — the most urgent kind. |
| Structural risk | An architectural concern, such as a single point of failure whose change would cascade widely. |
| Hygiene | A soft cleanup nudge — entities that appear unused or stale. |
Insights surface in three places:
- On the canvas — flagged nodes carry a small kind-colored corner dot (and a matching ring in dot mode).
- In the detail panel — the focused entity's own signals, each with a help link and a snooze button.
- In the Insights panel — open it from the ⋯ More menu (or the badge on that button). It docks on the left of the canvas so it can stay open alongside the detail panel.
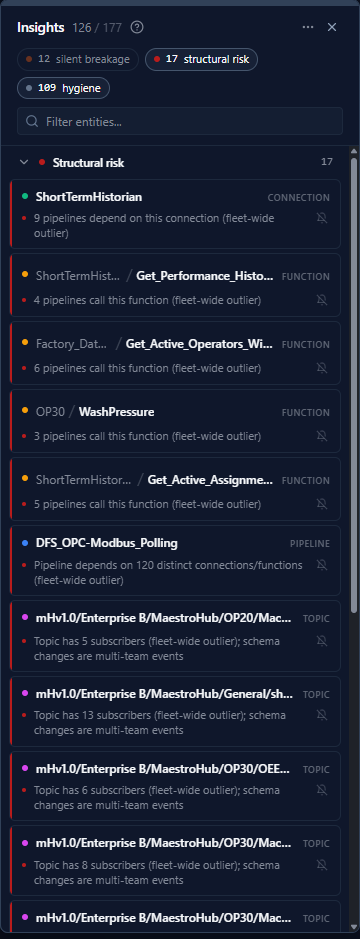
The Insights panel lists every flagged entity grouped by kind, with filtering, search, and snooze controls.
In the Insights panel you can:
- Filter by kind using the chips at the top, and search flagged entities by name.
- Click an entity to re-center the canvas on it.
- Snooze an individual signal, all currently-visible signals, or everything firing across the workspace — and Unsnooze all to bring them back.
- Open the reference (help icon) to read what each insight means.
Live Updates
The Dependency Graph stays in sync with your workspace automatically. When any entity is created, updated, or deleted — anywhere in MaestroHub — the view refreshes in the background within seconds, without a manual page reload.
Rebuilding the Graph
In rare cases (for example, after a data migration or system restore) the graph index can drift from the actual state of your workspace. You can trigger a full rebuild from the ⋯ More menu.
- Open the ⋯ More menu in the toolbar and choose Rebuild graph.
- Confirm the action in the dialog that appears.
- A progress indicator shows the rebuild status — current phase, percentage, and entities processed. The graph refreshes automatically when the rebuild completes.
Rebuilding re-scans every connection, function, and pipeline in the workspace and reconstructs all dependency relationships from scratch.
A rebuild can take a while on large workspaces. It runs in the background — you can close the dialog and keep working while it completes.
- Start from Mission Control to see your most-connected hubs and the entities most at risk, then drill in by clicking a story card.
- Before changing a connection, focus on it and check the Dependents list to see exactly which pipelines and dashboards will be affected.
- Keep the Insights panel open while you work to catch silent breakage and structural risk early, and use Hygiene flags to find dead weight worth removing.
- Toggle Function and Topic into the search scope when you need to jump straight to a specific function or topic by name.