Data Explorer
Data Explorer is where real-time and historical UNS data come together in a single workspace. Subscribe to any topic in the hierarchy, watch values flow in on a live chart, then switch to a historical view to analyse trends over hours or days — all without leaving the page.
Why Data Explorer? Real-time data only creates value when it is observed. This screen listens to UNS topics, charts their behaviour, and preserves history so teams can act on facts instead of assumptions.
Workspace Overview
When you open Data Explorer you see the Topic Explorer tree on the left and a detail panel on the right. Select a topic to subscribe and the detail panel populates with Field Statistics and a set of tabs: Live Data, Historical, Alerts, Violations, and Lineage.
Topic Explorer
The Topic Explorer presents the UNS hierarchy as a searchable tree. Expand from enterprise level down through site, area, line, and asset nodes to find the exact tag you need. Clicking a topic subscribes to it immediately and opens its data in the detail panel.

Searchable UNS hierarchy with plant, line, and asset levels.
Topic Settings
Right-click any node in the Topic Explorer to open a context menu with the following actions:
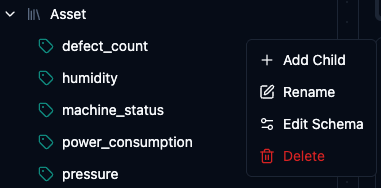
Right-click a topic to access management actions.
- Add Child — create a new child node under the selected topic by entering a name.
- Rename — change the name of the selected topic node.
- Edit Schema — define the expected data structure for this topic (see below).
- Delete — permanently remove the topic and its children from the hierarchy.
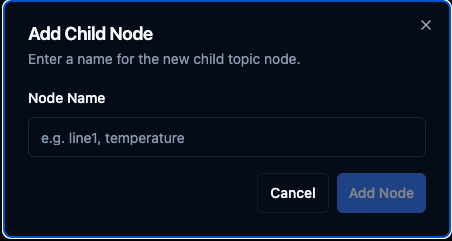
Add a new child node under the selected topic.
Edit Schema
The Edit Schema dialog lets you attach an informational data contract to a single topic — describing what type of data is expected, its unit, acceptable range, and alert thresholds. This per-topic schema is purely informational: it documents the topic's purpose and structure but does not validate or reject incoming data at runtime.
For reusable, versioned schemas that are validated on every publish — with rejections, violations, and threshold alerts — use the Schemas registry and bind a schema to this topic with a Topic Binding. The Edit Schema dialog below remains a lightweight, documentation-only alternative.
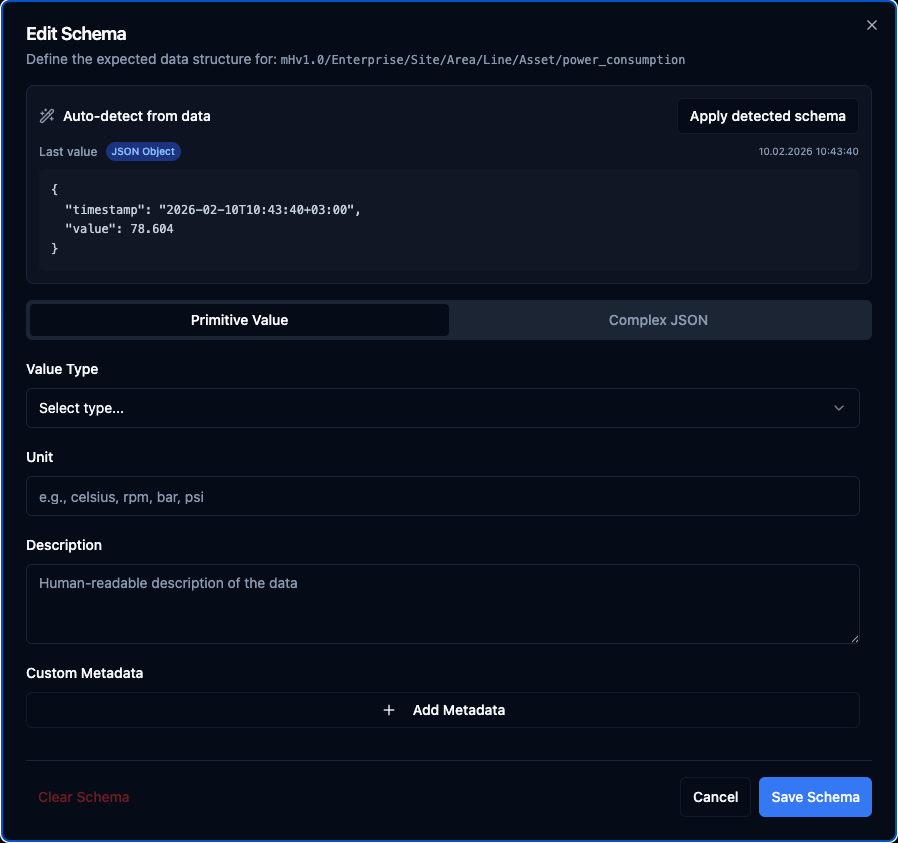
Define the expected data structure for a topic.
Auto-detect from data — the dialog shows the last value received on the topic. Click Apply detected schema and the system will automatically fill in the schema fields based on that value. If the value is a simple type (number, boolean, string) it switches to Primitive Value mode; if it is a JSON object it switches to Complex JSON mode and populates the field table.
Primitive Value — use this tab when the topic carries a single value such as a temperature reading, a counter, or a boolean flag.
| Field | Description | Example |
|---|---|---|
| Value Type | Data type of the value | Float, Integer, Boolean, String |
| Unit | Engineering unit | celsius, rpm, bar, psi |
| Description | Human-readable explanation | "Line 1 temperature sensor" |
| Min / Max | Expected value range (numeric types only) | Min: 0, Max: 200 |
| Alerting | Warning and critical thresholds with deadband (numeric types only) | Warning: 80–150, Critical: 0–200, Deadband: 0.5 |
| Custom Metadata | Free-form key-value pairs | location: Block A, sensor_id: S001 |
Complex JSON — use this tab when the topic carries a JSON object with multiple fields (e.g. {"temperature": 42.5, "pressure": 3.2}). Add a row for each field and specify its path, type, and unit. Expand a row to set per-field description, required flag, min/max range, and alert thresholds.
| Field Path | Type | Unit |
|---|---|---|
| temperature | Float | celsius |
| pressure | Float | bar |
| motor.rpm | Integer | rpm |
Save Schema persists the definition to the backend and publishes it as a retained MQTT message on the topic's $schema/ path. Clear Schema removes the definition entirely.
How Schema Storage Works
When you click Save Schema, the following happens behind the scenes:
-
The backend validates the schema (e.g. checks that value types are valid and min is not greater than max) and stores it as JSON in the topics database.
-
The schema is then published as a retained MQTT message to a dedicated schema topic. For example, if the data topic is:
mHv1.0/Enterprise/Site/Area/Line/Asset/temperaturethe schema is published to:
$schema/mHv1.0/Enterprise/Site/Area/Line/Asset/temperature
What does retained mean? A normal MQTT message is delivered to clients that are subscribed at that moment and then disappears. A retained message is stored by the broker — when a new client subscribes to that topic later, the broker immediately delivers the last retained message. The client does not need to be online when the schema was saved.
This means any MQTT client can subscribe to $schema/# at any time and instantly discover the data contracts for all topics that have a schema defined. There is no need to query an API or be connected at the exact moment a schema is updated.
When you click Clear Schema, the backend publishes an empty payload as a retained message. In MQTT, an empty retained payload tells the broker to delete the stored message for that topic. After clearing, new subscribers will no longer receive any schema for that topic.
The Edit Schema dialog is for documentation and discovery — it tells teams what data a topic is expected to carry, but does not enforce it. If a topic's schema says Boolean and the publisher sends a number, the message is still accepted. To validate and reject on publish, bind the topic to a schema from the Schemas registry instead.
Subscription Bar
Every active topic appears as a tag at the top of the detail panel, showing the full topic path and connection state. You can subscribe to multiple topics and switch between them quickly.
Topic Configuration
Click the configuration icon on a subscribed topic to open the Topic Configuration panel. Here you can control how the broker stores data for this topic.
The key setting is Retain Latest Value. When enabled, the broker persists the most recent value published to the topic, even after retention cleanup runs. This means any client that subscribes later will immediately receive the last known value — there is no need to wait for the next publish. This is especially useful for topics that update infrequently, such as configuration parameters or set-points, where the current state should always be available regardless of when someone connects.
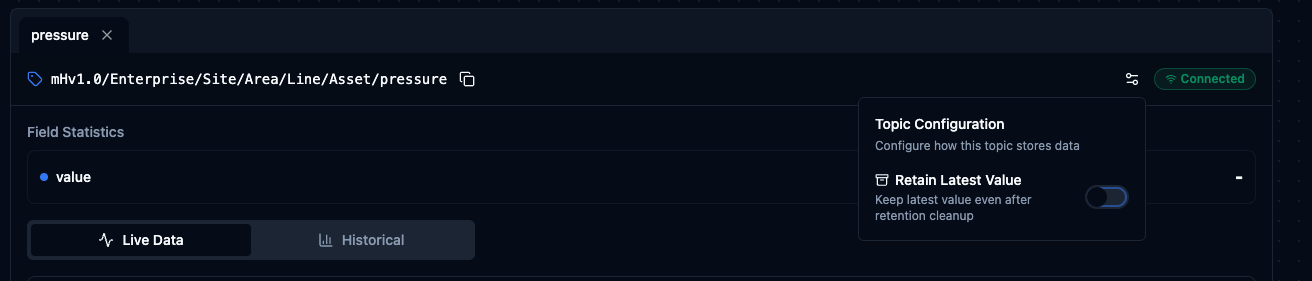
Enable Retain Latest Value to persist the most recent message on a topic.
Live Data
The Live Data tab is the default view when you subscribe to a topic. It provides two components that work together: a real-time trend chart and a live messages table.
Line Trend
A continuously updating line chart plots every incoming value as it arrives. The chart makes it easy to spot spikes, drops, or gradual drifts at a glance.
- Time-period selector — adjust the visible time window to focus on the last few minutes or a wider range.
- Pause — freeze the chart at the current moment so you can examine a value without the display scrolling away.
Live Messages
Below the chart, a Live Messages table logs every incoming message with columns for Time, Timestamp, Value, and Source. This gives you the raw data behind the chart so you can verify exact values, check sources, and correlate events down to the millisecond.
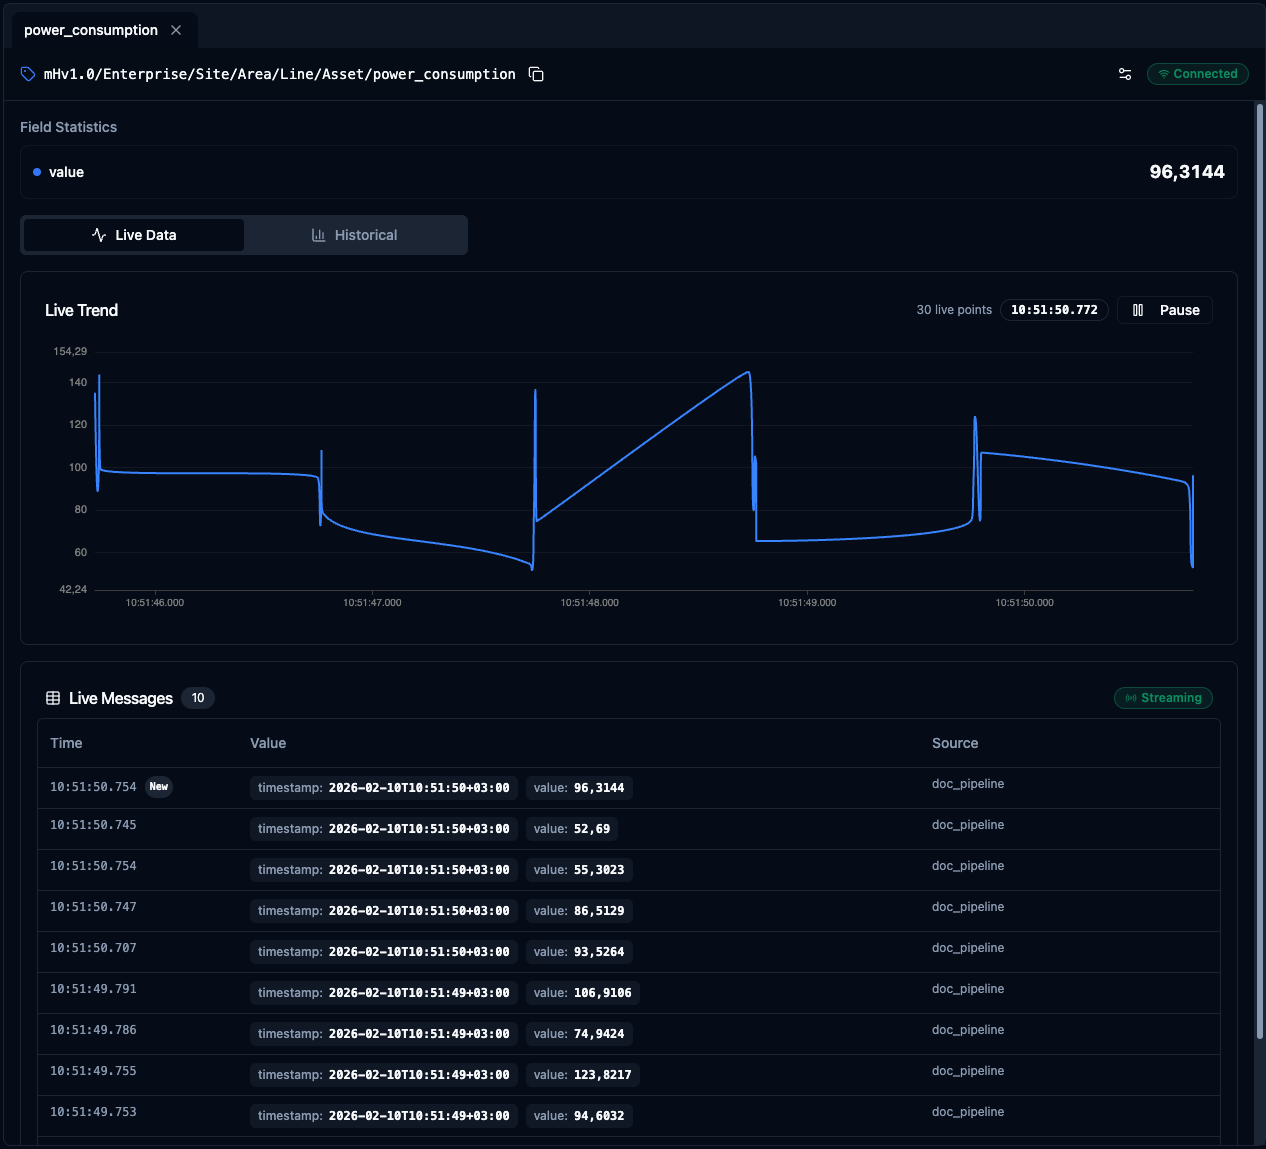
Real-time line trend and live messages table for the selected topic.
Historical
Switch to the Historical tab to analyse past data for the same topic. This tab shares a similar layout — a trend chart on top and a data table below — but focused on a configurable time range instead of a live stream.
Historical Trend
The Historical Trend chart renders all recorded values within the selected time range. Use it to identify patterns across shifts, compare days, or trace the timeline of an incident after the fact.
Time Range Selection
Choose a preset window or pick a custom range:
- 1H / 6H / 24H / 7D — quick presets that cover the most common analysis windows.
- Calendar picker — click the calendar icon to open a date picker and define an exact start and end date for your query.
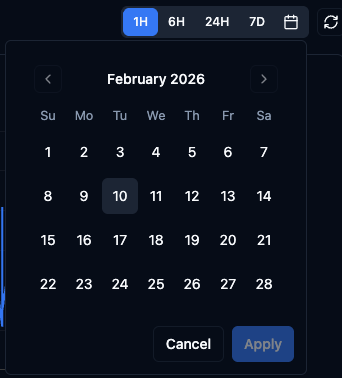
Select a preset time window or use the calendar to define a custom range.
Data Records
Below the chart, the Data Records table lists every historical message with the same columns as the live view: Time, Timestamp, Value, and Source. A record count is shown so you know exactly how many data points fall within your selected range.
Export
Click the Export button in the top-right corner of the Data Records section to download the visible records as a JSON file. This is useful for sharing evidence with other teams, attaching data to root-cause reports, or feeding records into external analysis tools.

Export historical records as JSON for offline analysis or reporting.
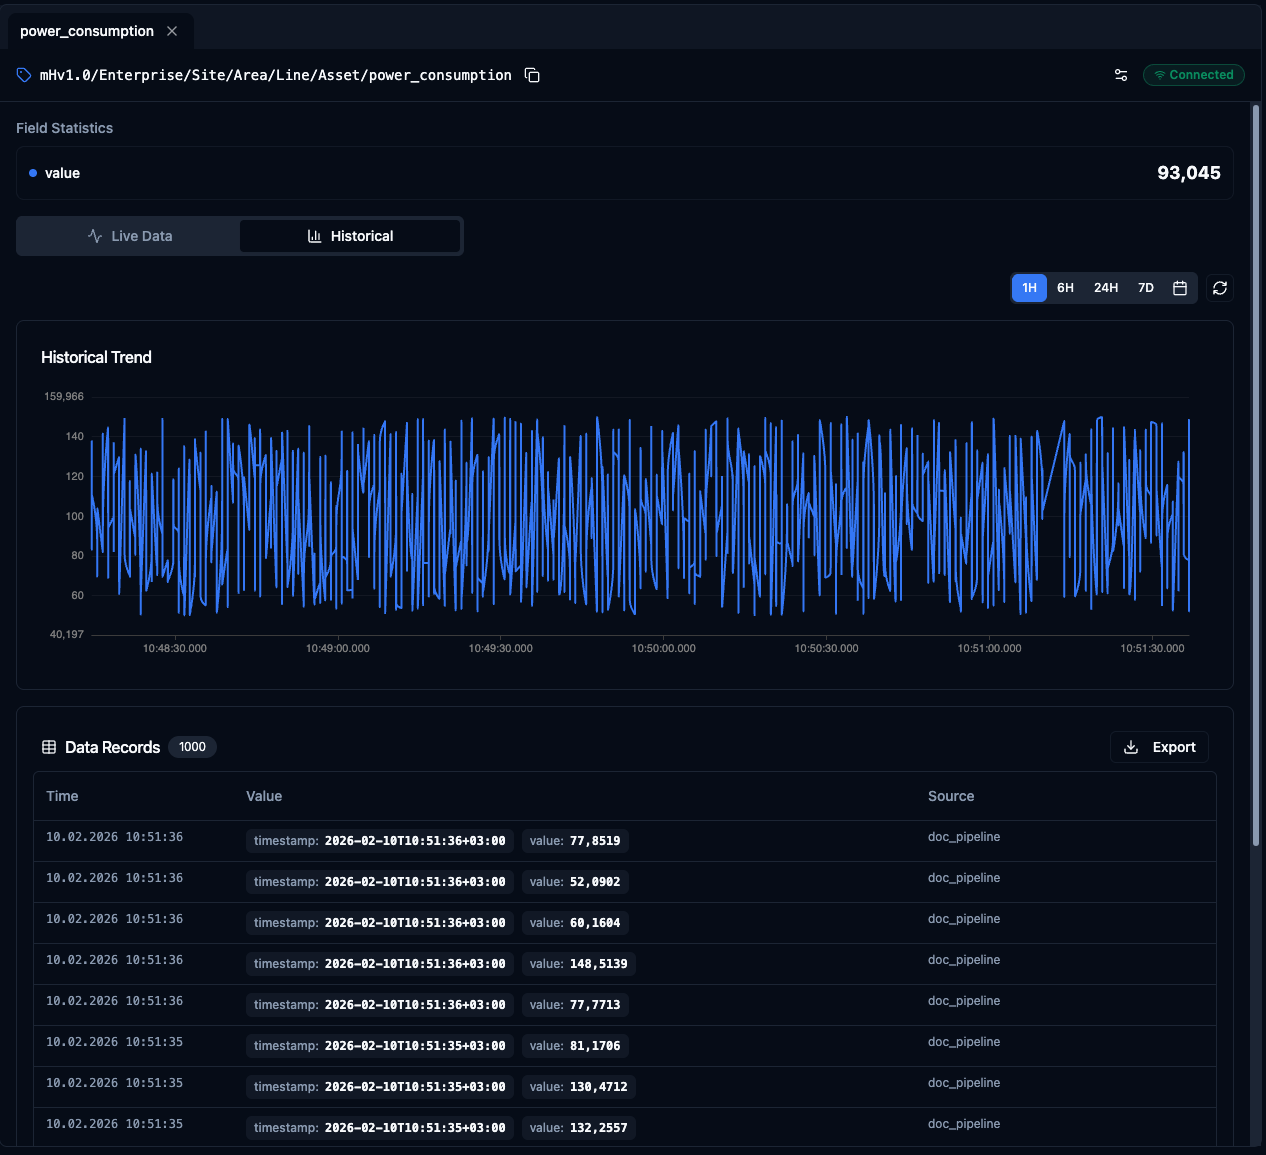
Historical trend chart and data records table with time range selection and export.
Alerts
The Alerts tab shows alert threshold crossings for the current topic — Alerts on this topic. When a numeric value published here crosses a warning or critical threshold defined on its bound schema, an alert is raised by the deadband evaluator, showing the level (warning/critical), the breaching value, the threshold, and the schema's remediation message. You can acknowledge an alert from its row.
When the topic is healthy you see No alerts — "This topic has been within its alert thresholds. Alerts will appear here when values cross warn or critical bounds."
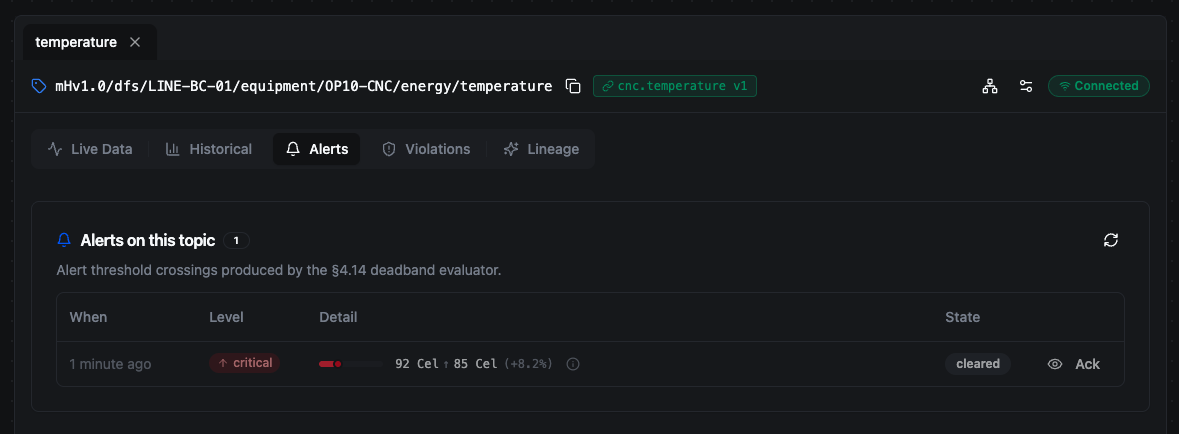
A critical alert on a temperature topic: 92 °C crossed the 85 °C threshold. It shows as cleared because the live value returned to normal — see the worked example on the Alerts page.
This is the topic-scoped view of the org-wide feed. For thresholds, the deadband state machine, acknowledging vs clearing, and how alerts differ from violations, see the Alerts page.
Alerts only appear once the topic is bound to a schema that defines warn/critical thresholds. Use Bind schema in the topic header to attach one — see Schemas.
Violations
The Violations tab shows publishes that failed schema validation for the current topic — Schema violations on this topic: "Published values that failed schema validation. Type violations were rejected; other kinds were stored with degraded quality." Each row identifies the offending value and whether it was rejected (a type mismatch) or stored with degraded quality (a range, shape, stale, overflow, or constraint violation).
When every publish has matched the contract you see No violations — "This topic has been honoring its schema. Violations will appear here when a publish fails validation."
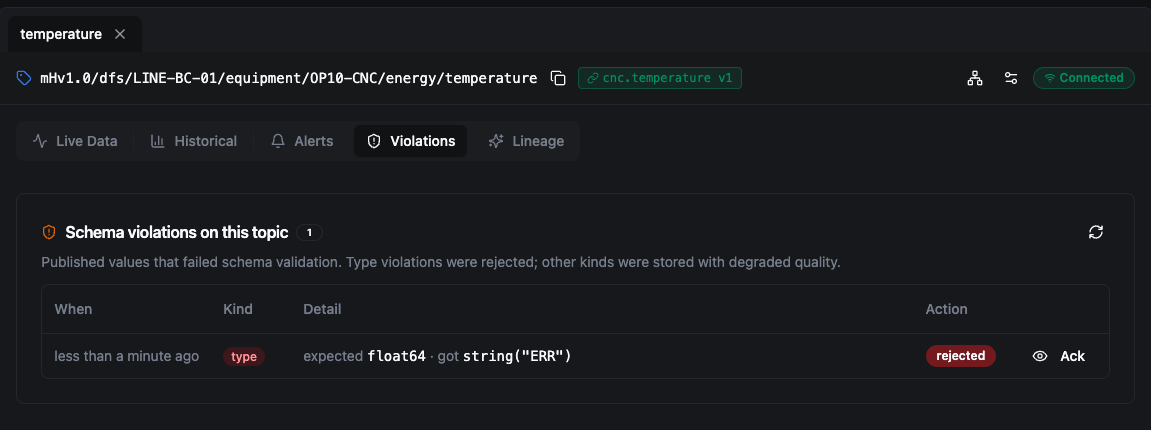
A type violation: a text value was published where the schema expects a number. The Action column reads rejected — the publish was refused and nothing was stored.
This is the topic-scoped view of the org-wide feed. For the full list of violation kinds, how validation and alerting run in order, and the difference between the two, see the Alerts page and Schemas › Enforcement at publish time.
Violations only appear once the topic is bound to a schema. An unbound topic accepts every publish as-is. Use Bind schema in the topic header to attach a contract — see Schemas.
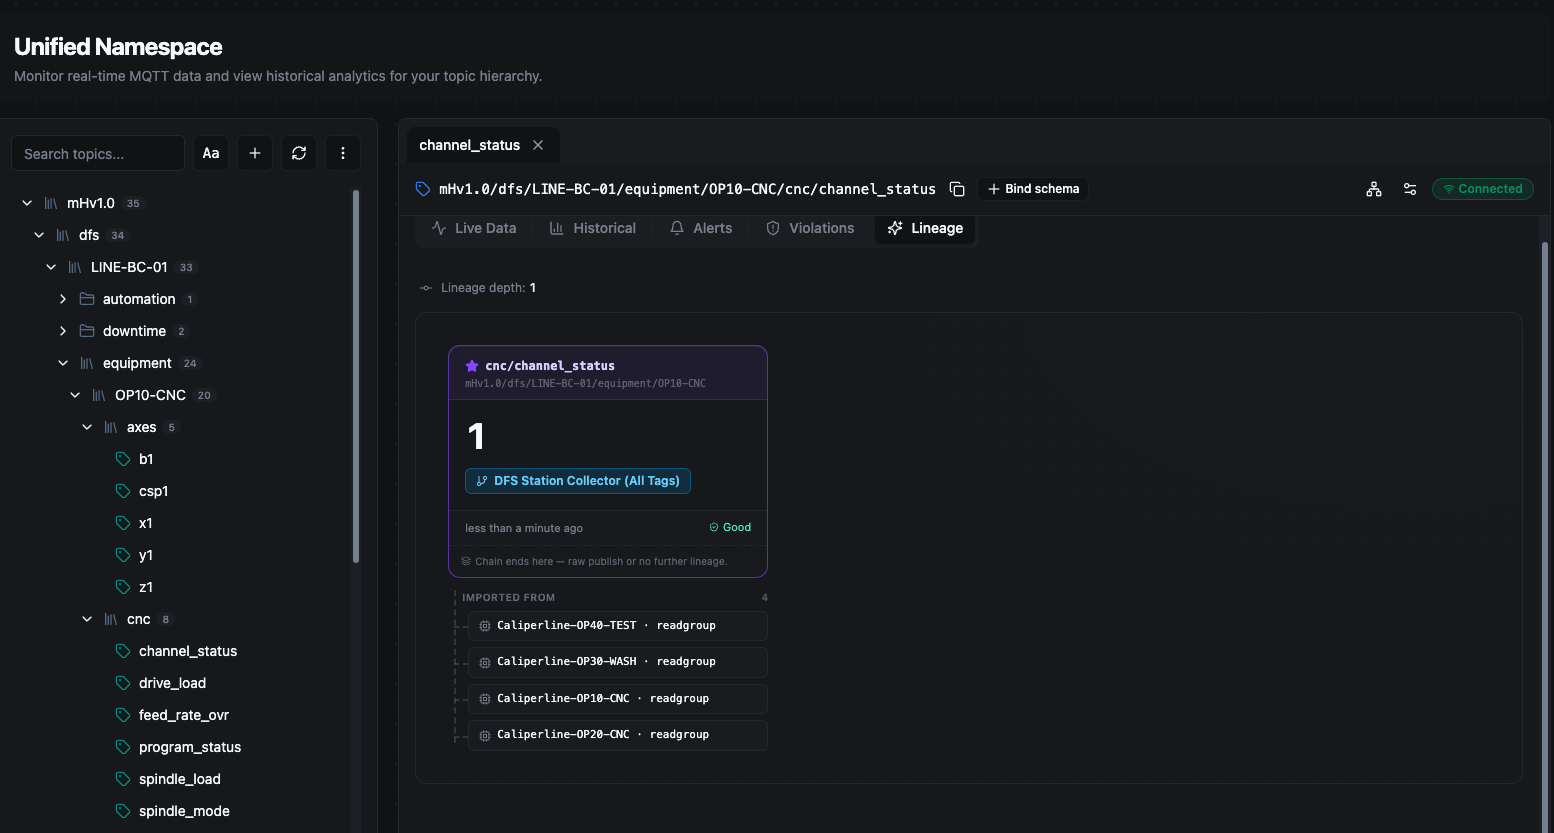
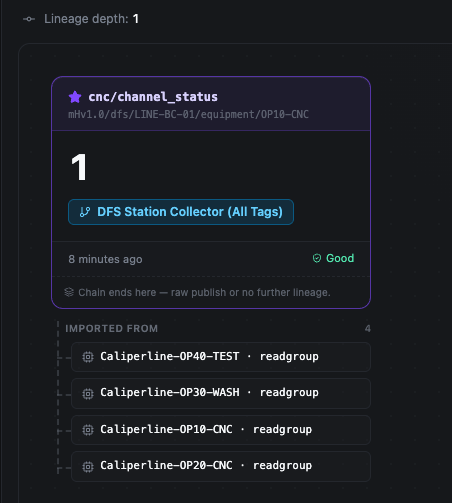
Lineage
The Lineage tab answers the single most-asked operator question — "why is this number?" — for the selected topic. It traces a value backwards through the chain of inputs that produced it, all the way to the raw field reads at the edge.
Why Lineage? When a computed KPI looks wrong — an OEE of 0.36, a counter that never moves — the next question is always where did this come from? Lineage replaces log-diving with a visual chain: every value carries a record of the inputs it was derived from, so you can walk from the result back to the sensor that started it.
This works because lineage is not inferred after the fact. When a pipeline computes a value, it records every input it consumes as it runs and stamps that provenance onto the record at publish time. The Lineage tab simply reads back what was already saved with the value.
Reading the chain
The chain is laid out left to right: the oldest ancestors are on the left and the value you are inspecting — marked with a ★ star — is on the right. Each column is one topic in the chain, and arrows between columns are labelled with the pipeline or computed KPI that produced the next value.
Lineage depth at the top tells you how many hops the chain spans. A depth of 1 means the value was published directly from a source with no upstream UNS topic feeding it; a deeper chain means the value was computed from other UNS topics, which were themselves computed from others, and so on.
Each card shows:
- Topic name and full path — which topic the value lives on.
- Value — the value active at that point in the chain. For ancestor columns this is the value as it was at the moment the result was derived, not necessarily its value now — so the chain reflects what the computation actually consumed.
- Source badge — the provenance of the value: the pipeline, computed KPI, or collector that produced it (for example DFS Station Collector (All Tags)).
- Quality and timestamp — the quality stamp applied at publish (Good, Uncertain, or Bad) and how long ago the value was written.
The Lineage tab traces a value back through the inputs that produced it.
Where the chain ends
When a card shows Chain ends here — raw publish or no further lineage, you have reached a leaf: the value was published directly from the edge rather than computed from other UNS topics, so there is no further UNS topic to walk back to.
A leaf card lists its Imported from sources — the non-UNS systems that fed the value, such as Modbus, OPC UA, or Kafka connections. These appear as read groups (for example Caliperline-OP10-CNC · readgroup, a batch read against a connection) and are the terminal edge of the chain: they point outside the Unified Namespace to the physical devices and connections supplying the data, so they cannot be expanded further.
A raw-published value: the chain ends here, with its edge sources listed under Imported from.
A worked example
Suppose oee/score reads 0.684. Opening Lineage on that topic shows three input columns feeding it — availability, performance, and quality — because the OEE pipeline recorded those three topics as the inputs it consumed when it computed the score. Walk back one of them, say availability, and its own chain appears: the downtime and planned-time topics it was calculated from. Keep walking and you eventually reach a card that says chain ends here, listing the read group that pulled the raw counts off the line. At no point did you read a log — every hop was recorded with the value when it was published.
When an unexpected downtime alert appears, subscribe to the relevant topic and watch the Live Data chart to confirm whether the anomaly repeats. Then switch to Historical to see when it first started.
Quality Deviation Tracking
Quality teams can monitor tolerance thresholds on the Live Data chart. The moment a deviation occurs, the Historical tab reveals whether it is an isolated event or part of a recurring pattern.
Maintenance Verification
After preventative maintenance, subscribe to the sensor topic and check the Live Data chart to confirm accurate readings. Use the Historical tab to compare post-maintenance values against pre-maintenance baselines.
Shift Handover
Outgoing operators can export the last shift's historical data and attach it to the handover report, giving the incoming team a clear picture of what happened.
Root-Cause Tracing
When a computed KPI reads wrong, open the Lineage tab and walk the chain back to find which input — or which raw edge read — is responsible, without diving through pipeline logs.
Data Explorer brings real-time observation, historical analysis, and data lineage into a single workspace. Whether you are tracking a live anomaly, investigating a past event, or tracing why a value is what it is, every team works from the same source of truth.